
|
|||||
|
 | |
| |
| |
| |
| |
| |
|
Gene: IQCA1 |
Gene summary for IQCA1 |
| Gene information | Species | Human | Gene symbol | IQCA1 | Gene ID | 79781 |
| Gene name | IQ motif containing with AAA domain 1 | |
| Gene Alias | 4930465P12Rik | |
| Cytomap | 2q37.2-q37.3 | |
| Gene Type | protein-coding | GO ID | GO:0005575 | UniProtAcc | Q86XH1 |
Top |
Malignant transformation analysis |
| Identification of the aberrant gene expression in precancerous and cancerous lesions by comparing the gene expression of stem-like cells in diseased tissues with normal stem cells |
| Entrez ID | Symbol | Replicates | Species | Organ | Tissue | Adj P-value | Log2FC | Malignancy |
| 79781 | IQCA1 | LZE4T | Human | Esophagus | ESCC | 9.10e-05 | 2.53e-01 | 0.0811 |
| 79781 | IQCA1 | LZE24T | Human | Esophagus | ESCC | 7.90e-10 | 3.12e-01 | 0.0596 |
| 79781 | IQCA1 | P2T-E | Human | Esophagus | ESCC | 1.33e-07 | 1.92e-01 | 0.1177 |
| 79781 | IQCA1 | P4T-E | Human | Esophagus | ESCC | 3.10e-10 | 2.62e-01 | 0.1323 |
| 79781 | IQCA1 | P5T-E | Human | Esophagus | ESCC | 9.20e-11 | 1.57e-01 | 0.1327 |
| 79781 | IQCA1 | P8T-E | Human | Esophagus | ESCC | 5.17e-11 | 1.96e-01 | 0.0889 |
| 79781 | IQCA1 | P10T-E | Human | Esophagus | ESCC | 9.07e-22 | 3.45e-01 | 0.116 |
| 79781 | IQCA1 | P11T-E | Human | Esophagus | ESCC | 3.13e-05 | 2.34e-01 | 0.1426 |
| 79781 | IQCA1 | P12T-E | Human | Esophagus | ESCC | 3.48e-52 | 1.00e+00 | 0.1122 |
| 79781 | IQCA1 | P15T-E | Human | Esophagus | ESCC | 5.28e-09 | 2.67e-01 | 0.1149 |
| 79781 | IQCA1 | P16T-E | Human | Esophagus | ESCC | 3.72e-13 | 3.37e-01 | 0.1153 |
| 79781 | IQCA1 | P21T-E | Human | Esophagus | ESCC | 5.11e-06 | 1.41e-01 | 0.1617 |
| 79781 | IQCA1 | P27T-E | Human | Esophagus | ESCC | 5.56e-35 | 6.51e-01 | 0.1055 |
| 79781 | IQCA1 | P28T-E | Human | Esophagus | ESCC | 6.37e-07 | 8.25e-02 | 0.1149 |
| 79781 | IQCA1 | P30T-E | Human | Esophagus | ESCC | 6.20e-13 | 4.54e-01 | 0.137 |
| 79781 | IQCA1 | P32T-E | Human | Esophagus | ESCC | 1.50e-16 | 3.10e-01 | 0.1666 |
| 79781 | IQCA1 | P39T-E | Human | Esophagus | ESCC | 1.81e-07 | 1.24e-01 | 0.0894 |
| 79781 | IQCA1 | P40T-E | Human | Esophagus | ESCC | 1.23e-03 | 1.95e-01 | 0.109 |
| 79781 | IQCA1 | P42T-E | Human | Esophagus | ESCC | 4.31e-05 | 2.09e-01 | 0.1175 |
| 79781 | IQCA1 | P48T-E | Human | Esophagus | ESCC | 1.73e-09 | 2.36e-01 | 0.0959 |
| Page: 1 2 3 |
| Tissue | Expression Dynamics | Abbreviation |
| Esophagus | 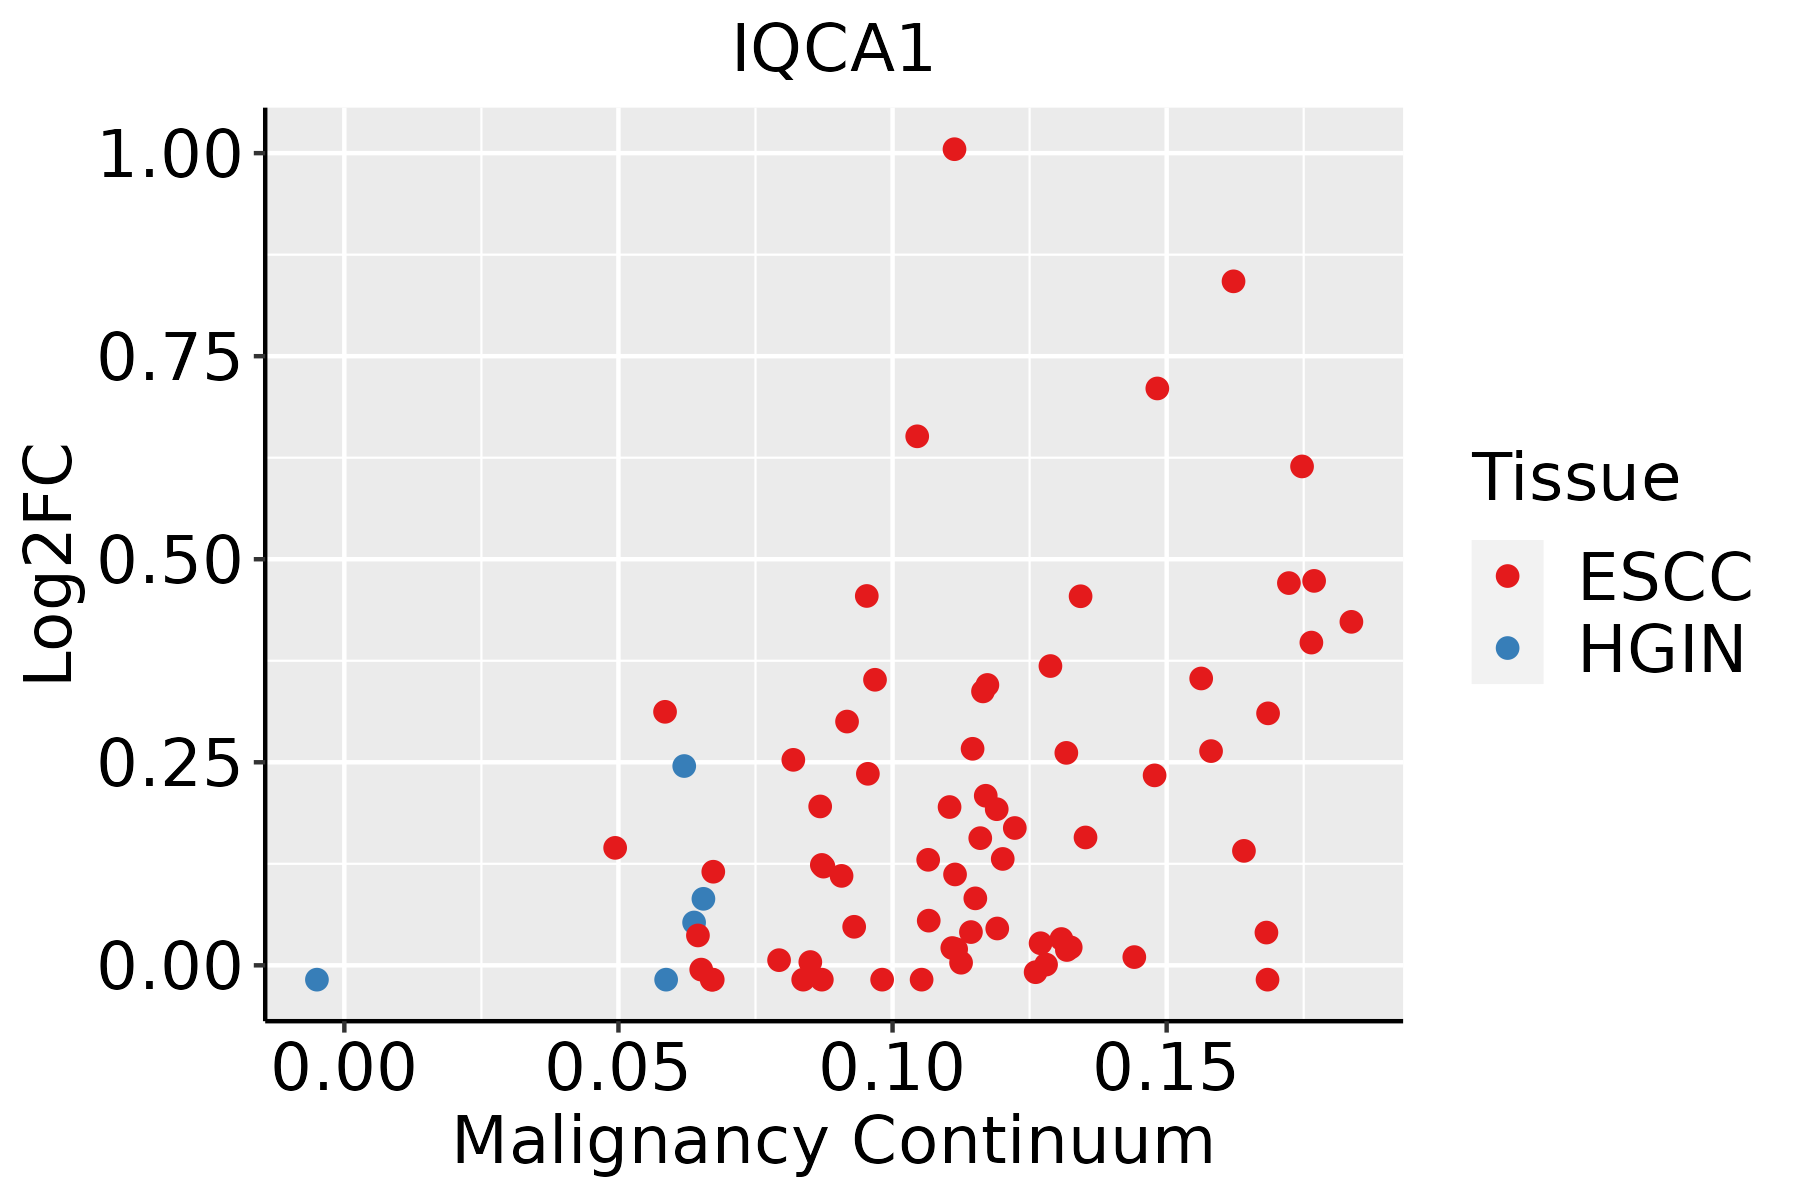 | ESCC: Esophageal squamous cell carcinoma |
| HGIN: High-grade intraepithelial neoplasias | ||
| LGIN: Low-grade intraepithelial neoplasias | ||
| Liver |  | HCC: Hepatocellular carcinoma |
| NAFLD: Non-alcoholic fatty liver disease | ||
| Oral Cavity | 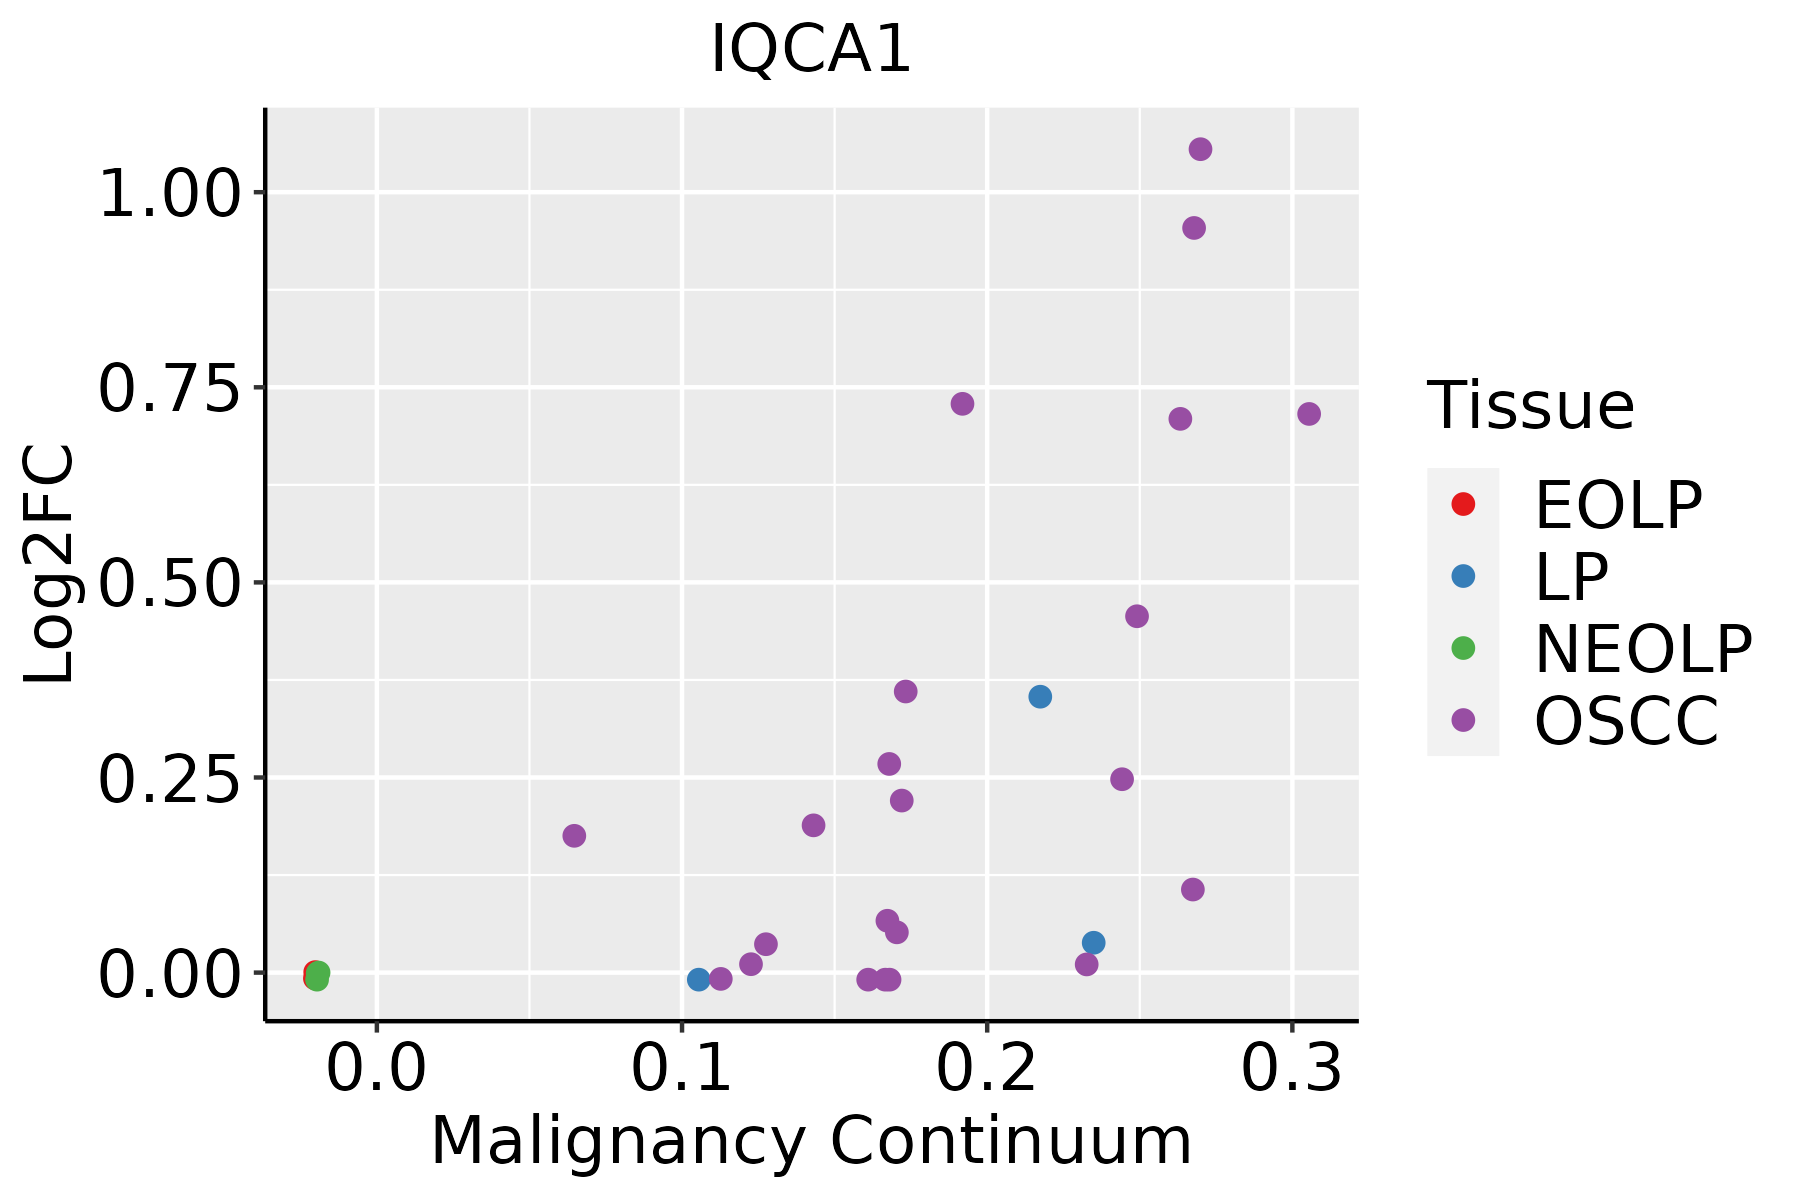 | EOLP: Erosive Oral lichen planus |
| LP: leukoplakia | ||
| NEOLP: Non-erosive oral lichen planus | ||
| OSCC: Oral squamous cell carcinoma | ||
| Thyroid | 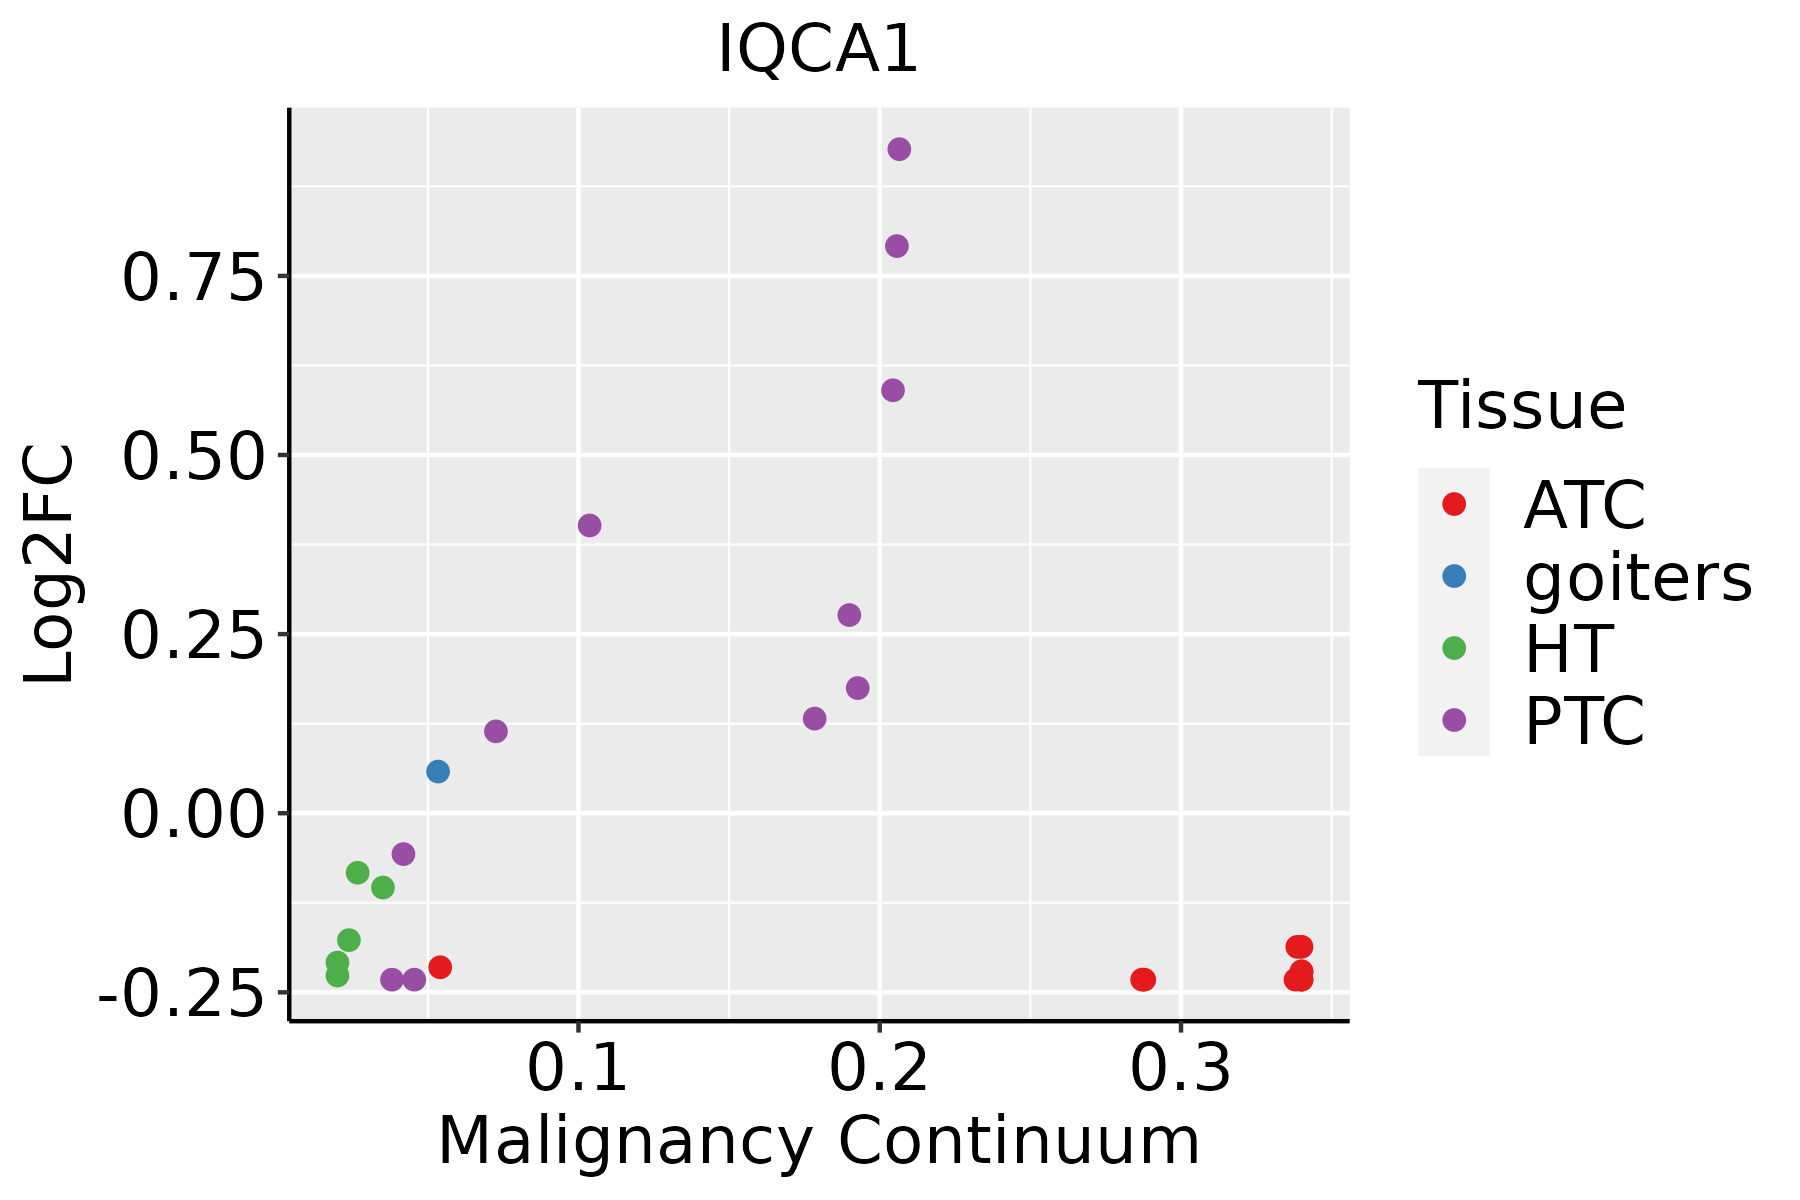 | ATC: Anaplastic thyroid cancer |
| HT: Hashimoto's thyroiditis | ||
| PTC: Papillary thyroid cancer |
| ∗log2FC in expression of this searched gene in stem-like cells from each diseased tissue sample relative to stem-like cells in normal samples in each tissue plotted against the malignancy continuum. Samples are colored based on if they are from different disease stage. |
Top |
Malignant transformation related pathway analysis |
| Find out the enriched GO biological processes and KEGG pathways involved in transition from healthy to precancer to cancer |
| Tissue | Disease Stage | Enriched GO biological Processes |
| Colorectum | AD |  |
| Colorectum | SER |  |
| Colorectum | MSS |  |
| Colorectum | MSI-H |  |
| Colorectum | FAP |  |
| ∗Top 15 enriched GO BP terms are showed in the bar plot of each disease state in each tissue. Each row represents a significant GO biological process which is colored according to the -log10(p.adjust). |
| Page: 1 2 3 4 5 6 7 8 9 |
| GO ID | Tissue | Disease Stage | Description | Gene Ratio | Bg Ratio | pvalue | p.adjust | Count |
| Page: 1 |
| Pathway ID | Tissue | Disease Stage | Description | Gene Ratio | Bg Ratio | pvalue | p.adjust | qvalue | Count |
| Page: 1 |
Top |
Cell-cell communication analysis |
| Identification of potential cell-cell interactions between two cell types and their ligand-receptor pairs for different disease states |
| Ligand | Receptor | LRpair | Pathway | Tissue | Disease Stage |
| Page: 1 |
Top |
Single-cell gene regulatory network inference analysis |
| Find out the significant the regulons (TFs) and the target genes of each regulon across cell types for different disease states |
| TF | Cell Type | Tissue | Disease Stage | Target Gene | RSS | Regulon Activity |
| ∗The dot plots of a searched regulon are shown for all cell subpopulations in each disease state of each tissue based on the regulon specific score inferred using pySCENIC and by calculating the average expression. |
| Page: 1 |
Top |
Somatic mutation of malignant transformation related genes |
| Annotation of somatic variants for genes involved in malignant transformation |
| Hugo Symbol | Variant Class | Variant Classification | dbSNP RS | HGVSc | HGVSp | HGVSp Short | SWISSPROT | BIOTYPE | SIFT | PolyPhen | Tumor Sample Barcode | Tissue | Histology | Sex | Age | Stage | Therapy Types | Drugs | Outcome |
| IQCA1 | SNV | Missense_Mutation | c.1891A>G | p.Lys631Glu | p.K631E | protein_coding | deleterious(0) | probably_damaging(1) | TCGA-A8-A08R-01 | Breast | breast invasive carcinoma | Female | <65 | I/II | Unknown | Unknown | SD | ||
| IQCA1 | SNV | Missense_Mutation | c.1939N>A | p.Glu647Lys | p.E647K | protein_coding | deleterious(0) | probably_damaging(0.997) | TCGA-AC-A23H-01 | Breast | breast invasive carcinoma | Female | >=65 | I/II | Unknown | Unknown | PD | ||
| IQCA1 | SNV | Missense_Mutation | novel | c.1596C>A | p.Ser532Arg | p.S532R | protein_coding | tolerated(0.08) | possibly_damaging(0.905) | TCGA-AN-A0FW-01 | Breast | breast invasive carcinoma | Female | >=65 | III/IV | Unknown | Unknown | SD | |
| IQCA1 | SNV | Missense_Mutation | rs764066130 | c.1353N>A | p.Met451Ile | p.M451I | protein_coding | deleterious(0.02) | probably_damaging(0.945) | TCGA-BH-A0EE-01 | Breast | breast invasive carcinoma | Female | >=65 | I/II | Chemotherapy | docetaxel | SD | |
| IQCA1 | SNV | Missense_Mutation | c.1166N>C | p.Glu389Ala | p.E389A | protein_coding | tolerated(0.23) | benign(0.057) | TCGA-BH-A0HL-01 | Breast | breast invasive carcinoma | Female | <65 | I/II | Chemotherapy | cyclophosphamide | SD | ||
| IQCA1 | SNV | Missense_Mutation | rs746418310 | c.1213N>A | p.Gly405Arg | p.G405R | protein_coding | deleterious(0) | possibly_damaging(0.781) | TCGA-BH-A1F8-01 | Breast | breast invasive carcinoma | Female | >=65 | III/IV | Unknown | Unknown | PD | |
| IQCA1 | insertion | Frame_Shift_Ins | novel | c.1591_1592insGGAAA | p.Tyr531TrpfsTer15 | p.Y531Wfs*15 | protein_coding | TCGA-AN-A0FX-01 | Breast | breast invasive carcinoma | Female | <65 | I/II | Unknown | Unknown | SD | |||
| IQCA1 | insertion | Frame_Shift_Ins | novel | c.1590_1591insAAAAGAAACAGAGGAACAATAAA | p.Tyr531LysfsTer21 | p.Y531Kfs*21 | protein_coding | TCGA-AN-A0FX-01 | Breast | breast invasive carcinoma | Female | <65 | I/II | Unknown | Unknown | SD | |||
| IQCA1 | SNV | Missense_Mutation | rs577893508 | c.1165G>A | p.Glu389Lys | p.E389K | protein_coding | tolerated(0.2) | benign(0.14) | TCGA-2W-A8YY-01 | Cervix | cervical & endocervical cancer | Female | <65 | I/II | Chemotherapy | cisplatin | CR | |
| IQCA1 | SNV | Missense_Mutation | novel | c.976N>T | p.Pro326Ser | p.P326S | protein_coding | deleterious(0) | probably_damaging(1) | TCGA-C5-A2LZ-01 | Cervix | cervical & endocervical cancer | Female | >=65 | III/IV | Unknown | Unknown | PD |
| Page: 1 2 3 4 5 6 7 8 9 10 11 12 |
Top |
Related drugs of malignant transformation related genes |
| Identification of chemicals and drugs interact with genes involved in malignant transfromation |
| (DGIdb 4.0) |
| Entrez ID | Symbol | Category | Interaction Types | Drug Claim Name | Drug Name | PMIDs |
| Page: 1 |

Copyright 2023-Present -The University of Texas Health Science Center at Houston |