
|
|||||
|
 | |
| |
| |
| |
| |
| |
|
Gene: IPO9 |
Gene summary for IPO9 |
| Gene information | Species | Human | Gene symbol | IPO9 | Gene ID | 55705 |
| Gene name | importin 9 | |
| Gene Alias | Imp9 | |
| Cytomap | 1q32.1 | |
| Gene Type | protein-coding | GO ID | GO:0006606 | UniProtAcc | Q96P70 |
Top |
Malignant transformation analysis |
| Identification of the aberrant gene expression in precancerous and cancerous lesions by comparing the gene expression of stem-like cells in diseased tissues with normal stem cells |
| Entrez ID | Symbol | Replicates | Species | Organ | Tissue | Adj P-value | Log2FC | Malignancy |
| 55705 | IPO9 | HSIL_HPV_2 | Human | Cervix | HSIL_HPV | 4.98e-04 | 1.61e-01 | 0.0208 |
| 55705 | IPO9 | CCI_1 | Human | Cervix | CC | 4.31e-15 | 1.11e+00 | 0.528 |
| 55705 | IPO9 | CCI_3 | Human | Cervix | CC | 1.91e-16 | 9.51e-01 | 0.516 |
| 55705 | IPO9 | LZE2T | Human | Esophagus | ESCC | 5.30e-04 | 7.95e-01 | 0.082 |
| 55705 | IPO9 | LZE4T | Human | Esophagus | ESCC | 2.13e-11 | 2.93e-01 | 0.0811 |
| 55705 | IPO9 | LZE5T | Human | Esophagus | ESCC | 1.03e-04 | 3.02e-01 | 0.0514 |
| 55705 | IPO9 | LZE7T | Human | Esophagus | ESCC | 1.22e-20 | 1.07e+00 | 0.0667 |
| 55705 | IPO9 | LZE8T | Human | Esophagus | ESCC | 2.36e-05 | 1.17e-01 | 0.067 |
| 55705 | IPO9 | LZE20T | Human | Esophagus | ESCC | 1.25e-03 | 5.84e-02 | 0.0662 |
| 55705 | IPO9 | LZE22T | Human | Esophagus | ESCC | 1.17e-05 | 2.19e-01 | 0.068 |
| 55705 | IPO9 | LZE24T | Human | Esophagus | ESCC | 2.47e-16 | 3.48e-01 | 0.0596 |
| 55705 | IPO9 | LZE6T | Human | Esophagus | ESCC | 2.22e-06 | 1.43e-01 | 0.0845 |
| 55705 | IPO9 | P1T-E | Human | Esophagus | ESCC | 2.76e-04 | 1.98e-01 | 0.0875 |
| 55705 | IPO9 | P2T-E | Human | Esophagus | ESCC | 6.68e-26 | 6.07e-01 | 0.1177 |
| 55705 | IPO9 | P4T-E | Human | Esophagus | ESCC | 2.79e-17 | 4.73e-01 | 0.1323 |
| 55705 | IPO9 | P5T-E | Human | Esophagus | ESCC | 5.29e-09 | 2.62e-01 | 0.1327 |
| 55705 | IPO9 | P8T-E | Human | Esophagus | ESCC | 4.15e-18 | 3.87e-01 | 0.0889 |
| 55705 | IPO9 | P9T-E | Human | Esophagus | ESCC | 3.90e-12 | 2.65e-01 | 0.1131 |
| 55705 | IPO9 | P10T-E | Human | Esophagus | ESCC | 2.31e-44 | 8.96e-01 | 0.116 |
| 55705 | IPO9 | P11T-E | Human | Esophagus | ESCC | 5.07e-10 | 3.67e-01 | 0.1426 |
| Page: 1 2 3 4 5 6 7 |
| Tissue | Expression Dynamics | Abbreviation |
| Cervix | 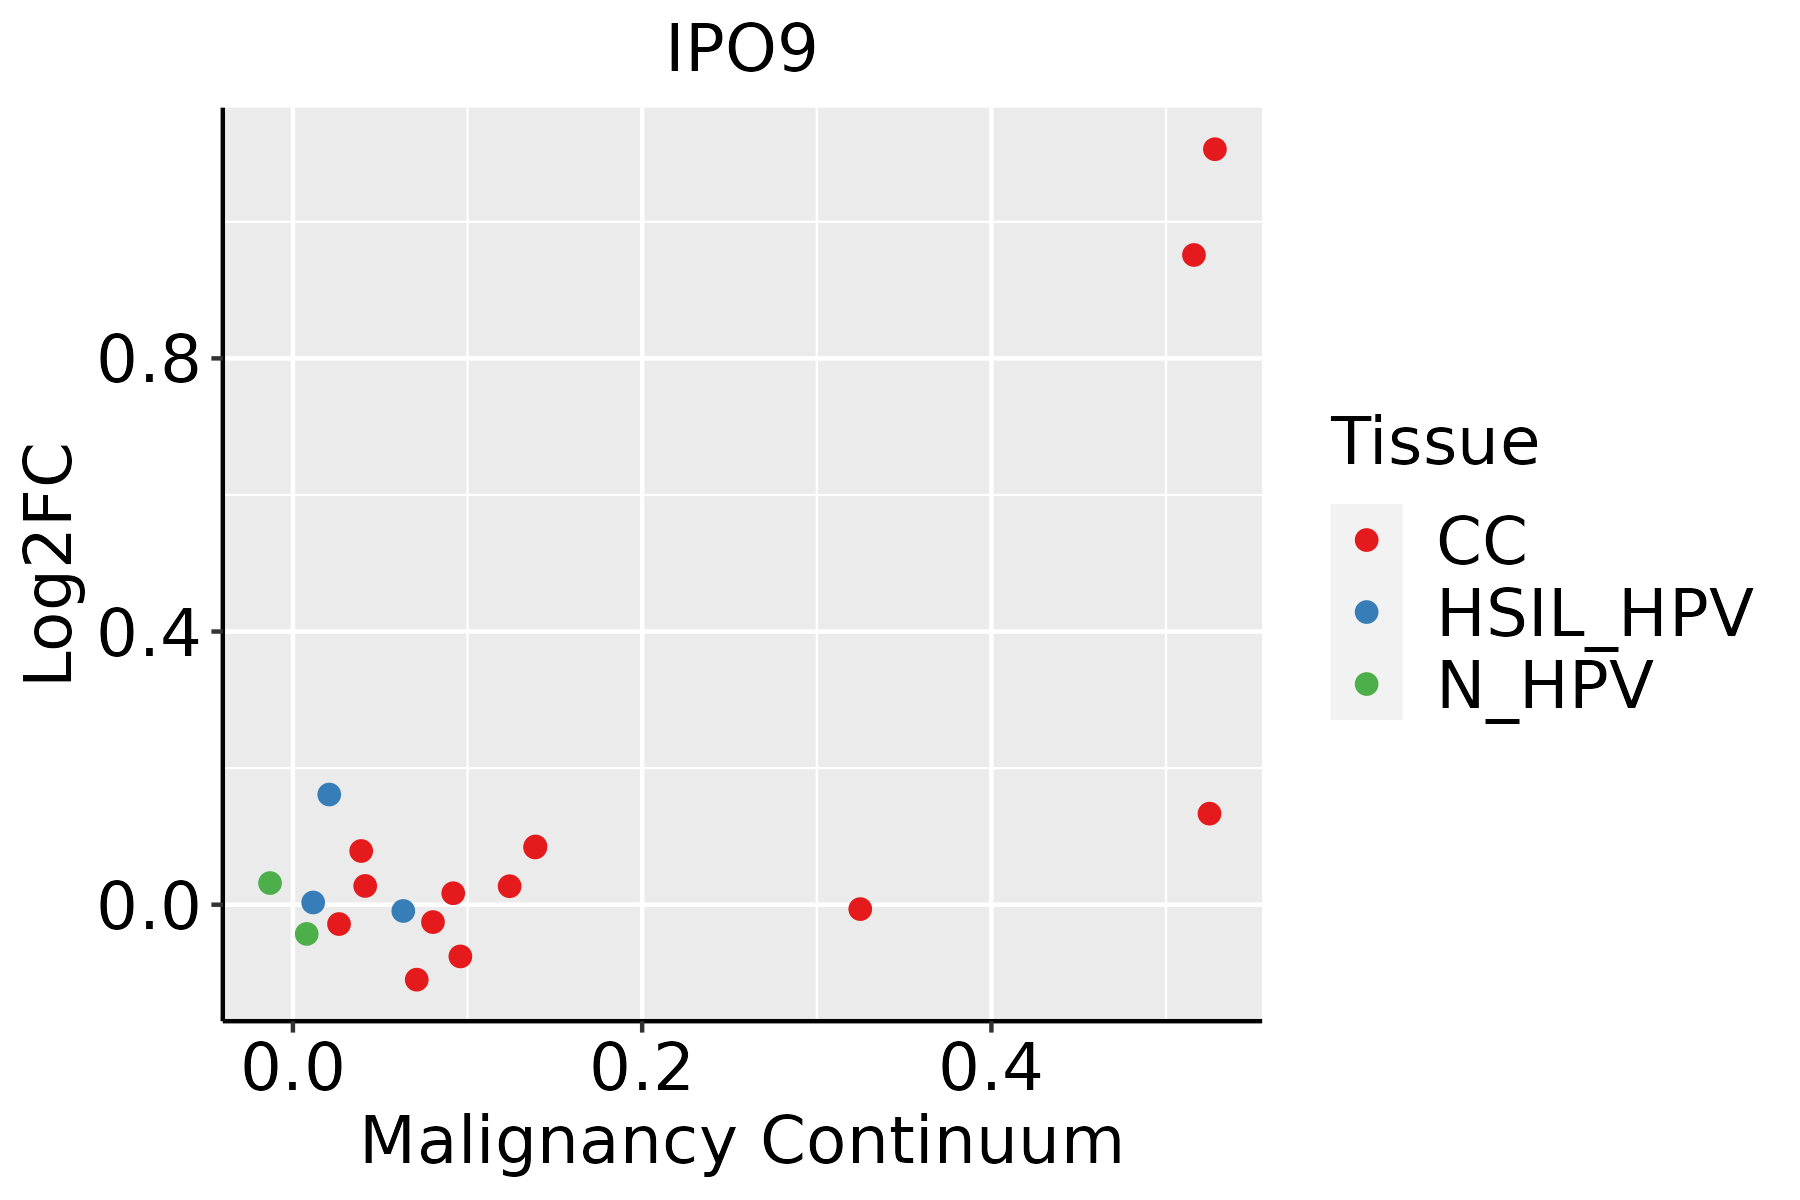 | CC: Cervix cancer |
| HSIL_HPV: HPV-infected high-grade squamous intraepithelial lesions | ||
| N_HPV: HPV-infected normal cervix | ||
| Esophagus | 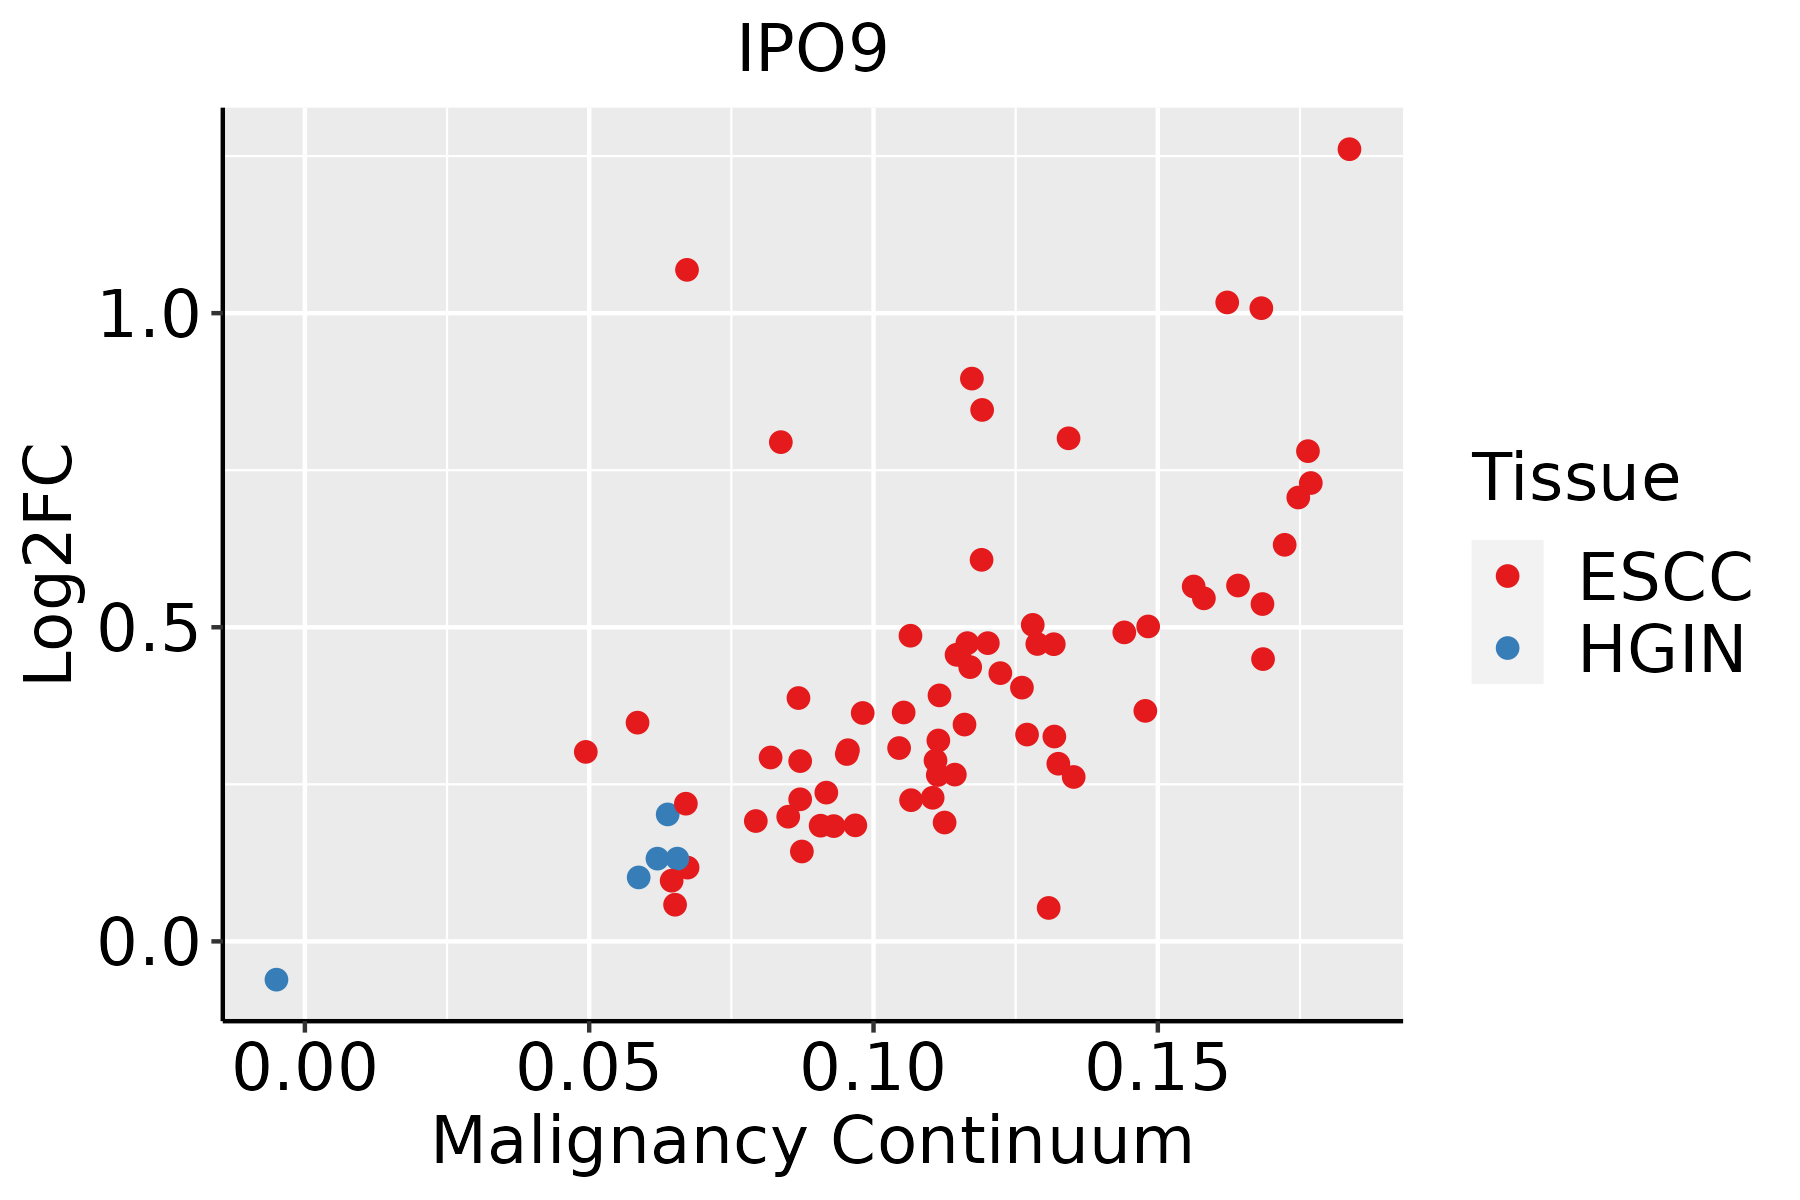 | ESCC: Esophageal squamous cell carcinoma |
| HGIN: High-grade intraepithelial neoplasias | ||
| LGIN: Low-grade intraepithelial neoplasias | ||
| Liver | 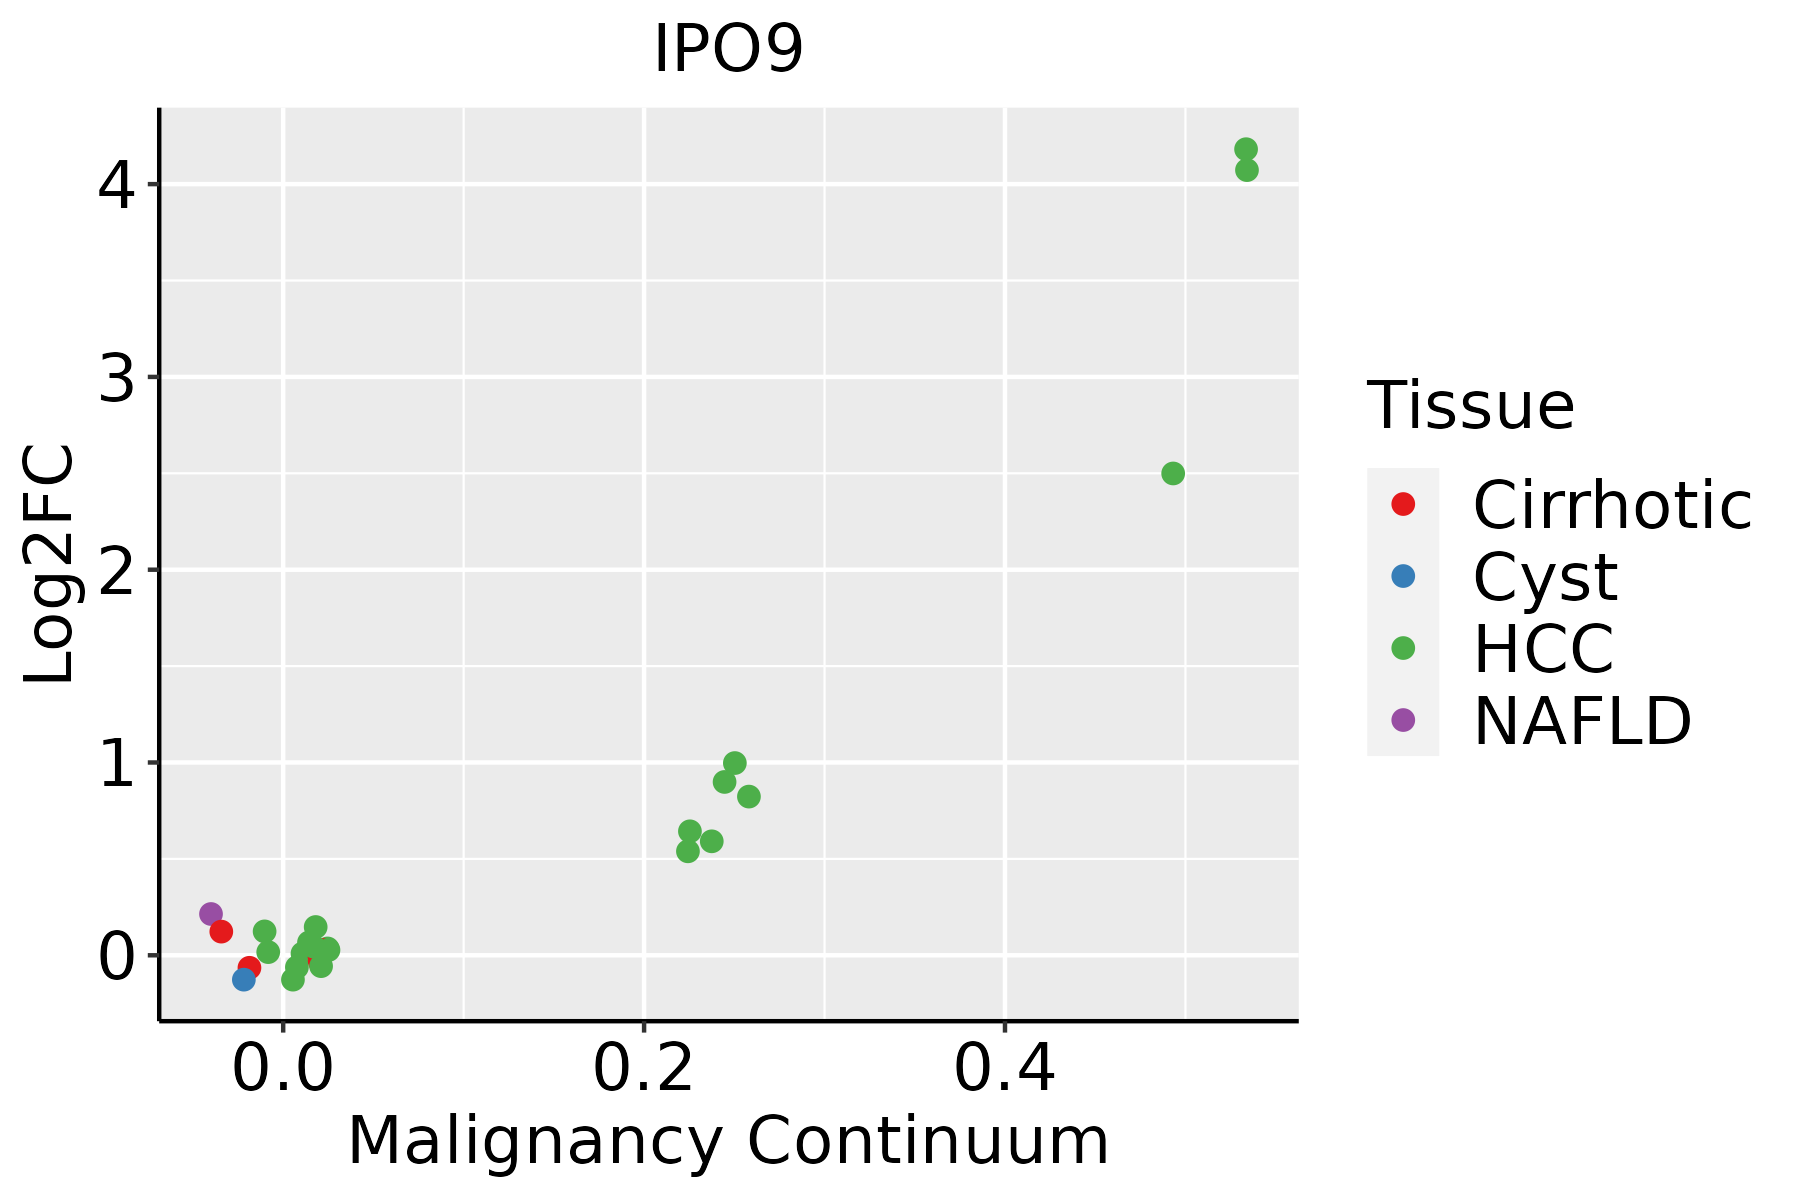 | HCC: Hepatocellular carcinoma |
| NAFLD: Non-alcoholic fatty liver disease | ||
| Oral Cavity |  | EOLP: Erosive Oral lichen planus |
| LP: leukoplakia | ||
| NEOLP: Non-erosive oral lichen planus | ||
| OSCC: Oral squamous cell carcinoma | ||
| Prostate | 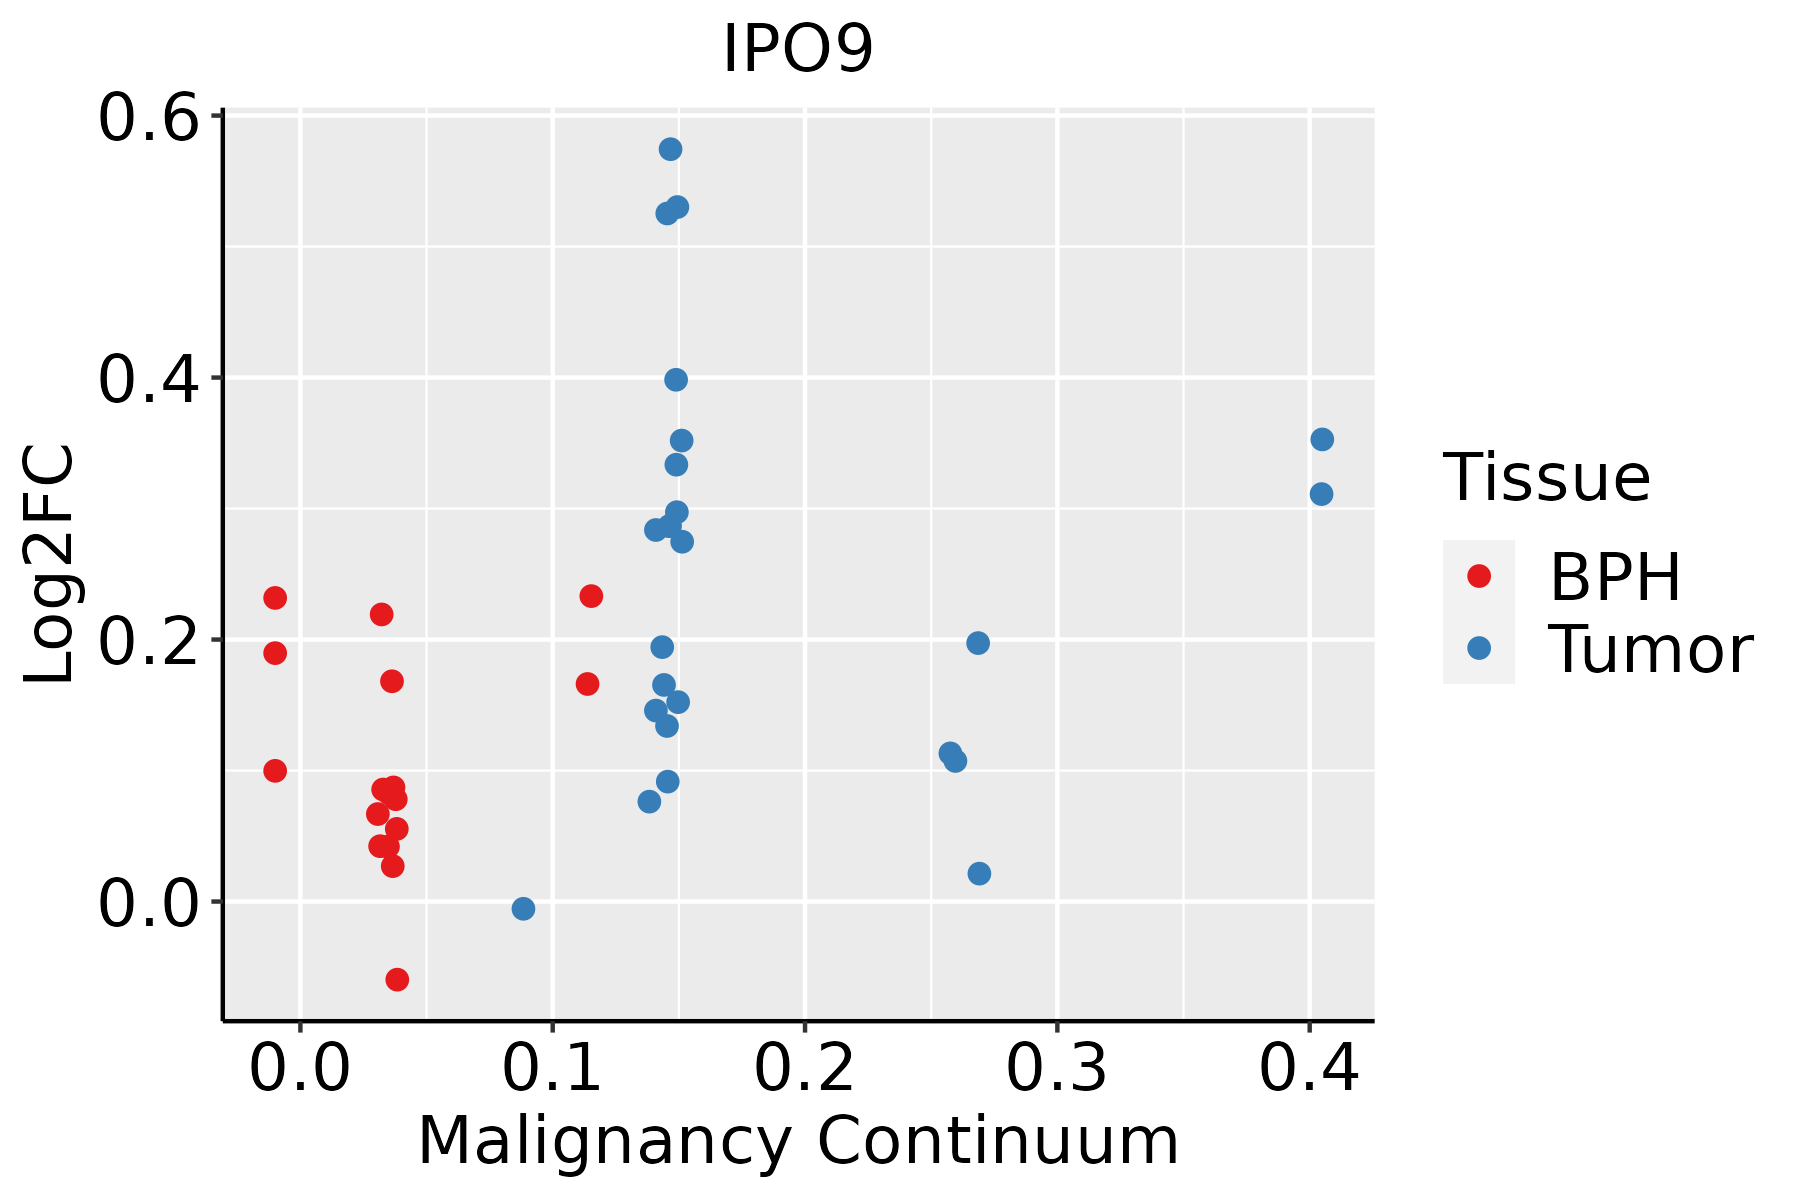 | BPH: Benign Prostatic Hyperplasia |
| Skin |  | AK: Actinic keratosis |
| cSCC: Cutaneous squamous cell carcinoma | ||
| SCCIS:squamous cell carcinoma in situ | ||
| Thyroid | 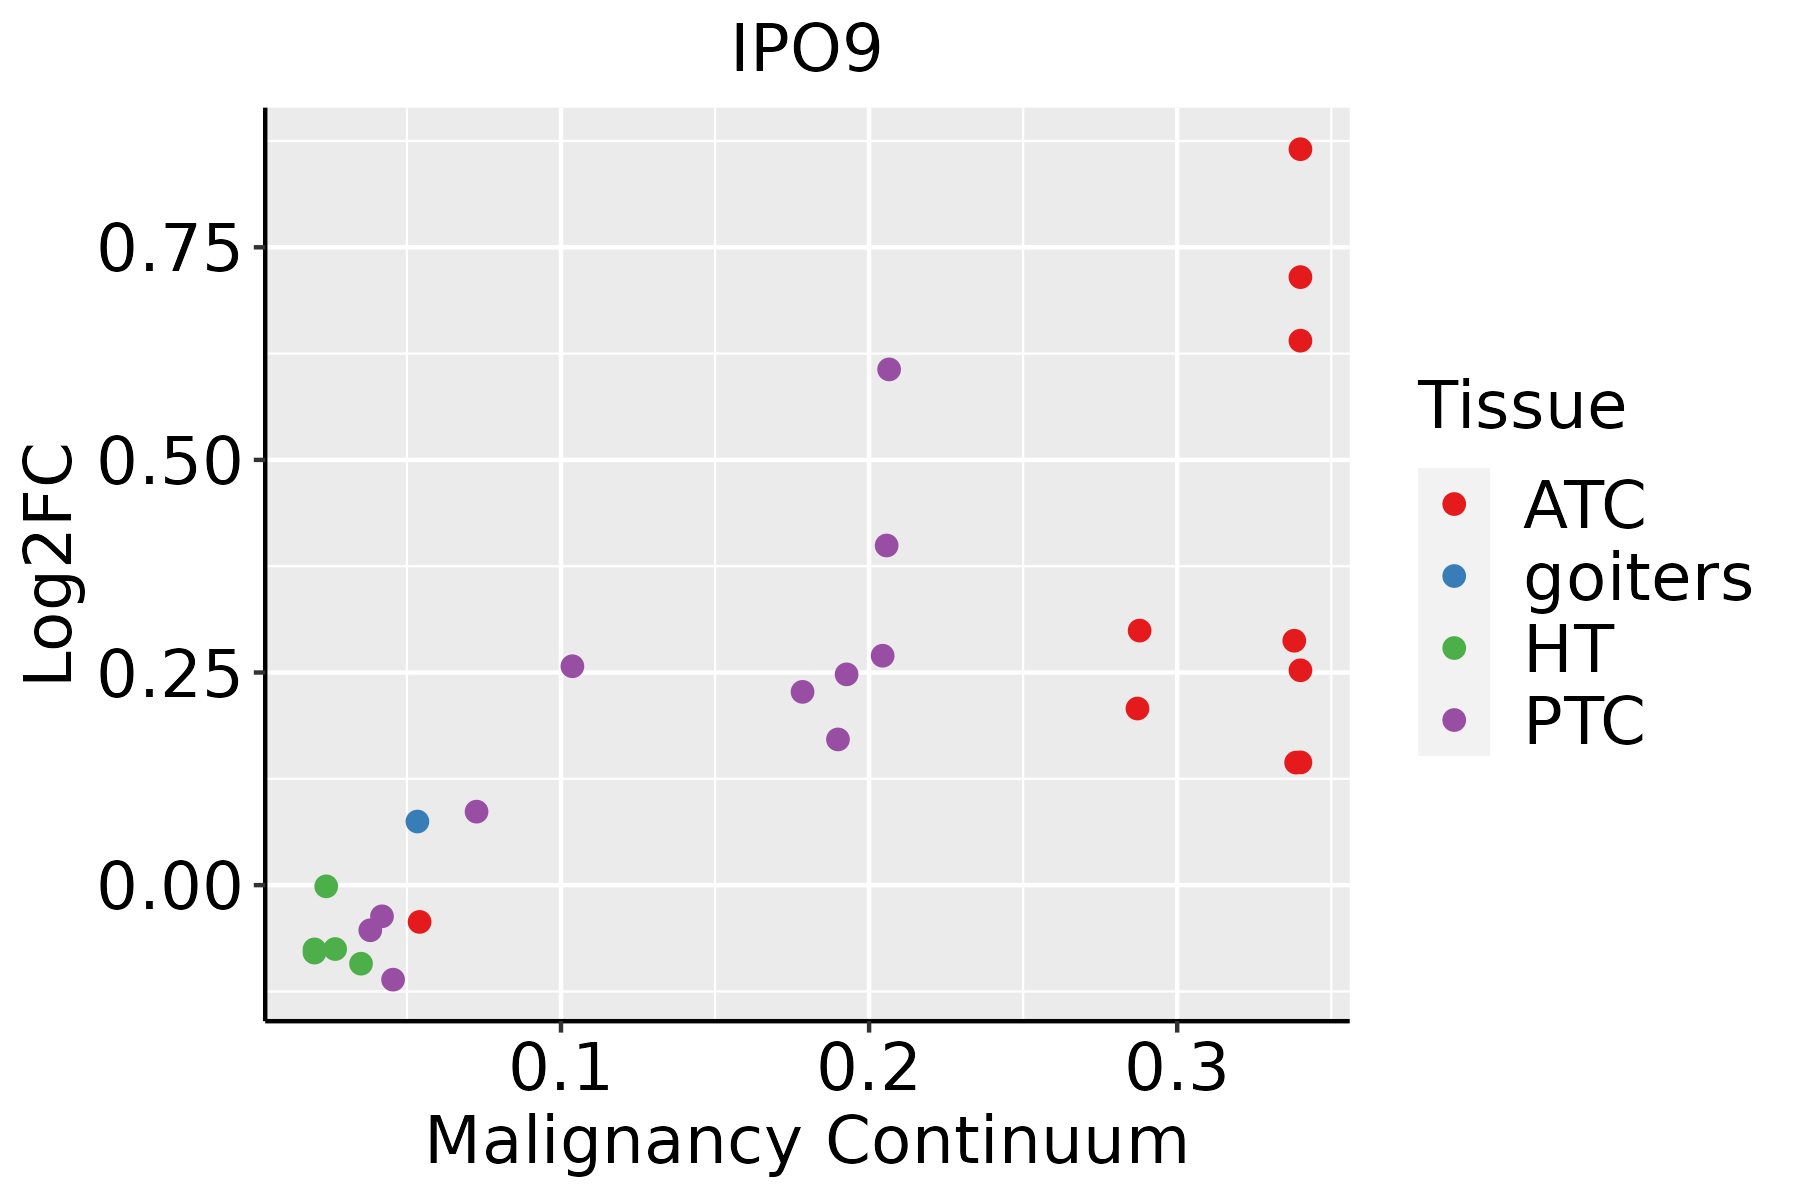 | ATC: Anaplastic thyroid cancer |
| HT: Hashimoto's thyroiditis | ||
| PTC: Papillary thyroid cancer |
| ∗log2FC in expression of this searched gene in stem-like cells from each diseased tissue sample relative to stem-like cells in normal samples in each tissue plotted against the malignancy continuum. Samples are colored based on if they are from different disease stage. |
Top |
Malignant transformation related pathway analysis |
| Find out the enriched GO biological processes and KEGG pathways involved in transition from healthy to precancer to cancer |
| Tissue | Disease Stage | Enriched GO biological Processes |
| Colorectum | AD |  |
| Colorectum | SER |  |
| Colorectum | MSS |  |
| Colorectum | MSI-H |  |
| Colorectum | FAP |  |
| ∗Top 15 enriched GO BP terms are showed in the bar plot of each disease state in each tissue. Each row represents a significant GO biological process which is colored according to the -log10(p.adjust). |
| Page: 1 2 3 4 5 6 7 8 9 |
| GO ID | Tissue | Disease Stage | Description | Gene Ratio | Bg Ratio | pvalue | p.adjust | Count |
| GO:00725949 | Cervix | CC | establishment of protein localization to organelle | 99/2311 | 422/18723 | 1.23e-10 | 2.11e-08 | 99 |
| GO:00069139 | Cervix | CC | nucleocytoplasmic transport | 71/2311 | 301/18723 | 4.04e-08 | 2.54e-06 | 71 |
| GO:00511699 | Cervix | CC | nuclear transport | 71/2311 | 301/18723 | 4.04e-08 | 2.54e-06 | 71 |
| GO:00345048 | Cervix | CC | protein localization to nucleus | 68/2311 | 290/18723 | 9.91e-08 | 5.25e-06 | 68 |
| GO:00170388 | Cervix | CC | protein import | 48/2311 | 206/18723 | 8.62e-06 | 1.98e-04 | 48 |
| GO:00511707 | Cervix | CC | import into nucleus | 38/2311 | 159/18723 | 3.98e-05 | 6.18e-04 | 38 |
| GO:00066067 | Cervix | CC | protein import into nucleus | 37/2311 | 155/18723 | 5.13e-05 | 7.71e-04 | 37 |
| GO:007259414 | Cervix | HSIL_HPV | establishment of protein localization to organelle | 29/737 | 422/18723 | 2.71e-03 | 2.58e-02 | 29 |
| GO:003450412 | Cervix | HSIL_HPV | protein localization to nucleus | 21/737 | 290/18723 | 5.53e-03 | 4.45e-02 | 21 |
| GO:0072594110 | Esophagus | ESCC | establishment of protein localization to organelle | 311/8552 | 422/18723 | 3.02e-32 | 2.13e-29 | 311 |
| GO:0006913110 | Esophagus | ESCC | nucleocytoplasmic transport | 230/8552 | 301/18723 | 6.04e-28 | 2.02e-25 | 230 |
| GO:0051169110 | Esophagus | ESCC | nuclear transport | 230/8552 | 301/18723 | 6.04e-28 | 2.02e-25 | 230 |
| GO:003450418 | Esophagus | ESCC | protein localization to nucleus | 211/8552 | 290/18723 | 4.06e-21 | 6.60e-19 | 211 |
| GO:001703818 | Esophagus | ESCC | protein import | 149/8552 | 206/18723 | 5.90e-15 | 3.31e-13 | 149 |
| GO:005117014 | Esophagus | ESCC | import into nucleus | 111/8552 | 159/18723 | 5.69e-10 | 1.44e-08 | 111 |
| GO:000660613 | Esophagus | ESCC | protein import into nucleus | 108/8552 | 155/18723 | 1.16e-09 | 2.77e-08 | 108 |
| GO:007259422 | Liver | HCC | establishment of protein localization to organelle | 299/7958 | 422/18723 | 1.06e-32 | 6.10e-30 | 299 |
| GO:000691322 | Liver | HCC | nucleocytoplasmic transport | 208/7958 | 301/18723 | 5.51e-21 | 8.12e-19 | 208 |
| GO:005116922 | Liver | HCC | nuclear transport | 208/7958 | 301/18723 | 5.51e-21 | 8.12e-19 | 208 |
| GO:003450421 | Liver | HCC | protein localization to nucleus | 194/7958 | 290/18723 | 2.84e-17 | 2.85e-15 | 194 |
| Page: 1 2 3 4 |
| Pathway ID | Tissue | Disease Stage | Description | Gene Ratio | Bg Ratio | pvalue | p.adjust | qvalue | Count |
| hsa0301321 | Esophagus | ESCC | Nucleocytoplasmic transport | 89/4205 | 108/8465 | 1.20e-12 | 2.37e-11 | 1.21e-11 | 89 |
| hsa0301331 | Esophagus | ESCC | Nucleocytoplasmic transport | 89/4205 | 108/8465 | 1.20e-12 | 2.37e-11 | 1.21e-11 | 89 |
| hsa03013 | Liver | HCC | Nucleocytoplasmic transport | 81/4020 | 108/8465 | 4.28e-09 | 6.83e-08 | 3.80e-08 | 81 |
| hsa030131 | Liver | HCC | Nucleocytoplasmic transport | 81/4020 | 108/8465 | 4.28e-09 | 6.83e-08 | 3.80e-08 | 81 |
| hsa030136 | Oral cavity | OSCC | Nucleocytoplasmic transport | 82/3704 | 108/8465 | 7.93e-12 | 1.33e-10 | 6.77e-11 | 82 |
| hsa0301311 | Oral cavity | OSCC | Nucleocytoplasmic transport | 82/3704 | 108/8465 | 7.93e-12 | 1.33e-10 | 6.77e-11 | 82 |
| hsa030134 | Oral cavity | EOLP | Nucleocytoplasmic transport | 34/1218 | 108/8465 | 4.24e-06 | 2.91e-05 | 1.72e-05 | 34 |
| hsa030135 | Oral cavity | EOLP | Nucleocytoplasmic transport | 34/1218 | 108/8465 | 4.24e-06 | 2.91e-05 | 1.72e-05 | 34 |
| Page: 1 |
Top |
Cell-cell communication analysis |
| Identification of potential cell-cell interactions between two cell types and their ligand-receptor pairs for different disease states |
| Ligand | Receptor | LRpair | Pathway | Tissue | Disease Stage |
| Page: 1 |
Top |
Single-cell gene regulatory network inference analysis |
| Find out the significant the regulons (TFs) and the target genes of each regulon across cell types for different disease states |
| TF | Cell Type | Tissue | Disease Stage | Target Gene | RSS | Regulon Activity |
| ∗The dot plots of a searched regulon are shown for all cell subpopulations in each disease state of each tissue based on the regulon specific score inferred using pySCENIC and by calculating the average expression. |
| Page: 1 |
Top |
Somatic mutation of malignant transformation related genes |
| Annotation of somatic variants for genes involved in malignant transformation |
| Hugo Symbol | Variant Class | Variant Classification | dbSNP RS | HGVSc | HGVSp | HGVSp Short | SWISSPROT | BIOTYPE | SIFT | PolyPhen | Tumor Sample Barcode | Tissue | Histology | Sex | Age | Stage | Therapy Types | Drugs | Outcome |
| IPO9 | SNV | Missense_Mutation | novel | c.664N>G | p.Ile222Val | p.I222V | Q96P70 | protein_coding | tolerated(0.26) | benign(0.215) | TCGA-A8-A08F-01 | Breast | breast invasive carcinoma | Female | <65 | III/IV | Chemotherapy | 5-fluorouracil | CR |
| IPO9 | SNV | Missense_Mutation | novel | c.1388A>C | p.Asp463Ala | p.D463A | Q96P70 | protein_coding | deleterious(0.04) | benign(0.003) | TCGA-AN-A0FS-01 | Breast | breast invasive carcinoma | Female | <65 | I/II | Unknown | Unknown | SD |
| IPO9 | SNV | Missense_Mutation | novel | c.1858N>T | p.Pro620Ser | p.P620S | Q96P70 | protein_coding | deleterious(0.01) | possibly_damaging(0.558) | TCGA-AR-A24U-01 | Breast | breast invasive carcinoma | Female | <65 | I/II | Chemotherapy | doxorubicin | SD |
| IPO9 | SNV | Missense_Mutation | novel | c.2529N>C | p.Trp843Cys | p.W843C | Q96P70 | protein_coding | deleterious(0) | probably_damaging(1) | TCGA-BH-A0B6-01 | Breast | breast invasive carcinoma | Female | <65 | I/II | Unknown | Unknown | SD |
| IPO9 | SNV | Missense_Mutation | novel | c.949G>C | p.Glu317Gln | p.E317Q | Q96P70 | protein_coding | tolerated(0.15) | benign(0.093) | TCGA-PE-A5DE-01 | Breast | breast invasive carcinoma | Female | <65 | I/II | Chemotherapy | taxotere | CR |
| IPO9 | insertion | Nonsense_Mutation | novel | c.186_187insTGTTTTTAGTAGAGACGGGGTTTTCACCATCTTGGCCAGG | p.Leu63CysfsTer3 | p.L63Cfs*3 | Q96P70 | protein_coding | TCGA-A8-A095-01 | Breast | breast invasive carcinoma | Female | <65 | I/II | Chemotherapy | 5-fluorouracil | CR | ||
| IPO9 | deletion | Frame_Shift_Del | c.1233_1234delNN | p.Asp412PhefsTer4 | p.D412Ffs*4 | Q96P70 | protein_coding | TCGA-A8-A09V-01 | Breast | breast invasive carcinoma | Female | <65 | I/II | Hormone Therapy | tamoxiphen | SD | |||
| IPO9 | insertion | Frame_Shift_Ins | novel | c.149_150insTCACCGGATCTCAAAACATCCAGCCCAAACATCAA | p.Glu51HisfsTer14 | p.E51Hfs*14 | Q96P70 | protein_coding | TCGA-AN-A0FX-01 | Breast | breast invasive carcinoma | Female | <65 | I/II | Unknown | Unknown | SD | ||
| IPO9 | insertion | Nonsense_Mutation | novel | c.2103_2104insATCTAGGGTATTCCCAATTTTTTTCTATTACAAA | p.Leu702IlefsTer2 | p.L702Ifs*2 | Q96P70 | protein_coding | TCGA-AN-A0FX-01 | Breast | breast invasive carcinoma | Female | <65 | I/II | Unknown | Unknown | SD | ||
| IPO9 | insertion | Frame_Shift_Ins | novel | c.414_415insTCATT | p.Asp139SerfsTer20 | p.D139Sfs*20 | Q96P70 | protein_coding | TCGA-B6-A0I9-01 | Breast | breast invasive carcinoma | Female | <65 | III/IV | Unknown | Unknown | PD |
| Page: 1 2 3 4 5 6 7 8 9 10 11 |
Top |
Related drugs of malignant transformation related genes |
| Identification of chemicals and drugs interact with genes involved in malignant transfromation |
| (DGIdb 4.0) |
| Entrez ID | Symbol | Category | Interaction Types | Drug Claim Name | Drug Name | PMIDs |
| 55705 | IPO9 | NA | MKC-1 | ENMD-981693 |
| Page: 1 |

Copyright 2023-Present -The University of Texas Health Science Center at Houston |