
|
|||||
|
 | |
| |
| |
| |
| |
| |
|
Gene: IPO8 |
Gene summary for IPO8 |
| Gene information | Species | Human | Gene symbol | IPO8 | Gene ID | 10526 |
| Gene name | importin 8 | |
| Gene Alias | RANBP8 | |
| Cytomap | 12p11.21 | |
| Gene Type | protein-coding | GO ID | GO:0006606 | UniProtAcc | O15397 |
Top |
Malignant transformation analysis |
| Identification of the aberrant gene expression in precancerous and cancerous lesions by comparing the gene expression of stem-like cells in diseased tissues with normal stem cells |
| Entrez ID | Symbol | Replicates | Species | Organ | Tissue | Adj P-value | Log2FC | Malignancy |
| 10526 | IPO8 | LZE4T | Human | Esophagus | ESCC | 4.02e-03 | 2.14e-01 | 0.0811 |
| 10526 | IPO8 | LZE7T | Human | Esophagus | ESCC | 1.42e-04 | 2.63e-01 | 0.0667 |
| 10526 | IPO8 | LZE8T | Human | Esophagus | ESCC | 1.85e-08 | 2.79e-01 | 0.067 |
| 10526 | IPO8 | LZE20T | Human | Esophagus | ESCC | 5.75e-04 | 1.60e-01 | 0.0662 |
| 10526 | IPO8 | LZE24T | Human | Esophagus | ESCC | 1.48e-11 | 2.02e-01 | 0.0596 |
| 10526 | IPO8 | P1T-E | Human | Esophagus | ESCC | 2.27e-04 | 2.40e-01 | 0.0875 |
| 10526 | IPO8 | P2T-E | Human | Esophagus | ESCC | 1.09e-20 | 3.84e-01 | 0.1177 |
| 10526 | IPO8 | P4T-E | Human | Esophagus | ESCC | 3.55e-09 | 1.46e-01 | 0.1323 |
| 10526 | IPO8 | P8T-E | Human | Esophagus | ESCC | 9.69e-11 | 1.90e-01 | 0.0889 |
| 10526 | IPO8 | P10T-E | Human | Esophagus | ESCC | 6.46e-12 | 1.70e-01 | 0.116 |
| 10526 | IPO8 | P11T-E | Human | Esophagus | ESCC | 2.93e-02 | 1.85e-01 | 0.1426 |
| 10526 | IPO8 | P12T-E | Human | Esophagus | ESCC | 3.80e-14 | 2.51e-01 | 0.1122 |
| 10526 | IPO8 | P15T-E | Human | Esophagus | ESCC | 2.19e-13 | 2.68e-01 | 0.1149 |
| 10526 | IPO8 | P16T-E | Human | Esophagus | ESCC | 8.29e-22 | 3.74e-01 | 0.1153 |
| 10526 | IPO8 | P17T-E | Human | Esophagus | ESCC | 7.45e-05 | 2.47e-01 | 0.1278 |
| 10526 | IPO8 | P20T-E | Human | Esophagus | ESCC | 5.92e-04 | 8.33e-02 | 0.1124 |
| 10526 | IPO8 | P21T-E | Human | Esophagus | ESCC | 3.47e-11 | 1.74e-01 | 0.1617 |
| 10526 | IPO8 | P22T-E | Human | Esophagus | ESCC | 1.98e-14 | 3.05e-01 | 0.1236 |
| 10526 | IPO8 | P23T-E | Human | Esophagus | ESCC | 1.39e-16 | 3.44e-01 | 0.108 |
| 10526 | IPO8 | P24T-E | Human | Esophagus | ESCC | 1.04e-05 | 2.14e-01 | 0.1287 |
| Page: 1 2 3 4 |
| Tissue | Expression Dynamics | Abbreviation |
| Esophagus |  | ESCC: Esophageal squamous cell carcinoma |
| HGIN: High-grade intraepithelial neoplasias | ||
| LGIN: Low-grade intraepithelial neoplasias | ||
| Liver | 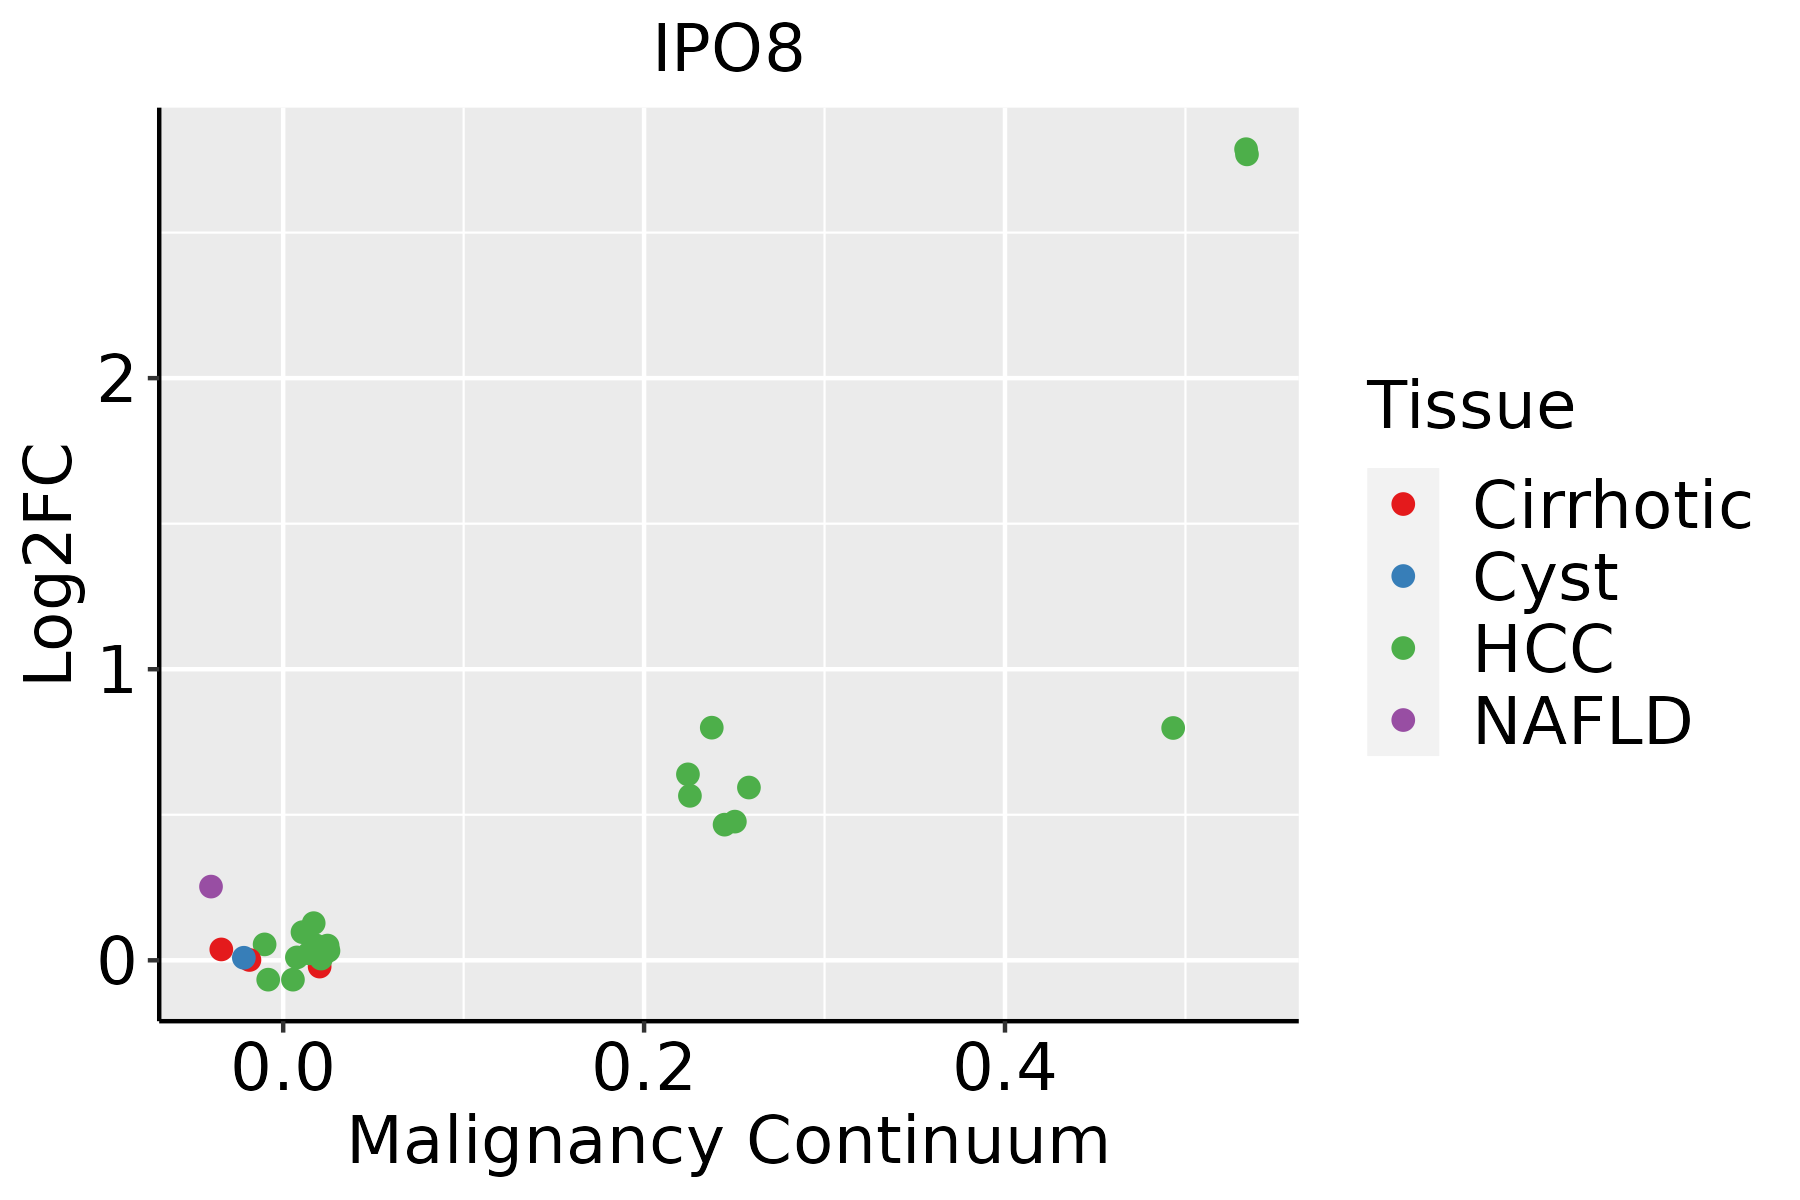 | HCC: Hepatocellular carcinoma |
| NAFLD: Non-alcoholic fatty liver disease | ||
| Prostate | 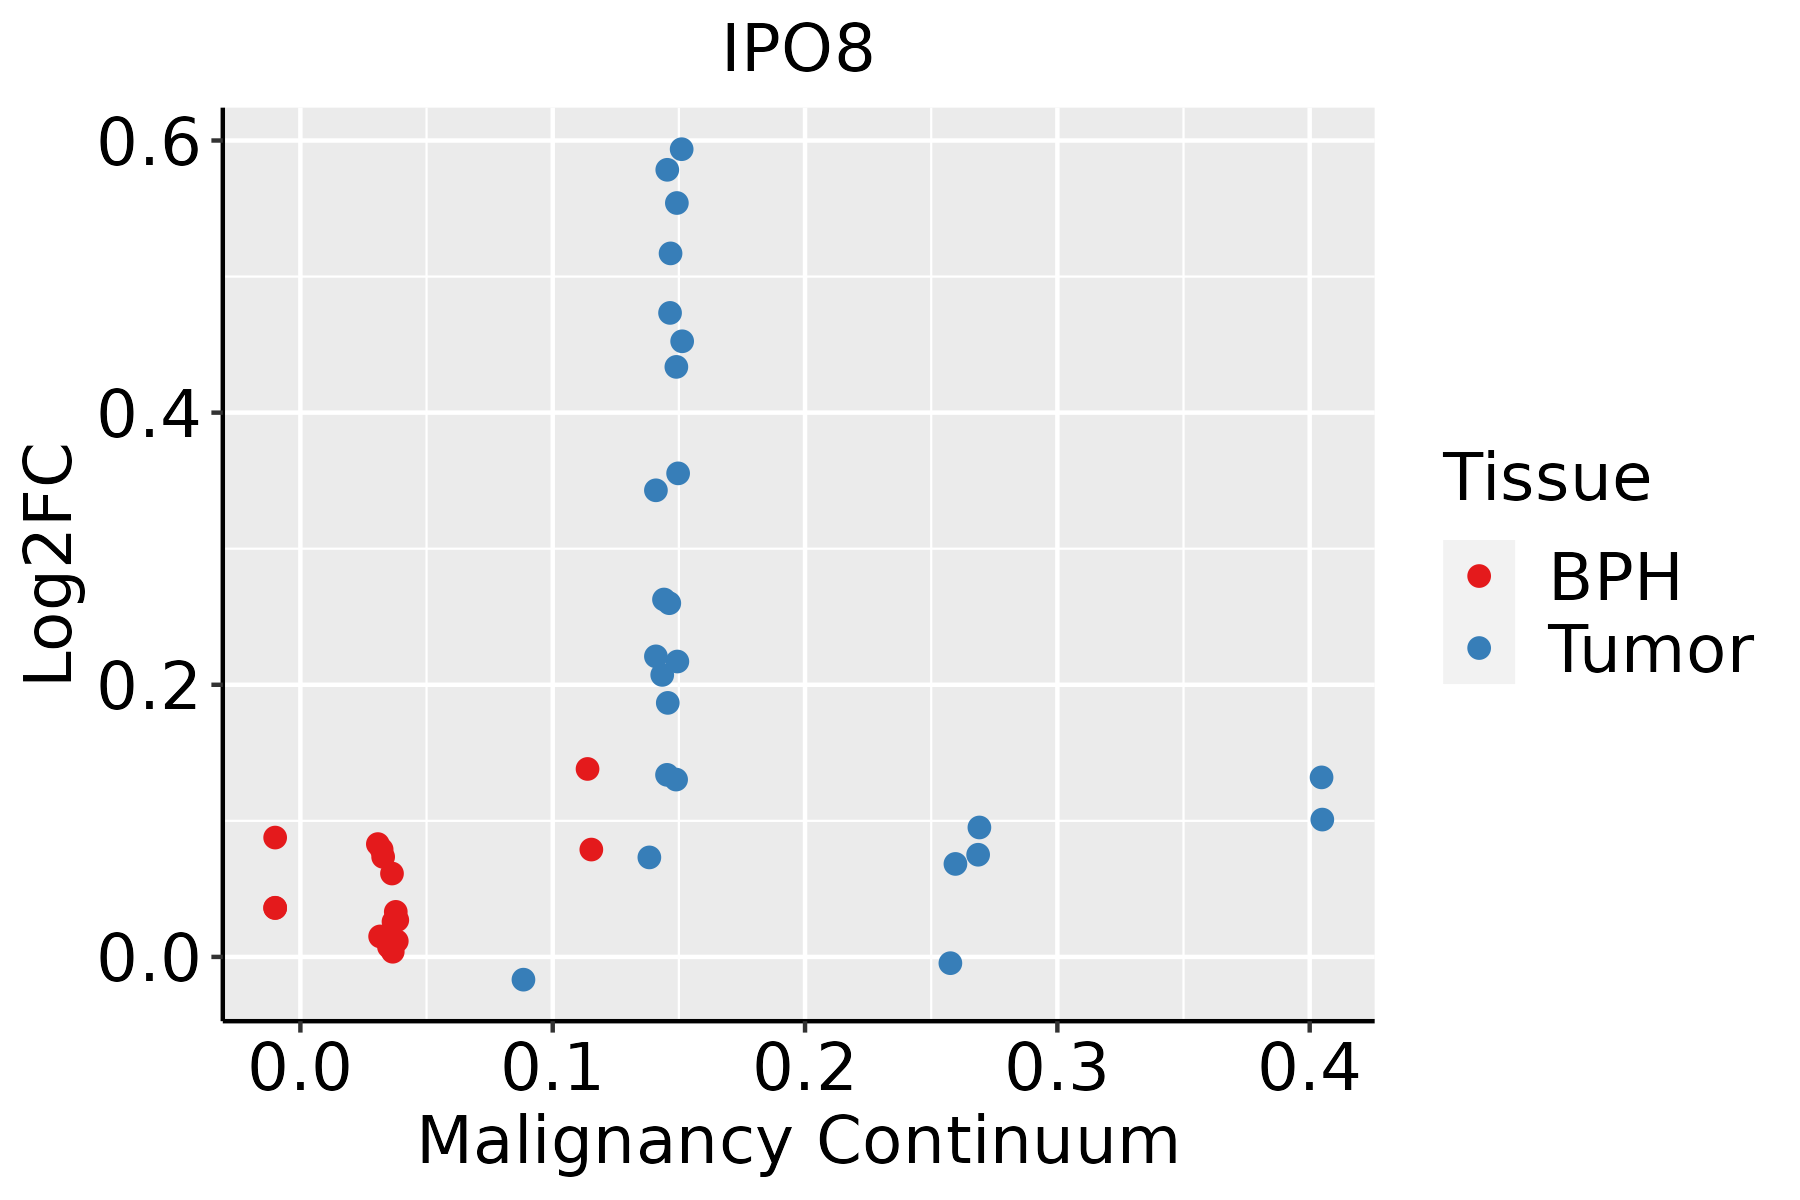 | BPH: Benign Prostatic Hyperplasia |
| ∗log2FC in expression of this searched gene in stem-like cells from each diseased tissue sample relative to stem-like cells in normal samples in each tissue plotted against the malignancy continuum. Samples are colored based on if they are from different disease stage. |
Top |
Malignant transformation related pathway analysis |
| Find out the enriched GO biological processes and KEGG pathways involved in transition from healthy to precancer to cancer |
| Tissue | Disease Stage | Enriched GO biological Processes |
| Colorectum | AD |  |
| Colorectum | SER |  |
| Colorectum | MSS |  |
| Colorectum | MSI-H |  |
| Colorectum | FAP |  |
| ∗Top 15 enriched GO BP terms are showed in the bar plot of each disease state in each tissue. Each row represents a significant GO biological process which is colored according to the -log10(p.adjust). |
| Page: 1 2 3 4 5 6 7 8 9 |
| GO ID | Tissue | Disease Stage | Description | Gene Ratio | Bg Ratio | pvalue | p.adjust | Count |
| GO:0072594110 | Esophagus | ESCC | establishment of protein localization to organelle | 311/8552 | 422/18723 | 3.02e-32 | 2.13e-29 | 311 |
| GO:0006913110 | Esophagus | ESCC | nucleocytoplasmic transport | 230/8552 | 301/18723 | 6.04e-28 | 2.02e-25 | 230 |
| GO:0051169110 | Esophagus | ESCC | nuclear transport | 230/8552 | 301/18723 | 6.04e-28 | 2.02e-25 | 230 |
| GO:003450418 | Esophagus | ESCC | protein localization to nucleus | 211/8552 | 290/18723 | 4.06e-21 | 6.60e-19 | 211 |
| GO:001703818 | Esophagus | ESCC | protein import | 149/8552 | 206/18723 | 5.90e-15 | 3.31e-13 | 149 |
| GO:005117014 | Esophagus | ESCC | import into nucleus | 111/8552 | 159/18723 | 5.69e-10 | 1.44e-08 | 111 |
| GO:000660613 | Esophagus | ESCC | protein import into nucleus | 108/8552 | 155/18723 | 1.16e-09 | 2.77e-08 | 108 |
| GO:007259422 | Liver | HCC | establishment of protein localization to organelle | 299/7958 | 422/18723 | 1.06e-32 | 6.10e-30 | 299 |
| GO:000691322 | Liver | HCC | nucleocytoplasmic transport | 208/7958 | 301/18723 | 5.51e-21 | 8.12e-19 | 208 |
| GO:005116922 | Liver | HCC | nuclear transport | 208/7958 | 301/18723 | 5.51e-21 | 8.12e-19 | 208 |
| GO:003450421 | Liver | HCC | protein localization to nucleus | 194/7958 | 290/18723 | 2.84e-17 | 2.85e-15 | 194 |
| GO:001703811 | Liver | HCC | protein import | 140/7958 | 206/18723 | 1.12e-13 | 6.46e-12 | 140 |
| GO:005117011 | Liver | HCC | import into nucleus | 102/7958 | 159/18723 | 2.78e-08 | 6.39e-07 | 102 |
| GO:00066066 | Liver | HCC | protein import into nucleus | 99/7958 | 155/18723 | 6.12e-08 | 1.28e-06 | 99 |
| GO:007259417 | Prostate | Tumor | establishment of protein localization to organelle | 151/3246 | 422/18723 | 3.19e-20 | 2.83e-17 | 151 |
| GO:003450414 | Prostate | Tumor | protein localization to nucleus | 100/3246 | 290/18723 | 1.05e-12 | 9.98e-11 | 100 |
| GO:000691316 | Prostate | Tumor | nucleocytoplasmic transport | 97/3246 | 301/18723 | 1.78e-10 | 1.05e-08 | 97 |
| GO:005116916 | Prostate | Tumor | nuclear transport | 97/3246 | 301/18723 | 1.78e-10 | 1.05e-08 | 97 |
| GO:001703814 | Prostate | Tumor | protein import | 66/3246 | 206/18723 | 1.78e-07 | 4.38e-06 | 66 |
| GO:005117012 | Prostate | Tumor | import into nucleus | 51/3246 | 159/18723 | 4.08e-06 | 6.51e-05 | 51 |
| Page: 1 2 |
| Pathway ID | Tissue | Disease Stage | Description | Gene Ratio | Bg Ratio | pvalue | p.adjust | qvalue | Count |
| hsa0301321 | Esophagus | ESCC | Nucleocytoplasmic transport | 89/4205 | 108/8465 | 1.20e-12 | 2.37e-11 | 1.21e-11 | 89 |
| hsa0301331 | Esophagus | ESCC | Nucleocytoplasmic transport | 89/4205 | 108/8465 | 1.20e-12 | 2.37e-11 | 1.21e-11 | 89 |
| hsa03013 | Liver | HCC | Nucleocytoplasmic transport | 81/4020 | 108/8465 | 4.28e-09 | 6.83e-08 | 3.80e-08 | 81 |
| hsa030131 | Liver | HCC | Nucleocytoplasmic transport | 81/4020 | 108/8465 | 4.28e-09 | 6.83e-08 | 3.80e-08 | 81 |
| Page: 1 |
Top |
Cell-cell communication analysis |
| Identification of potential cell-cell interactions between two cell types and their ligand-receptor pairs for different disease states |
| Ligand | Receptor | LRpair | Pathway | Tissue | Disease Stage |
| Page: 1 |
Top |
Single-cell gene regulatory network inference analysis |
| Find out the significant the regulons (TFs) and the target genes of each regulon across cell types for different disease states |
| TF | Cell Type | Tissue | Disease Stage | Target Gene | RSS | Regulon Activity |
| ∗The dot plots of a searched regulon are shown for all cell subpopulations in each disease state of each tissue based on the regulon specific score inferred using pySCENIC and by calculating the average expression. |
| Page: 1 |
Top |
Somatic mutation of malignant transformation related genes |
| Annotation of somatic variants for genes involved in malignant transformation |
| Hugo Symbol | Variant Class | Variant Classification | dbSNP RS | HGVSc | HGVSp | HGVSp Short | SWISSPROT | BIOTYPE | SIFT | PolyPhen | Tumor Sample Barcode | Tissue | Histology | Sex | Age | Stage | Therapy Types | Drugs | Outcome |
| IPO8 | SNV | Missense_Mutation | c.2422C>T | p.His808Tyr | p.H808Y | O15397 | protein_coding | tolerated(0.08) | benign(0.424) | TCGA-5L-AAT1-01 | Breast | breast invasive carcinoma | Female | <65 | III/IV | Hormone Therapy | letrozol | SD | |
| IPO8 | SNV | Missense_Mutation | c.1123N>C | p.Glu375Gln | p.E375Q | O15397 | protein_coding | deleterious(0) | probably_damaging(0.99) | TCGA-A2-A04Y-01 | Breast | breast invasive carcinoma | Female | <65 | I/II | Chemotherapy | cytoxan | SD | |
| IPO8 | SNV | Missense_Mutation | novel | c.670N>A | p.Gln224Lys | p.Q224K | O15397 | protein_coding | tolerated(0.28) | benign(0.038) | TCGA-A2-A4S2-01 | Breast | breast invasive carcinoma | Female | <65 | III/IV | Chemotherapy | adriamycin | CR |
| IPO8 | SNV | Missense_Mutation | c.1439N>C | p.Val480Ala | p.V480A | O15397 | protein_coding | deleterious(0.02) | benign(0.056) | TCGA-A8-A09Z-01 | Breast | breast invasive carcinoma | Female | >=65 | I/II | Unknown | Unknown | SD | |
| IPO8 | SNV | Missense_Mutation | novel | c.609N>C | p.Gln203His | p.Q203H | O15397 | protein_coding | deleterious(0) | probably_damaging(0.984) | TCGA-AN-A046-01 | Breast | breast invasive carcinoma | Female | >=65 | I/II | Unknown | Unknown | SD |
| IPO8 | SNV | Missense_Mutation | c.1786G>C | p.Asp596His | p.D596H | O15397 | protein_coding | deleterious(0.02) | possibly_damaging(0.67) | TCGA-BH-A0EE-01 | Breast | breast invasive carcinoma | Female | >=65 | I/II | Chemotherapy | docetaxel | SD | |
| IPO8 | SNV | Missense_Mutation | c.1636G>A | p.Glu546Lys | p.E546K | O15397 | protein_coding | tolerated(0.06) | benign(0.109) | TCGA-BH-A0EE-01 | Breast | breast invasive carcinoma | Female | >=65 | I/II | Chemotherapy | docetaxel | SD | |
| IPO8 | SNV | Missense_Mutation | c.1209G>C | p.Lys403Asn | p.K403N | O15397 | protein_coding | tolerated(0.07) | benign(0.02) | TCGA-BH-A0EE-01 | Breast | breast invasive carcinoma | Female | >=65 | I/II | Chemotherapy | docetaxel | SD | |
| IPO8 | SNV | Missense_Mutation | rs141041651 | c.1495N>A | p.Val499Ile | p.V499I | O15397 | protein_coding | tolerated(0.27) | benign(0.044) | TCGA-EW-A1OV-01 | Breast | breast invasive carcinoma | Female | <65 | I/II | Chemotherapy | epirubicin | SD |
| IPO8 | insertion | Frame_Shift_Ins | novel | c.1069dupT | p.Ser357PhefsTer6 | p.S357Ffs*6 | O15397 | protein_coding | TCGA-A1-A0SJ-01 | Breast | breast invasive carcinoma | Female | <65 | III/IV | Unknown | Unknown | SD |
| Page: 1 2 3 4 5 6 7 8 9 10 11 12 13 |
Top |
Related drugs of malignant transformation related genes |
| Identification of chemicals and drugs interact with genes involved in malignant transfromation |
| (DGIdb 4.0) |
| Entrez ID | Symbol | Category | Interaction Types | Drug Claim Name | Drug Name | PMIDs |
| 10526 | IPO8 | NA | MKC-1 | ENMD-981693 |
| Page: 1 |

Copyright 2023-Present -The University of Texas Health Science Center at Houston |