
|
|||||
|
 | |
| |
| |
| |
| |
| |
|
Gene: IPO13 |
Gene summary for IPO13 |
| Gene information | Species | Human | Gene symbol | IPO13 | Gene ID | 9670 |
| Gene name | importin 13 | |
| Gene Alias | IMP13 | |
| Cytomap | 1p34.1 | |
| Gene Type | protein-coding | GO ID | GO:0006606 | UniProtAcc | O94829 |
Top |
Malignant transformation analysis |
| Identification of the aberrant gene expression in precancerous and cancerous lesions by comparing the gene expression of stem-like cells in diseased tissues with normal stem cells |
| Entrez ID | Symbol | Replicates | Species | Organ | Tissue | Adj P-value | Log2FC | Malignancy |
| 9670 | IPO13 | HCC1_Meng | Human | Liver | HCC | 5.58e-17 | 2.80e-02 | 0.0246 |
| 9670 | IPO13 | HCC2 | Human | Liver | HCC | 2.62e-08 | 2.11e+00 | 0.5341 |
| 9670 | IPO13 | S014 | Human | Liver | HCC | 8.28e-13 | 4.71e-01 | 0.2254 |
| 9670 | IPO13 | S015 | Human | Liver | HCC | 1.73e-12 | 4.61e-01 | 0.2375 |
| 9670 | IPO13 | S016 | Human | Liver | HCC | 2.40e-19 | 4.67e-01 | 0.2243 |
| 9670 | IPO13 | S027 | Human | Liver | HCC | 1.26e-08 | 5.78e-01 | 0.2446 |
| 9670 | IPO13 | S028 | Human | Liver | HCC | 1.03e-17 | 5.57e-01 | 0.2503 |
| 9670 | IPO13 | S029 | Human | Liver | HCC | 8.46e-18 | 5.71e-01 | 0.2581 |
| 9670 | IPO13 | C04 | Human | Oral cavity | OSCC | 2.92e-09 | 4.35e-01 | 0.2633 |
| 9670 | IPO13 | C21 | Human | Oral cavity | OSCC | 2.19e-09 | 4.14e-01 | 0.2678 |
| 9670 | IPO13 | C30 | Human | Oral cavity | OSCC | 1.08e-13 | 6.33e-01 | 0.3055 |
| 9670 | IPO13 | C38 | Human | Oral cavity | OSCC | 9.23e-03 | 3.22e-01 | 0.172 |
| 9670 | IPO13 | C43 | Human | Oral cavity | OSCC | 1.01e-08 | 1.26e-01 | 0.1704 |
| 9670 | IPO13 | C46 | Human | Oral cavity | OSCC | 9.55e-06 | 1.70e-01 | 0.1673 |
| 9670 | IPO13 | C51 | Human | Oral cavity | OSCC | 3.58e-06 | 4.00e-01 | 0.2674 |
| 9670 | IPO13 | C06 | Human | Oral cavity | OSCC | 1.79e-02 | 6.40e-01 | 0.2699 |
| 9670 | IPO13 | LN46 | Human | Oral cavity | OSCC | 4.92e-02 | 1.33e-01 | 0.1666 |
| 9670 | IPO13 | SYSMH1 | Human | Oral cavity | OSCC | 4.59e-05 | 1.50e-01 | 0.1127 |
| 9670 | IPO13 | SYSMH2 | Human | Oral cavity | OSCC | 4.39e-05 | 1.37e-01 | 0.2326 |
| 9670 | IPO13 | SYSMH3 | Human | Oral cavity | OSCC | 5.25e-17 | 3.42e-01 | 0.2442 |
| Page: 1 2 |
| Tissue | Expression Dynamics | Abbreviation |
| Liver |  | HCC: Hepatocellular carcinoma |
| NAFLD: Non-alcoholic fatty liver disease | ||
| Oral Cavity | 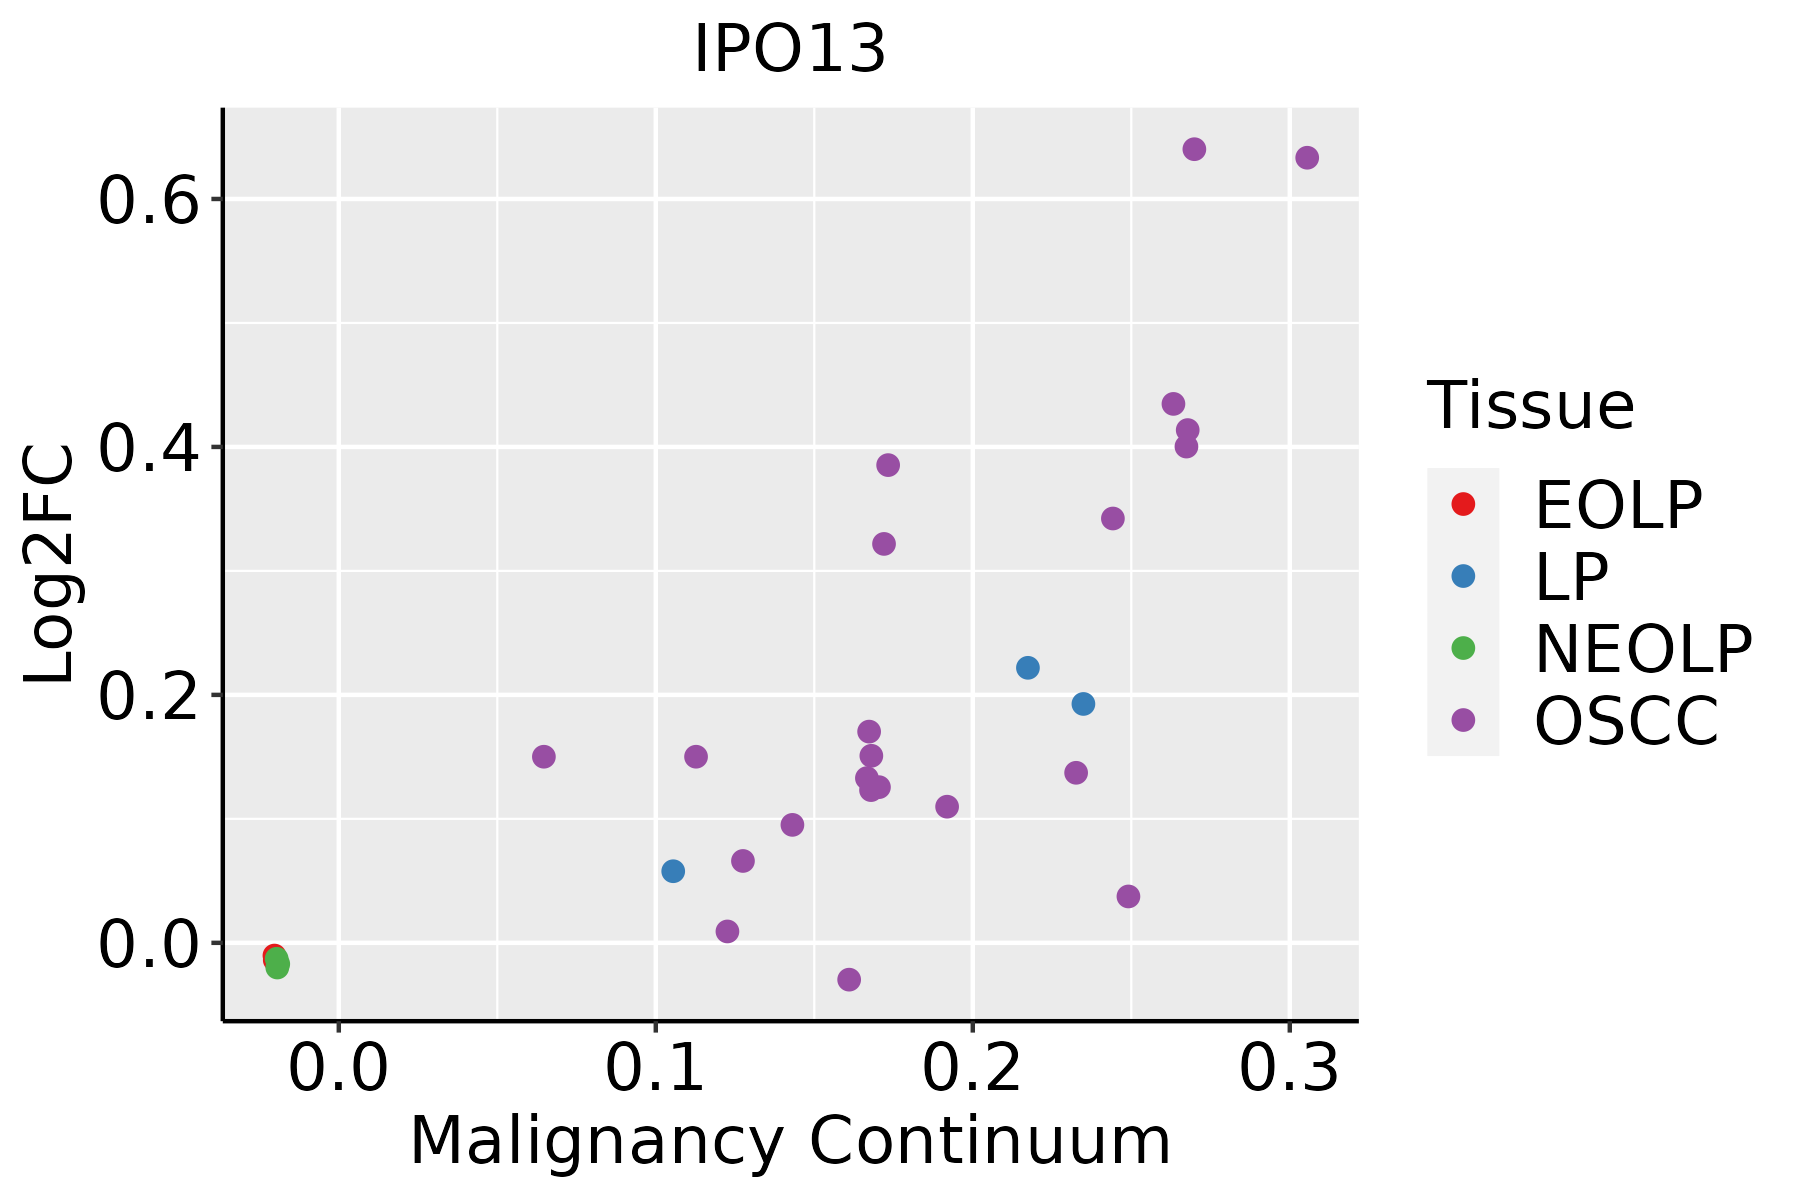 | EOLP: Erosive Oral lichen planus |
| LP: leukoplakia | ||
| NEOLP: Non-erosive oral lichen planus | ||
| OSCC: Oral squamous cell carcinoma |
| ∗log2FC in expression of this searched gene in stem-like cells from each diseased tissue sample relative to stem-like cells in normal samples in each tissue plotted against the malignancy continuum. Samples are colored based on if they are from different disease stage. |
Top |
Malignant transformation related pathway analysis |
| Find out the enriched GO biological processes and KEGG pathways involved in transition from healthy to precancer to cancer |
| Tissue | Disease Stage | Enriched GO biological Processes |
| Colorectum | AD |  |
| Colorectum | SER |  |
| Colorectum | MSS |  |
| Colorectum | MSI-H |  |
| Colorectum | FAP |  |
| ∗Top 15 enriched GO BP terms are showed in the bar plot of each disease state in each tissue. Each row represents a significant GO biological process which is colored according to the -log10(p.adjust). |
| Page: 1 2 3 4 5 6 7 8 9 |
| GO ID | Tissue | Disease Stage | Description | Gene Ratio | Bg Ratio | pvalue | p.adjust | Count |
| GO:007259422 | Liver | HCC | establishment of protein localization to organelle | 299/7958 | 422/18723 | 1.06e-32 | 6.10e-30 | 299 |
| GO:000691322 | Liver | HCC | nucleocytoplasmic transport | 208/7958 | 301/18723 | 5.51e-21 | 8.12e-19 | 208 |
| GO:005116922 | Liver | HCC | nuclear transport | 208/7958 | 301/18723 | 5.51e-21 | 8.12e-19 | 208 |
| GO:003450421 | Liver | HCC | protein localization to nucleus | 194/7958 | 290/18723 | 2.84e-17 | 2.85e-15 | 194 |
| GO:001703811 | Liver | HCC | protein import | 140/7958 | 206/18723 | 1.12e-13 | 6.46e-12 | 140 |
| GO:005117011 | Liver | HCC | import into nucleus | 102/7958 | 159/18723 | 2.78e-08 | 6.39e-07 | 102 |
| GO:00066066 | Liver | HCC | protein import into nucleus | 99/7958 | 155/18723 | 6.12e-08 | 1.28e-06 | 99 |
| GO:007259418 | Oral cavity | OSCC | establishment of protein localization to organelle | 284/7305 | 422/18723 | 1.50e-32 | 1.35e-29 | 284 |
| GO:000691317 | Oral cavity | OSCC | nucleocytoplasmic transport | 204/7305 | 301/18723 | 2.65e-24 | 6.98e-22 | 204 |
| GO:005116917 | Oral cavity | OSCC | nuclear transport | 204/7305 | 301/18723 | 2.65e-24 | 6.98e-22 | 204 |
| GO:003450415 | Oral cavity | OSCC | protein localization to nucleus | 193/7305 | 290/18723 | 1.22e-21 | 2.35e-19 | 193 |
| GO:001703815 | Oral cavity | OSCC | protein import | 136/7305 | 206/18723 | 3.15e-15 | 2.08e-13 | 136 |
| GO:00511709 | Oral cavity | OSCC | import into nucleus | 100/7305 | 159/18723 | 8.67e-10 | 2.15e-08 | 100 |
| GO:00066069 | Oral cavity | OSCC | protein import into nucleus | 97/7305 | 155/18723 | 2.27e-09 | 5.30e-08 | 97 |
| Page: 1 |
| Pathway ID | Tissue | Disease Stage | Description | Gene Ratio | Bg Ratio | pvalue | p.adjust | qvalue | Count |
| hsa03013 | Liver | HCC | Nucleocytoplasmic transport | 81/4020 | 108/8465 | 4.28e-09 | 6.83e-08 | 3.80e-08 | 81 |
| hsa030131 | Liver | HCC | Nucleocytoplasmic transport | 81/4020 | 108/8465 | 4.28e-09 | 6.83e-08 | 3.80e-08 | 81 |
| hsa030136 | Oral cavity | OSCC | Nucleocytoplasmic transport | 82/3704 | 108/8465 | 7.93e-12 | 1.33e-10 | 6.77e-11 | 82 |
| hsa0301311 | Oral cavity | OSCC | Nucleocytoplasmic transport | 82/3704 | 108/8465 | 7.93e-12 | 1.33e-10 | 6.77e-11 | 82 |
| Page: 1 |
Top |
Cell-cell communication analysis |
| Identification of potential cell-cell interactions between two cell types and their ligand-receptor pairs for different disease states |
| Ligand | Receptor | LRpair | Pathway | Tissue | Disease Stage |
| Page: 1 |
Top |
Single-cell gene regulatory network inference analysis |
| Find out the significant the regulons (TFs) and the target genes of each regulon across cell types for different disease states |
| TF | Cell Type | Tissue | Disease Stage | Target Gene | RSS | Regulon Activity |
| ∗The dot plots of a searched regulon are shown for all cell subpopulations in each disease state of each tissue based on the regulon specific score inferred using pySCENIC and by calculating the average expression. |
| Page: 1 |
Top |
Somatic mutation of malignant transformation related genes |
| Annotation of somatic variants for genes involved in malignant transformation |
| Hugo Symbol | Variant Class | Variant Classification | dbSNP RS | HGVSc | HGVSp | HGVSp Short | SWISSPROT | BIOTYPE | SIFT | PolyPhen | Tumor Sample Barcode | Tissue | Histology | Sex | Age | Stage | Therapy Types | Drugs | Outcome |
| IPO13 | SNV | Missense_Mutation | c.1939N>G | p.Leu647Val | p.L647V | O94829 | protein_coding | deleterious(0.02) | probably_damaging(0.992) | TCGA-A8-A0AB-01 | Breast | breast invasive carcinoma | Female | <65 | I/II | Chemotherapy | 5-fluorouracil | CR | |
| IPO13 | SNV | Missense_Mutation | c.41G>A | p.Gly14Glu | p.G14E | O94829 | protein_coding | tolerated_low_confidence(0.11) | benign(0) | TCGA-AC-A23H-01 | Breast | breast invasive carcinoma | Female | >=65 | I/II | Unknown | Unknown | PD | |
| IPO13 | SNV | Missense_Mutation | c.660G>C | p.Gln220His | p.Q220H | O94829 | protein_coding | tolerated(0.23) | possibly_damaging(0.571) | TCGA-AC-A23H-01 | Breast | breast invasive carcinoma | Female | >=65 | I/II | Unknown | Unknown | PD | |
| IPO13 | SNV | Missense_Mutation | novel | c.14N>G | p.Glu5Gly | p.E5G | O94829 | protein_coding | tolerated_low_confidence(0.13) | benign(0.05) | TCGA-BH-A202-01 | Breast | breast invasive carcinoma | Female | <65 | I/II | Chemotherapy | carboplatin | CR |
| IPO13 | SNV | Missense_Mutation | c.398G>A | p.Ser133Asn | p.S133N | O94829 | protein_coding | tolerated(1) | benign(0) | TCGA-D8-A1XQ-01 | Breast | breast invasive carcinoma | Female | >=65 | I/II | Unknown | Unknown | SD | |
| IPO13 | SNV | Missense_Mutation | c.2137N>T | p.Val713Phe | p.V713F | O94829 | protein_coding | deleterious(0.02) | benign(0.22) | TCGA-E2-A15K-06 | Breast | breast invasive carcinoma | Female | <65 | I/II | Chemotherapy | adriamycin | SD | |
| IPO13 | deletion | Frame_Shift_Del | novel | c.516delG | p.Leu173CysfsTer92 | p.L173Cfs*92 | O94829 | protein_coding | TCGA-D8-A27V-01 | Breast | breast invasive carcinoma | Female | <65 | I/II | Hormone Therapy | tamoxiphen | SD | ||
| IPO13 | SNV | Missense_Mutation | c.1999N>C | p.Lys667Gln | p.K667Q | O94829 | protein_coding | tolerated(0.35) | benign(0.003) | TCGA-DR-A0ZM-01 | Cervix | cervical & endocervical cancer | Female | <65 | III/IV | Unspecific | Cisplatin | SD | |
| IPO13 | SNV | Missense_Mutation | c.1760G>T | p.Cys587Phe | p.C587F | O94829 | protein_coding | tolerated(0.05) | possibly_damaging(0.795) | TCGA-EA-A5O9-01 | Cervix | cervical & endocervical cancer | Female | <65 | I/II | Unknown | Unknown | SD | |
| IPO13 | SNV | Missense_Mutation | c.2761N>C | p.Glu921Gln | p.E921Q | O94829 | protein_coding | tolerated(0.13) | benign(0.04) | TCGA-JW-A5VJ-01 | Cervix | cervical & endocervical cancer | Female | <65 | I/II | Unknown | Unknown | PD |
| Page: 1 2 3 4 5 6 7 8 9 |
Top |
Related drugs of malignant transformation related genes |
| Identification of chemicals and drugs interact with genes involved in malignant transfromation |
| (DGIdb 4.0) |
| Entrez ID | Symbol | Category | Interaction Types | Drug Claim Name | Drug Name | PMIDs |
| 9670 | IPO13 | NA | MKC-1 | ENMD-981693 |
| Page: 1 |

Copyright 2023-Present -The University of Texas Health Science Center at Houston |