
|
|||||
|
 | |
| |
| |
| |
| |
| |
|
Gene: IPCEF1 |
Gene summary for IPCEF1 |
| Gene information | Species | Human | Gene symbol | IPCEF1 | Gene ID | 26034 |
| Gene name | interaction protein for cytohesin exchange factors 1 | |
| Gene Alias | PIP3-E | |
| Cytomap | 6q25.2 | |
| Gene Type | protein-coding | GO ID | GO:0006810 | UniProtAcc | Q8WWN9 |
Top |
Malignant transformation analysis |
| Identification of the aberrant gene expression in precancerous and cancerous lesions by comparing the gene expression of stem-like cells in diseased tissues with normal stem cells |
| Entrez ID | Symbol | Replicates | Species | Organ | Tissue | Adj P-value | Log2FC | Malignancy |
| 26034 | IPCEF1 | RNA-P3T-P3T-4 | Human | Lung | IAC | 1.67e-02 | 2.86e-01 | 0.1859 |
| 26034 | IPCEF1 | RNA-P6T2-P6T2-1 | Human | Lung | IAC | 1.57e-19 | 6.42e-01 | -0.0166 |
| 26034 | IPCEF1 | RNA-P6T2-P6T2-2 | Human | Lung | IAC | 3.46e-17 | 5.60e-01 | -0.0132 |
| 26034 | IPCEF1 | RNA-P6T2-P6T2-3 | Human | Lung | IAC | 2.03e-21 | 6.45e-01 | -0.013 |
| 26034 | IPCEF1 | RNA-P6T2-P6T2-4 | Human | Lung | IAC | 5.08e-19 | 6.15e-01 | -0.0121 |
| 26034 | IPCEF1 | RNA-P7T1-P7T1-1 | Human | Lung | AIS | 1.98e-07 | 8.24e-01 | -0.0961 |
| 26034 | IPCEF1 | RNA-P7T1-P7T1-2 | Human | Lung | AIS | 8.10e-12 | 9.54e-01 | -0.0876 |
| 26034 | IPCEF1 | RNA-P7T1-P7T1-3 | Human | Lung | AIS | 7.13e-10 | 9.49e-01 | -0.0822 |
| 26034 | IPCEF1 | RNA-P7T1-P7T1-4 | Human | Lung | AIS | 6.36e-10 | 8.72e-01 | -0.0809 |
| 26034 | IPCEF1 | PTCwithHT_6 | Human | Thyroid | HT | 1.15e-03 | -2.88e-01 | 0.02 |
| 26034 | IPCEF1 | male-WTA | Human | Thyroid | PTC | 1.84e-02 | -1.54e-01 | 0.1037 |
| 26034 | IPCEF1 | PTC06 | Human | Thyroid | PTC | 2.99e-03 | -2.34e-01 | 0.2057 |
| 26034 | IPCEF1 | PTC07 | Human | Thyroid | PTC | 6.08e-07 | -2.07e-01 | 0.2044 |
| 26034 | IPCEF1 | ATC13 | Human | Thyroid | ATC | 1.09e-02 | -2.84e-01 | 0.34 |
| 26034 | IPCEF1 | ATC4 | Human | Thyroid | ATC | 2.36e-04 | -2.91e-01 | 0.34 |
| 26034 | IPCEF1 | ATC5 | Human | Thyroid | ATC | 4.15e-03 | -2.83e-01 | 0.34 |
| Page: 1 |
| Tissue | Expression Dynamics | Abbreviation |
| Lung | 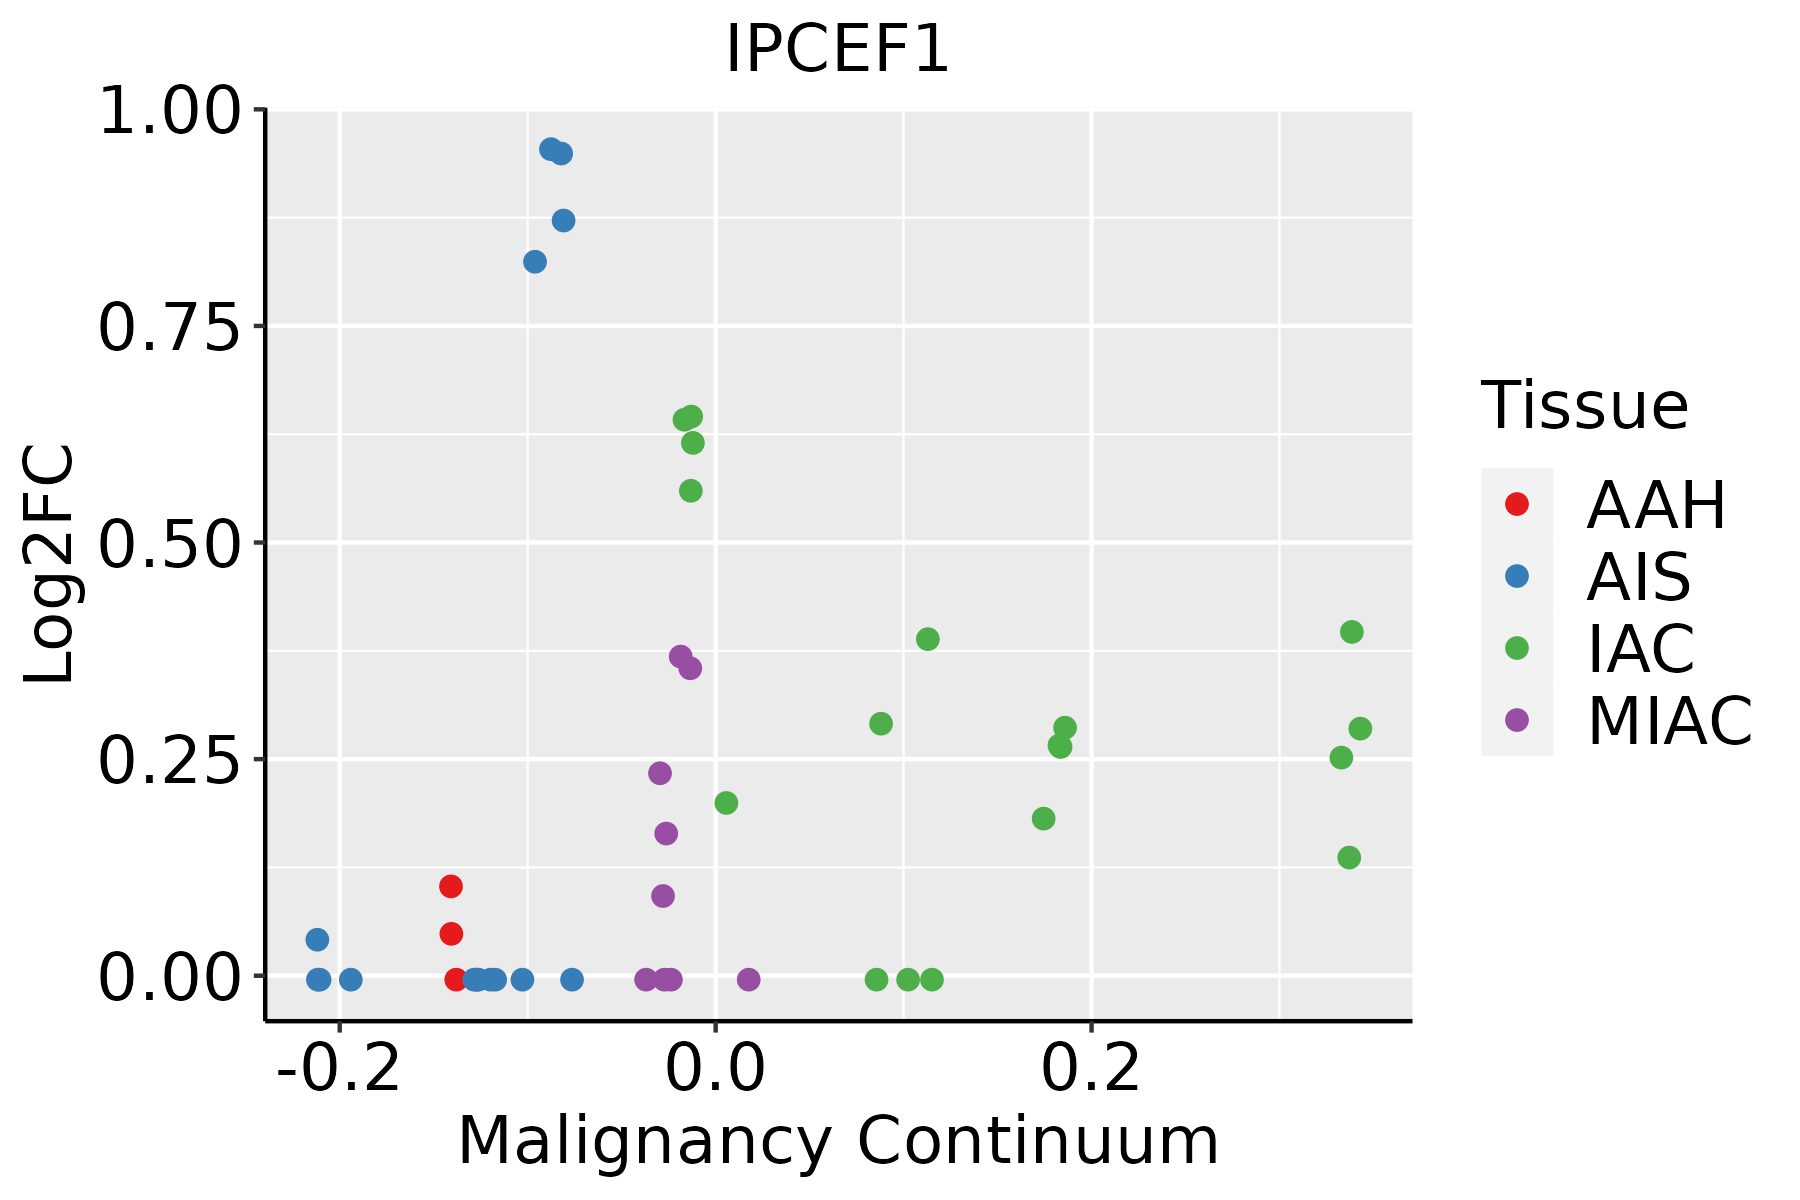 | AAH: Atypical adenomatous hyperplasia |
| AIS: Adenocarcinoma in situ | ||
| IAC: Invasive lung adenocarcinoma | ||
| MIA: Minimally invasive adenocarcinoma | ||
| Thyroid | 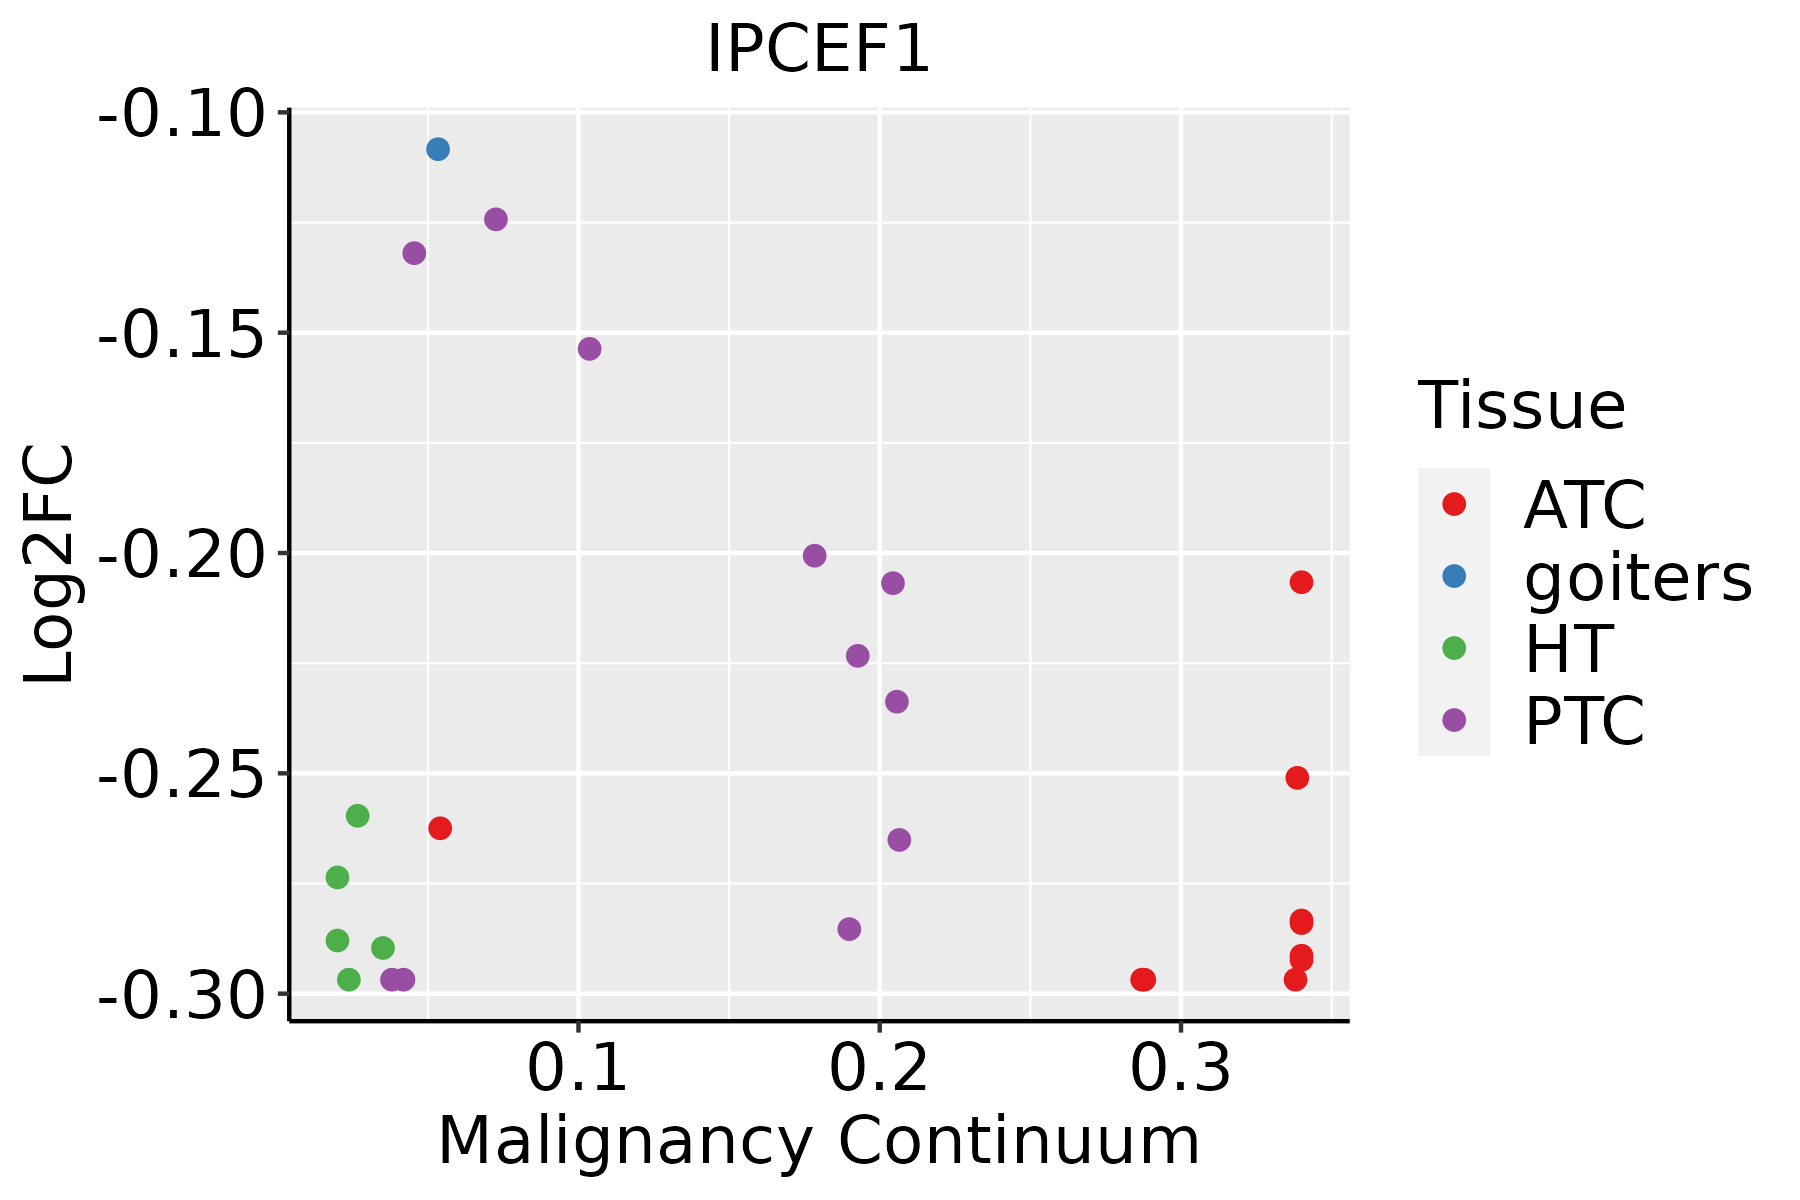 | ATC: Anaplastic thyroid cancer |
| HT: Hashimoto's thyroiditis | ||
| PTC: Papillary thyroid cancer |
| ∗log2FC in expression of this searched gene in stem-like cells from each diseased tissue sample relative to stem-like cells in normal samples in each tissue plotted against the malignancy continuum. Samples are colored based on if they are from different disease stage. |
Top |
Malignant transformation related pathway analysis |
| Find out the enriched GO biological processes and KEGG pathways involved in transition from healthy to precancer to cancer |
| Tissue | Disease Stage | Enriched GO biological Processes |
| Colorectum | AD |  |
| Colorectum | SER |  |
| Colorectum | MSS |  |
| Colorectum | MSI-H |  |
| Colorectum | FAP |  |
| ∗Top 15 enriched GO BP terms are showed in the bar plot of each disease state in each tissue. Each row represents a significant GO biological process which is colored according to the -log10(p.adjust). |
| Page: 1 2 3 4 5 6 7 8 9 |
| GO ID | Tissue | Disease Stage | Description | Gene Ratio | Bg Ratio | pvalue | p.adjust | Count |
| GO:00069798 | Lung | IAC | response to oxidative stress | 82/2061 | 446/18723 | 1.99e-06 | 9.18e-05 | 82 |
| GO:000697913 | Lung | AIS | response to oxidative stress | 75/1849 | 446/18723 | 2.97e-06 | 1.60e-04 | 75 |
| GO:000697930 | Thyroid | HT | response to oxidative stress | 81/1272 | 446/18723 | 2.53e-16 | 1.17e-13 | 81 |
| GO:000963627 | Thyroid | HT | response to toxic substance | 50/1272 | 262/18723 | 2.25e-11 | 3.75e-09 | 50 |
| GO:199074827 | Thyroid | HT | cellular detoxification | 31/1272 | 116/18723 | 2.29e-11 | 3.75e-09 | 31 |
| GO:009875420 | Thyroid | HT | detoxification | 36/1272 | 152/18723 | 2.63e-11 | 4.07e-09 | 36 |
| GO:009723727 | Thyroid | HT | cellular response to toxic substance | 32/1272 | 124/18723 | 3.00e-11 | 4.51e-09 | 32 |
| GO:009886926 | Thyroid | HT | cellular oxidant detoxification | 26/1272 | 101/18723 | 2.23e-09 | 2.26e-07 | 26 |
| GO:0006979113 | Thyroid | PTC | response to oxidative stress | 234/5968 | 446/18723 | 6.97e-20 | 9.77e-18 | 234 |
| GO:0009636111 | Thyroid | PTC | response to toxic substance | 115/5968 | 262/18723 | 2.70e-05 | 2.63e-04 | 115 |
| GO:1990748112 | Thyroid | PTC | cellular detoxification | 56/5968 | 116/18723 | 1.63e-04 | 1.26e-03 | 56 |
| GO:0097237112 | Thyroid | PTC | cellular response to toxic substance | 59/5968 | 124/18723 | 1.83e-04 | 1.39e-03 | 59 |
| GO:0098869111 | Thyroid | PTC | cellular oxidant detoxification | 49/5968 | 101/18723 | 3.52e-04 | 2.41e-03 | 49 |
| GO:0098754110 | Thyroid | PTC | detoxification | 63/5968 | 152/18723 | 7.92e-03 | 3.34e-02 | 63 |
| GO:000697934 | Thyroid | ATC | response to oxidative stress | 246/6293 | 446/18723 | 2.98e-21 | 6.09e-19 | 246 |
| GO:000963634 | Thyroid | ATC | response to toxic substance | 119/6293 | 262/18723 | 4.30e-05 | 3.48e-04 | 119 |
| GO:199074833 | Thyroid | ATC | cellular detoxification | 58/6293 | 116/18723 | 1.88e-04 | 1.26e-03 | 58 |
| GO:009723733 | Thyroid | ATC | cellular response to toxic substance | 61/6293 | 124/18723 | 2.31e-04 | 1.49e-03 | 61 |
| GO:009886932 | Thyroid | ATC | cellular oxidant detoxification | 51/6293 | 101/18723 | 3.29e-04 | 2.05e-03 | 51 |
| GO:009875433 | Thyroid | ATC | detoxification | 66/6293 | 152/18723 | 7.23e-03 | 2.85e-02 | 66 |
| Page: 1 |
| Pathway ID | Tissue | Disease Stage | Description | Gene Ratio | Bg Ratio | pvalue | p.adjust | qvalue | Count |
| Page: 1 |
Top |
Cell-cell communication analysis |
| Identification of potential cell-cell interactions between two cell types and their ligand-receptor pairs for different disease states |
| Ligand | Receptor | LRpair | Pathway | Tissue | Disease Stage |
| Page: 1 |
Top |
Single-cell gene regulatory network inference analysis |
| Find out the significant the regulons (TFs) and the target genes of each regulon across cell types for different disease states |
| TF | Cell Type | Tissue | Disease Stage | Target Gene | RSS | Regulon Activity |
| ∗The dot plots of a searched regulon are shown for all cell subpopulations in each disease state of each tissue based on the regulon specific score inferred using pySCENIC and by calculating the average expression. |
| Page: 1 |
Top |
Somatic mutation of malignant transformation related genes |
| Annotation of somatic variants for genes involved in malignant transformation |
| Hugo Symbol | Variant Class | Variant Classification | dbSNP RS | HGVSc | HGVSp | HGVSp Short | SWISSPROT | BIOTYPE | SIFT | PolyPhen | Tumor Sample Barcode | Tissue | Histology | Sex | Age | Stage | Therapy Types | Drugs | Outcome |
| IPCEF1 | SNV | Missense_Mutation | novel | c.1028N>A | p.Ser343Tyr | p.S343Y | Q8WWN9 | protein_coding | deleterious(0) | probably_damaging(0.999) | TCGA-A8-A08H-01 | Breast | breast invasive carcinoma | Female | >=65 | I/II | Unknown | Unknown | SD |
| IPCEF1 | SNV | Missense_Mutation | c.1128N>C | p.Met376Ile | p.M376I | Q8WWN9 | protein_coding | tolerated(0.71) | benign(0.19) | TCGA-BH-A0AY-01 | Breast | breast invasive carcinoma | Female | <65 | I/II | Chemotherapy | SD | ||
| IPCEF1 | SNV | Missense_Mutation | c.959N>T | p.Ser320Leu | p.S320L | Q8WWN9 | protein_coding | deleterious(0.01) | probably_damaging(0.973) | TCGA-BH-A1FC-01 | Breast | breast invasive carcinoma | Female | >=65 | I/II | Unknown | Unknown | SD | |
| IPCEF1 | SNV | Missense_Mutation | novel | c.1020N>C | p.Leu340Phe | p.L340F | Q8WWN9 | protein_coding | tolerated(0.63) | possibly_damaging(0.526) | TCGA-C5-A8YQ-01 | Cervix | cervical & endocervical cancer | Female | >=65 | I/II | Chemotherapy | cisplatin | PD |
| IPCEF1 | SNV | Missense_Mutation | rs765725199 | c.268N>T | p.Val90Phe | p.V90F | Q8WWN9 | protein_coding | deleterious(0) | possibly_damaging(0.848) | TCGA-A6-6650-01 | Colorectum | colon adenocarcinoma | Female | >=65 | I/II | Unknown | Unknown | SD |
| IPCEF1 | SNV | Missense_Mutation | rs574240330 | c.218N>T | p.Ser73Leu | p.S73L | Q8WWN9 | protein_coding | deleterious(0) | possibly_damaging(0.651) | TCGA-AA-3984-01 | Colorectum | colon adenocarcinoma | Female | <65 | I/II | Unknown | Unknown | SD |
| IPCEF1 | SNV | Missense_Mutation | c.203N>C | p.Val68Ala | p.V68A | Q8WWN9 | protein_coding | tolerated(0.16) | possibly_damaging(0.597) | TCGA-AD-A5EJ-01 | Colorectum | colon adenocarcinoma | Female | >=65 | I/II | Unknown | Unknown | SD | |
| IPCEF1 | SNV | Missense_Mutation | rs368673715 | c.413N>T | p.Ser138Leu | p.S138L | Q8WWN9 | protein_coding | tolerated(1) | benign(0) | TCGA-AY-6197-01 | Colorectum | colon adenocarcinoma | Male | <65 | I/II | Unknown | Unknown | SD |
| IPCEF1 | SNV | Missense_Mutation | novel | c.676N>A | p.Val226Ile | p.V226I | Q8WWN9 | protein_coding | tolerated(0.17) | benign(0.037) | TCGA-AZ-4315-01 | Colorectum | colon adenocarcinoma | Male | <65 | I/II | Unknown | Unknown | SD |
| IPCEF1 | SNV | Missense_Mutation | novel | c.256N>A | p.Ala86Thr | p.A86T | Q8WWN9 | protein_coding | deleterious(0.02) | probably_damaging(1) | TCGA-CA-6717-01 | Colorectum | colon adenocarcinoma | Male | <65 | I/II | Chemotherapy | oxaliplatin | CR |
| Page: 1 2 3 4 5 |
Top |
Related drugs of malignant transformation related genes |
| Identification of chemicals and drugs interact with genes involved in malignant transfromation |
| (DGIdb 4.0) |
| Entrez ID | Symbol | Category | Interaction Types | Drug Claim Name | Drug Name | PMIDs |
| Page: 1 |

Copyright 2023-Present -The University of Texas Health Science Center at Houston |