
|
|||||
|
 | |
| |
| |
| |
| |
| |
|
Gene: IP6K1 |
Gene summary for IP6K1 |
| Gene information | Species | Human | Gene symbol | IP6K1 | Gene ID | 9807 |
| Gene name | inositol hexakisphosphate kinase 1 | |
| Gene Alias | IHPK1 | |
| Cytomap | 3p21.31 | |
| Gene Type | protein-coding | GO ID | GO:0001659 | UniProtAcc | Q92551 |
Top |
Malignant transformation analysis |
| Identification of the aberrant gene expression in precancerous and cancerous lesions by comparing the gene expression of stem-like cells in diseased tissues with normal stem cells |
| Entrez ID | Symbol | Replicates | Species | Organ | Tissue | Adj P-value | Log2FC | Malignancy |
| 9807 | IP6K1 | GSM6177620_NYU_UCEC1_lib1_lib1 | Human | Endometrium | EEC | 8.20e-08 | -2.21e-02 | -0.1869 |
| 9807 | IP6K1 | GSM6177620_NYU_UCEC1_lib2_lib2 | Human | Endometrium | EEC | 1.52e-05 | -6.74e-02 | -0.1875 |
| 9807 | IP6K1 | GSM6177620_NYU_UCEC1_lib3_lib3 | Human | Endometrium | EEC | 1.23e-04 | -9.92e-02 | -0.1883 |
| 9807 | IP6K1 | GSM6177621_NYU_UCEC2_lib1_lib1 | Human | Endometrium | EEC | 3.60e-04 | -1.85e-02 | -0.1934 |
| 9807 | IP6K1 | GSM6177622_NYU_UCEC3_lib1_lib1 | Human | Endometrium | EEC | 2.74e-11 | -3.94e-02 | -0.1917 |
| 9807 | IP6K1 | GSM6177622_NYU_UCEC3_lib2_lib2 | Human | Endometrium | EEC | 3.09e-08 | -6.06e-02 | -0.1916 |
| 9807 | IP6K1 | LZE4T | Human | Esophagus | ESCC | 7.83e-03 | 7.89e-02 | 0.0811 |
| 9807 | IP6K1 | LZE24T | Human | Esophagus | ESCC | 1.02e-06 | 1.99e-01 | 0.0596 |
| 9807 | IP6K1 | P2T-E | Human | Esophagus | ESCC | 2.92e-16 | 1.52e-01 | 0.1177 |
| 9807 | IP6K1 | P4T-E | Human | Esophagus | ESCC | 1.26e-09 | 1.68e-01 | 0.1323 |
| 9807 | IP6K1 | P5T-E | Human | Esophagus | ESCC | 2.90e-13 | 7.96e-02 | 0.1327 |
| 9807 | IP6K1 | P8T-E | Human | Esophagus | ESCC | 3.59e-06 | 6.88e-02 | 0.0889 |
| 9807 | IP6K1 | P9T-E | Human | Esophagus | ESCC | 4.49e-07 | 1.55e-01 | 0.1131 |
| 9807 | IP6K1 | P10T-E | Human | Esophagus | ESCC | 7.65e-22 | 1.42e-01 | 0.116 |
| 9807 | IP6K1 | P12T-E | Human | Esophagus | ESCC | 4.41e-14 | 2.45e-01 | 0.1122 |
| 9807 | IP6K1 | P15T-E | Human | Esophagus | ESCC | 1.09e-09 | 1.68e-01 | 0.1149 |
| 9807 | IP6K1 | P16T-E | Human | Esophagus | ESCC | 7.71e-14 | 1.55e-01 | 0.1153 |
| 9807 | IP6K1 | P17T-E | Human | Esophagus | ESCC | 8.06e-03 | 1.81e-01 | 0.1278 |
| 9807 | IP6K1 | P19T-E | Human | Esophagus | ESCC | 2.51e-09 | 3.90e-01 | 0.1662 |
| 9807 | IP6K1 | P20T-E | Human | Esophagus | ESCC | 5.09e-10 | 1.83e-01 | 0.1124 |
| Page: 1 2 3 4 |
| Tissue | Expression Dynamics | Abbreviation |
| Endometrium |  | AEH: Atypical endometrial hyperplasia |
| EEC: Endometrioid Cancer | ||
| Esophagus | 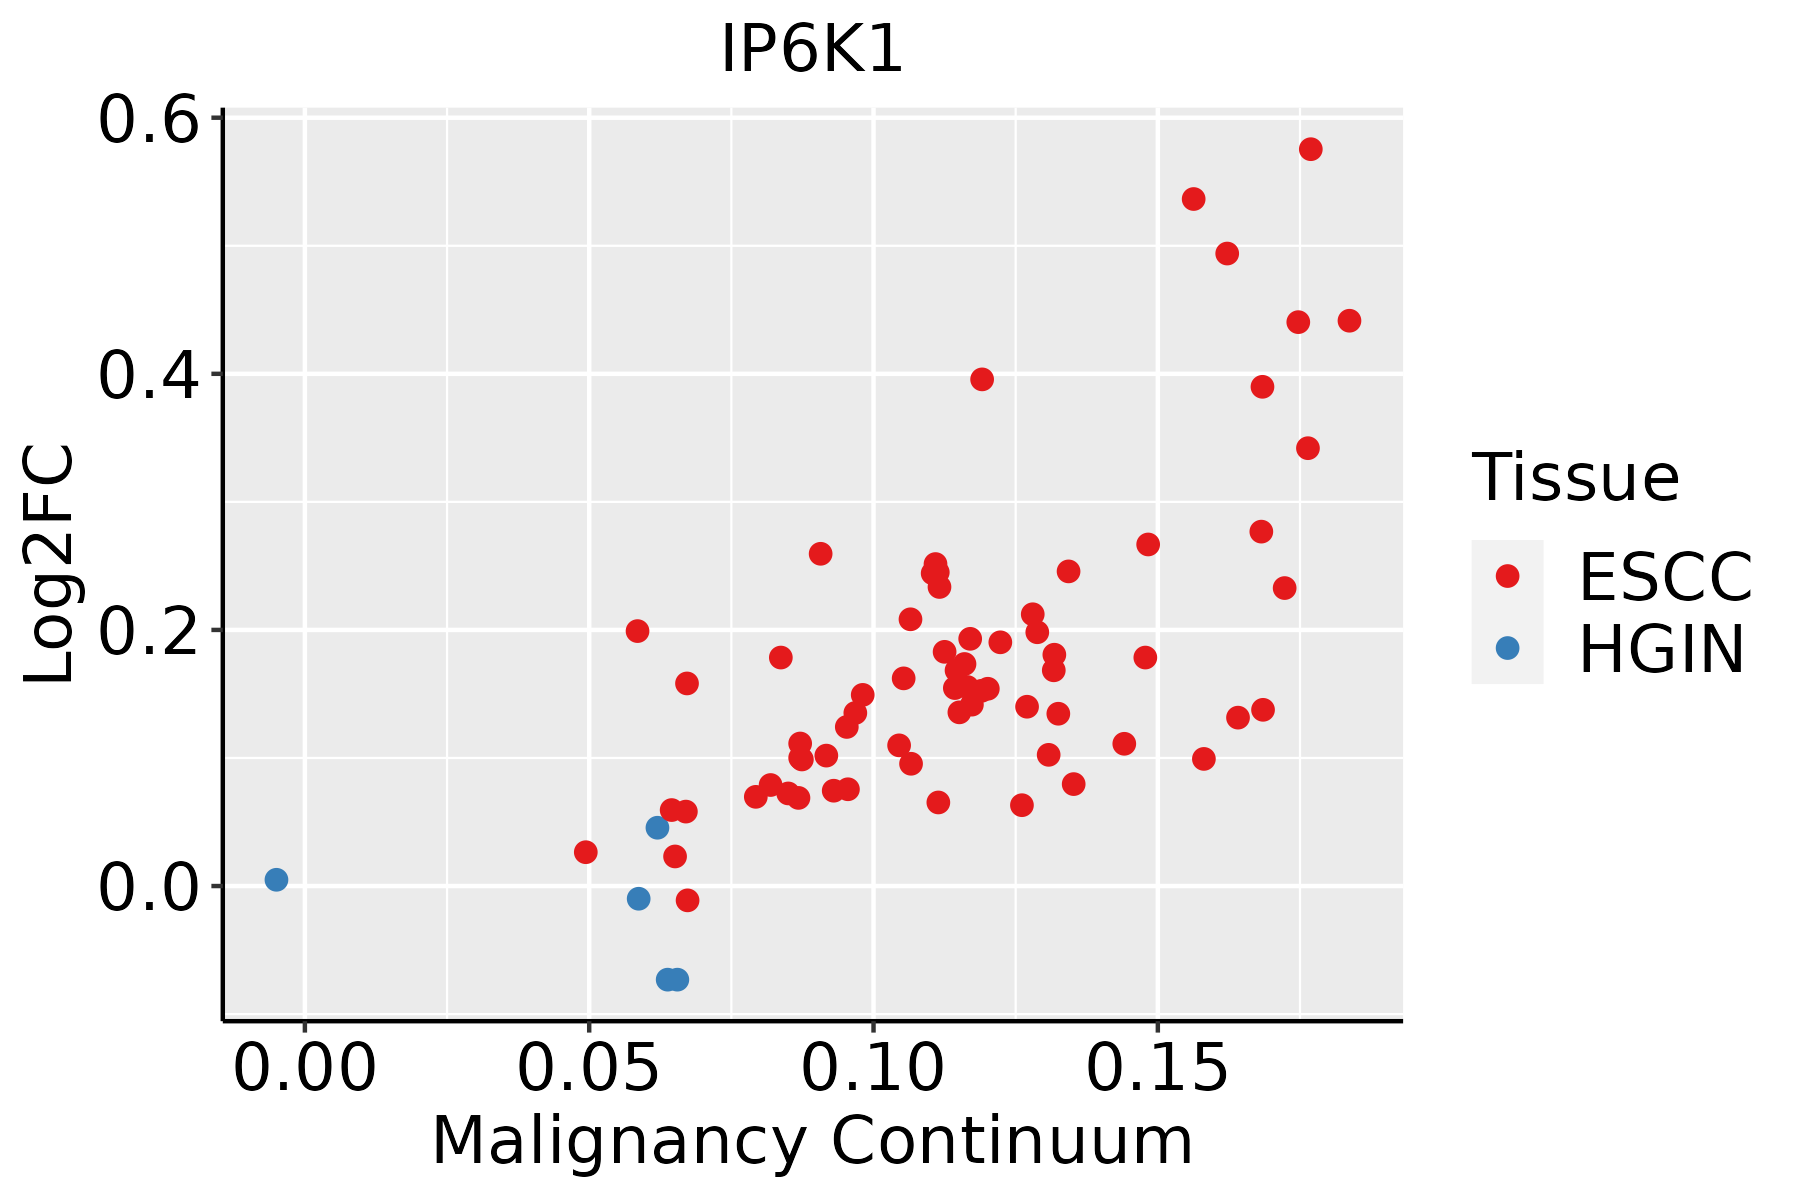 | ESCC: Esophageal squamous cell carcinoma |
| HGIN: High-grade intraepithelial neoplasias | ||
| LGIN: Low-grade intraepithelial neoplasias | ||
| Liver | 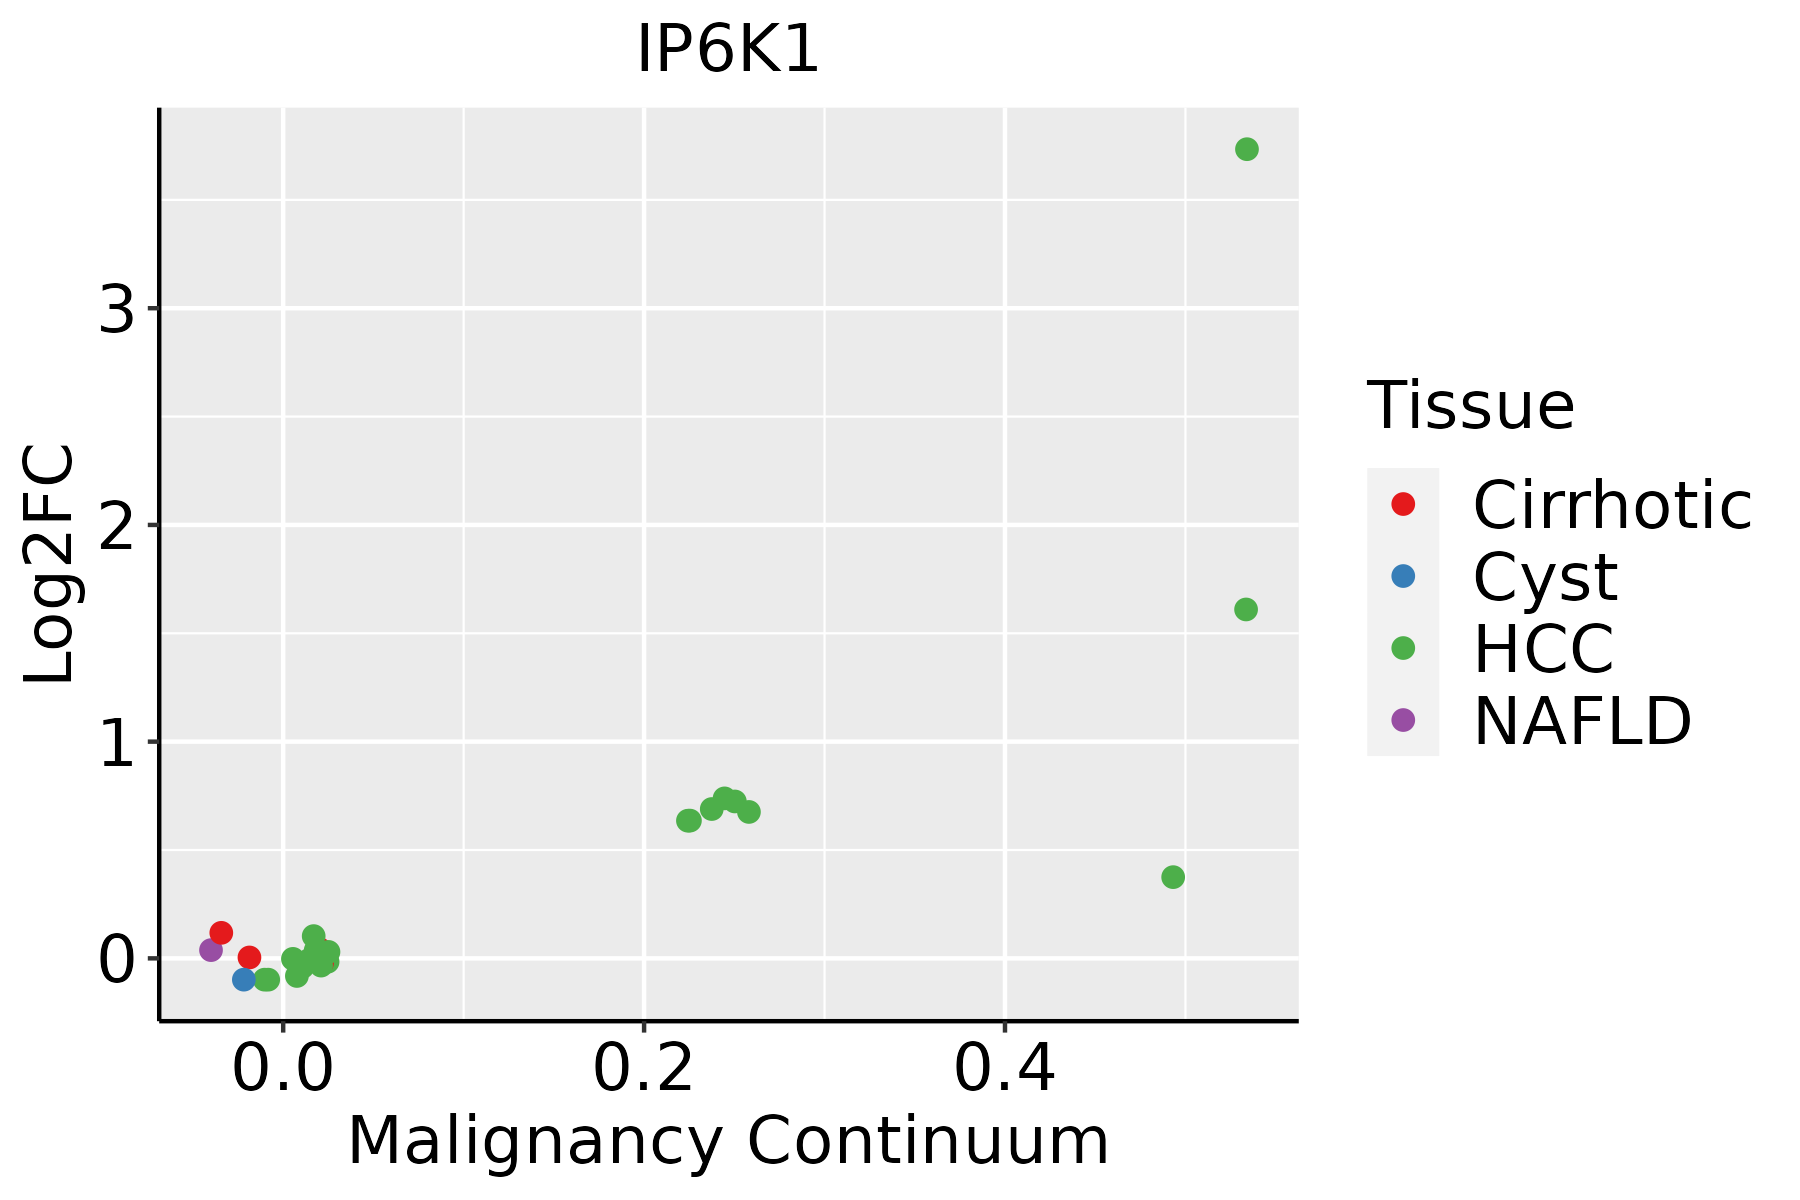 | HCC: Hepatocellular carcinoma |
| NAFLD: Non-alcoholic fatty liver disease |
| ∗log2FC in expression of this searched gene in stem-like cells from each diseased tissue sample relative to stem-like cells in normal samples in each tissue plotted against the malignancy continuum. Samples are colored based on if they are from different disease stage. |
Top |
Malignant transformation related pathway analysis |
| Find out the enriched GO biological processes and KEGG pathways involved in transition from healthy to precancer to cancer |
| Tissue | Disease Stage | Enriched GO biological Processes |
| Colorectum | AD |  |
| Colorectum | SER |  |
| Colorectum | MSS |  |
| Colorectum | MSI-H |  |
| Colorectum | FAP |  |
| ∗Top 15 enriched GO BP terms are showed in the bar plot of each disease state in each tissue. Each row represents a significant GO biological process which is colored according to the -log10(p.adjust). |
| Page: 1 2 3 4 5 6 7 8 9 |
| GO ID | Tissue | Disease Stage | Description | Gene Ratio | Bg Ratio | pvalue | p.adjust | Count |
| GO:00086544 | Esophagus | ESCC | phospholipid biosynthetic process | 162/8552 | 253/18723 | 2.59e-09 | 5.73e-08 | 162 |
| GO:00464744 | Esophagus | ESCC | glycerophospholipid biosynthetic process | 135/8552 | 211/18723 | 5.75e-08 | 1.02e-06 | 135 |
| GO:00450175 | Esophagus | ESCC | glycerolipid biosynthetic process | 154/8552 | 252/18723 | 5.20e-07 | 6.96e-06 | 154 |
| GO:00066446 | Esophagus | ESCC | phospholipid metabolic process | 218/8552 | 383/18723 | 5.37e-06 | 5.59e-05 | 218 |
| GO:00060668 | Esophagus | ESCC | alcohol metabolic process | 202/8552 | 353/18723 | 7.32e-06 | 7.26e-05 | 202 |
| GO:00066505 | Esophagus | ESCC | glycerophospholipid metabolic process | 174/8552 | 306/18723 | 4.92e-05 | 3.85e-04 | 174 |
| GO:00464864 | Esophagus | ESCC | glycerolipid metabolic process | 211/8552 | 392/18723 | 6.51e-04 | 3.46e-03 | 211 |
| GO:00461653 | Esophagus | ESCC | alcohol biosynthetic process | 83/8552 | 140/18723 | 8.04e-04 | 4.16e-03 | 83 |
| GO:19016174 | Esophagus | ESCC | organic hydroxy compound biosynthetic process | 128/8552 | 237/18723 | 5.86e-03 | 2.16e-02 | 128 |
| GO:01061066 | Esophagus | ESCC | cold-induced thermogenesis | 80/8552 | 144/18723 | 1.07e-02 | 3.65e-02 | 80 |
| GO:01201616 | Esophagus | ESCC | regulation of cold-induced thermogenesis | 80/8552 | 144/18723 | 1.07e-02 | 3.65e-02 | 80 |
| GO:00066611 | Esophagus | ESCC | phosphatidylinositol biosynthetic process | 73/8552 | 131/18723 | 1.31e-02 | 4.28e-02 | 73 |
| GO:000606621 | Liver | HCC | alcohol metabolic process | 208/7958 | 353/18723 | 2.80e-10 | 9.50e-09 | 208 |
| GO:00086542 | Liver | HCC | phospholipid biosynthetic process | 150/7958 | 253/18723 | 4.77e-08 | 1.03e-06 | 150 |
| GO:00066444 | Liver | HCC | phospholipid metabolic process | 214/7958 | 383/18723 | 7.25e-08 | 1.48e-06 | 214 |
| GO:004648611 | Liver | HCC | glycerolipid metabolic process | 215/7958 | 392/18723 | 4.54e-07 | 7.49e-06 | 215 |
| GO:004501711 | Liver | HCC | glycerolipid biosynthetic process | 143/7958 | 252/18723 | 3.27e-06 | 4.31e-05 | 143 |
| GO:00066504 | Liver | HCC | glycerophospholipid metabolic process | 168/7958 | 306/18723 | 7.27e-06 | 8.62e-05 | 168 |
| GO:004647411 | Liver | HCC | glycerophospholipid biosynthetic process | 121/7958 | 211/18723 | 9.12e-06 | 1.06e-04 | 121 |
| GO:19016172 | Liver | HCC | organic hydroxy compound biosynthetic process | 129/7958 | 237/18723 | 1.32e-04 | 1.08e-03 | 129 |
| Page: 1 2 |
| Pathway ID | Tissue | Disease Stage | Description | Gene Ratio | Bg Ratio | pvalue | p.adjust | qvalue | Count |
| Page: 1 |
Top |
Cell-cell communication analysis |
| Identification of potential cell-cell interactions between two cell types and their ligand-receptor pairs for different disease states |
| Ligand | Receptor | LRpair | Pathway | Tissue | Disease Stage |
| Page: 1 |
Top |
Single-cell gene regulatory network inference analysis |
| Find out the significant the regulons (TFs) and the target genes of each regulon across cell types for different disease states |
| TF | Cell Type | Tissue | Disease Stage | Target Gene | RSS | Regulon Activity |
| ∗The dot plots of a searched regulon are shown for all cell subpopulations in each disease state of each tissue based on the regulon specific score inferred using pySCENIC and by calculating the average expression. |
| Page: 1 |
Top |
Somatic mutation of malignant transformation related genes |
| Annotation of somatic variants for genes involved in malignant transformation |
| Hugo Symbol | Variant Class | Variant Classification | dbSNP RS | HGVSc | HGVSp | HGVSp Short | SWISSPROT | BIOTYPE | SIFT | PolyPhen | Tumor Sample Barcode | Tissue | Histology | Sex | Age | Stage | Therapy Types | Drugs | Outcome |
| IP6K1 | SNV | Missense_Mutation | c.1244N>G | p.His415Arg | p.H415R | Q92551 | protein_coding | deleterious(0) | probably_damaging(0.987) | TCGA-AO-A128-01 | Breast | breast invasive carcinoma | Female | <65 | I/II | Chemotherapy | doxorubicin | SD | |
| IP6K1 | SNV | Missense_Mutation | c.593A>G | p.Glu198Gly | p.E198G | Q92551 | protein_coding | deleterious(0.01) | possibly_damaging(0.458) | TCGA-C8-A26Y-01 | Breast | breast invasive carcinoma | Female | >=65 | I/II | Unknown | Unknown | SD | |
| IP6K1 | SNV | Missense_Mutation | rs776571630 | c.127N>A | p.Asp43Asn | p.D43N | Q92551 | protein_coding | tolerated(0.14) | probably_damaging(0.981) | TCGA-D8-A1JC-01 | Breast | breast invasive carcinoma | Female | <65 | III/IV | Chemotherapy | adriamycin | SD |
| IP6K1 | SNV | Missense_Mutation | c.715N>A | p.Glu239Lys | p.E239K | Q92551 | protein_coding | deleterious(0) | probably_damaging(0.992) | TCGA-Q1-A5R2-01 | Cervix | cervical & endocervical cancer | Female | <65 | I/II | Chemotherapy | cisplatin | PR | |
| IP6K1 | SNV | Missense_Mutation | rs150703602 | c.868N>T | p.Arg290Cys | p.R290C | Q92551 | protein_coding | deleterious(0) | probably_damaging(0.996) | TCGA-A6-2686-01 | Colorectum | colon adenocarcinoma | Female | >=65 | I/II | Unknown | Unknown | SD |
| IP6K1 | SNV | Missense_Mutation | c.557N>A | p.Arg186His | p.R186H | Q92551 | protein_coding | tolerated(0.8) | benign(0.001) | TCGA-AA-3492-01 | Colorectum | colon adenocarcinoma | Female | >=65 | I/II | Unknown | Unknown | SD | |
| IP6K1 | SNV | Missense_Mutation | c.356N>A | p.Arg119His | p.R119H | Q92551 | protein_coding | tolerated(0.14) | possibly_damaging(0.828) | TCGA-AA-3977-01 | Colorectum | colon adenocarcinoma | Male | >=65 | I/II | Unknown | Unknown | SD | |
| IP6K1 | SNV | Missense_Mutation | c.450G>T | p.Lys150Asn | p.K150N | Q92551 | protein_coding | tolerated(0.19) | benign(0.018) | TCGA-AA-A010-01 | Colorectum | colon adenocarcinoma | Female | <65 | I/II | Chemotherapy | folinic | CR | |
| IP6K1 | SNV | Missense_Mutation | c.752N>A | p.Ser251Asn | p.S251N | Q92551 | protein_coding | deleterious(0) | probably_damaging(0.998) | TCGA-AU-6004-01 | Colorectum | colon adenocarcinoma | Female | >=65 | I/II | Unknown | Unknown | SD | |
| IP6K1 | SNV | Missense_Mutation | novel | c.1208N>A | p.Ser403Asn | p.S403N | Q92551 | protein_coding | deleterious(0) | probably_damaging(0.953) | TCGA-AZ-6598-01 | Colorectum | colon adenocarcinoma | Female | >=65 | I/II | Unknown | Unknown | SD |
| Page: 1 2 3 4 5 |
Top |
Related drugs of malignant transformation related genes |
| Identification of chemicals and drugs interact with genes involved in malignant transfromation |
| (DGIdb 4.0) |
| Entrez ID | Symbol | Category | Interaction Types | Drug Claim Name | Drug Name | PMIDs |
| Page: 1 |

Copyright 2023-Present -The University of Texas Health Science Center at Houston |