
|
|||||
|
 | |
| |
| |
| |
| |
| |
|
Gene: INTS8 |
Gene summary for INTS8 |
| Gene information | Species | Human | Gene symbol | INTS8 | Gene ID | 55656 |
| Gene name | integrator complex subunit 8 | |
| Gene Alias | C8orf52 | |
| Cytomap | 8q22.1 | |
| Gene Type | protein-coding | GO ID | GO:0006139 | UniProtAcc | Q75QN2 |
Top |
Malignant transformation analysis |
| Identification of the aberrant gene expression in precancerous and cancerous lesions by comparing the gene expression of stem-like cells in diseased tissues with normal stem cells |
| Entrez ID | Symbol | Replicates | Species | Organ | Tissue | Adj P-value | Log2FC | Malignancy |
| 55656 | INTS8 | LZE2T | Human | Esophagus | ESCC | 7.84e-04 | 5.15e-01 | 0.082 |
| 55656 | INTS8 | LZE4T | Human | Esophagus | ESCC | 1.75e-08 | 2.34e-01 | 0.0811 |
| 55656 | INTS8 | LZE8T | Human | Esophagus | ESCC | 7.87e-06 | 1.43e-01 | 0.067 |
| 55656 | INTS8 | LZE20T | Human | Esophagus | ESCC | 9.12e-11 | 2.35e-01 | 0.0662 |
| 55656 | INTS8 | LZE22T | Human | Esophagus | ESCC | 7.60e-04 | 2.34e-01 | 0.068 |
| 55656 | INTS8 | LZE24T | Human | Esophagus | ESCC | 5.15e-11 | 3.33e-01 | 0.0596 |
| 55656 | INTS8 | P1T-E | Human | Esophagus | ESCC | 1.25e-03 | 2.31e-01 | 0.0875 |
| 55656 | INTS8 | P2T-E | Human | Esophagus | ESCC | 1.18e-24 | 4.15e-01 | 0.1177 |
| 55656 | INTS8 | P4T-E | Human | Esophagus | ESCC | 1.29e-11 | 3.05e-01 | 0.1323 |
| 55656 | INTS8 | P5T-E | Human | Esophagus | ESCC | 5.96e-12 | 1.06e-01 | 0.1327 |
| 55656 | INTS8 | P8T-E | Human | Esophagus | ESCC | 8.01e-15 | 1.54e-01 | 0.0889 |
| 55656 | INTS8 | P9T-E | Human | Esophagus | ESCC | 4.83e-04 | 1.42e-01 | 0.1131 |
| 55656 | INTS8 | P10T-E | Human | Esophagus | ESCC | 3.66e-08 | 2.07e-01 | 0.116 |
| 55656 | INTS8 | P11T-E | Human | Esophagus | ESCC | 4.17e-05 | 2.19e-01 | 0.1426 |
| 55656 | INTS8 | P12T-E | Human | Esophagus | ESCC | 2.99e-22 | 3.93e-01 | 0.1122 |
| 55656 | INTS8 | P15T-E | Human | Esophagus | ESCC | 8.06e-17 | 3.78e-01 | 0.1149 |
| 55656 | INTS8 | P16T-E | Human | Esophagus | ESCC | 8.15e-18 | 4.29e-01 | 0.1153 |
| 55656 | INTS8 | P17T-E | Human | Esophagus | ESCC | 2.16e-05 | 2.38e-01 | 0.1278 |
| 55656 | INTS8 | P19T-E | Human | Esophagus | ESCC | 1.40e-02 | 3.29e-01 | 0.1662 |
| 55656 | INTS8 | P20T-E | Human | Esophagus | ESCC | 4.99e-15 | 2.84e-01 | 0.1124 |
| Page: 1 2 3 4 5 |
| Tissue | Expression Dynamics | Abbreviation |
| Esophagus | 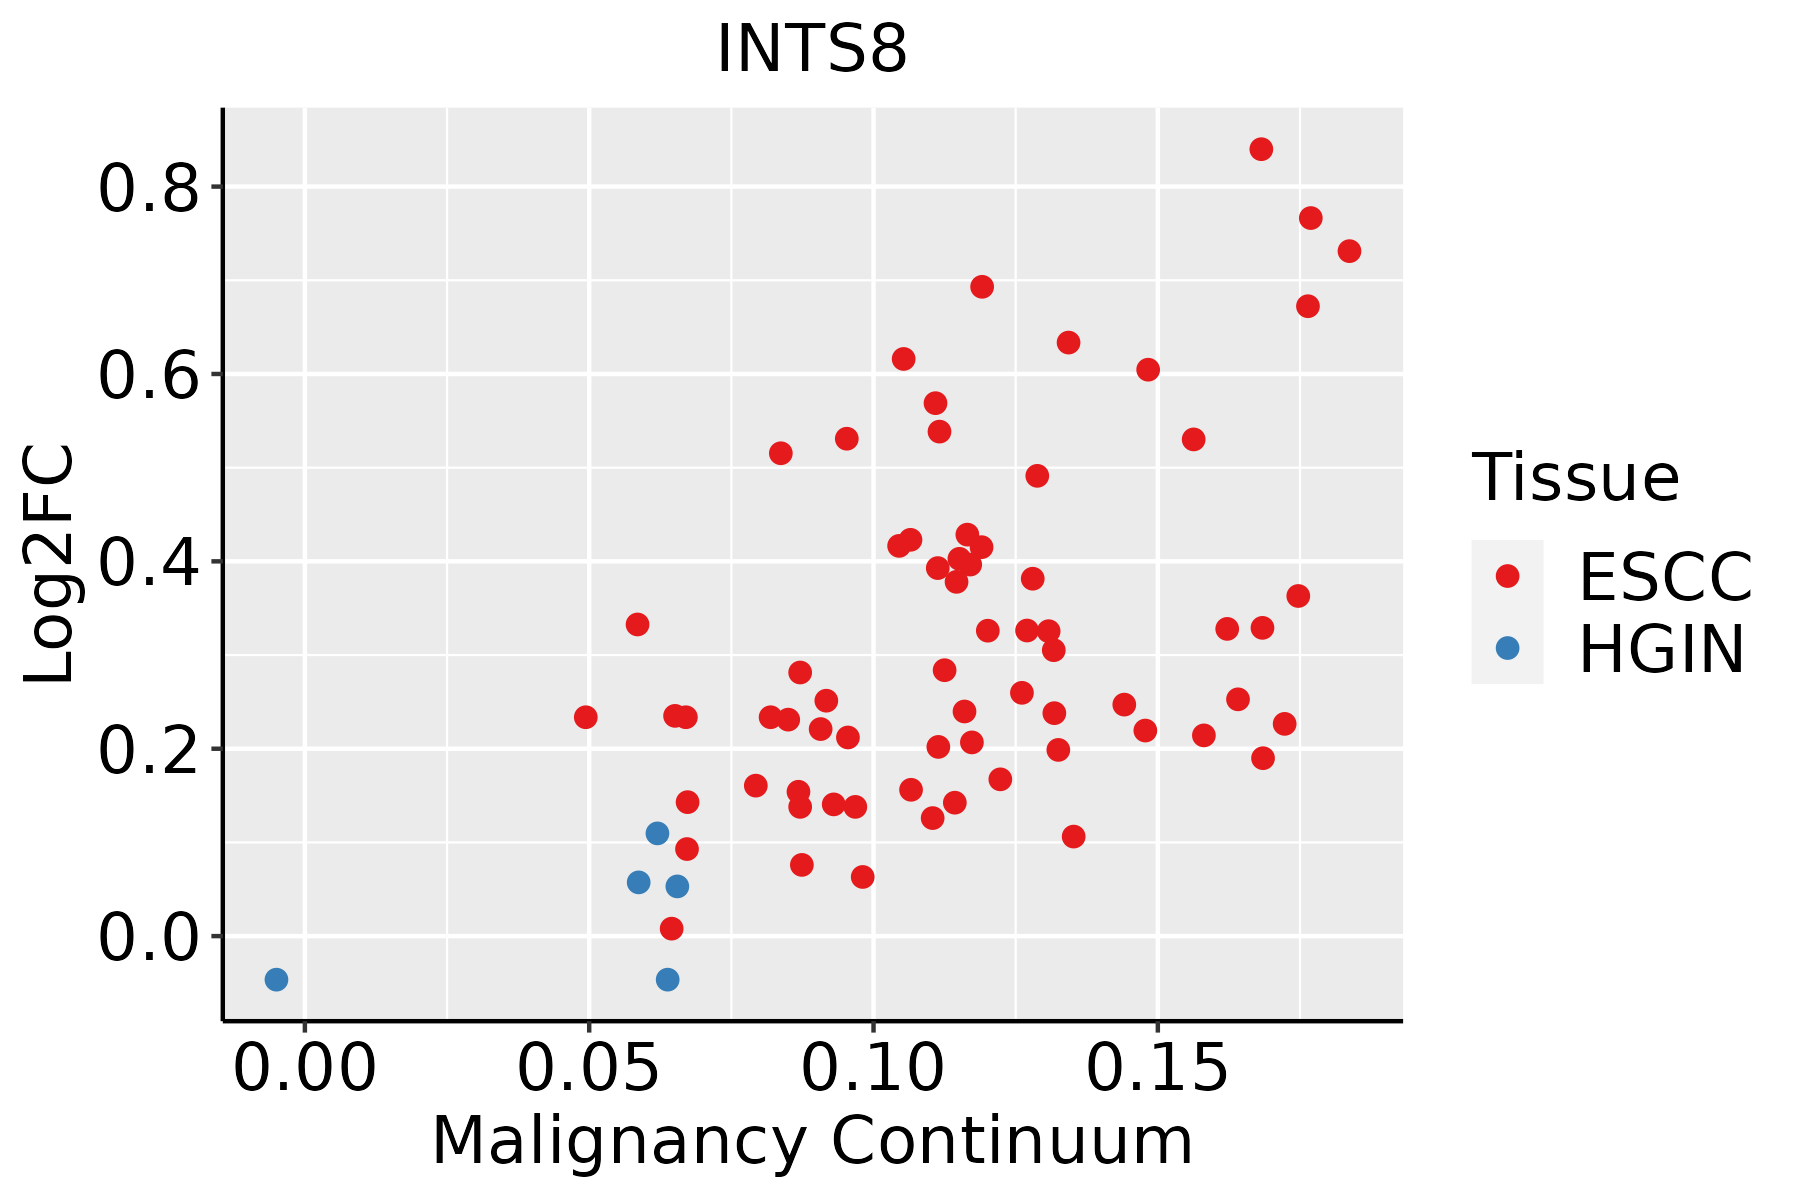 | ESCC: Esophageal squamous cell carcinoma |
| HGIN: High-grade intraepithelial neoplasias | ||
| LGIN: Low-grade intraepithelial neoplasias | ||
| Liver | 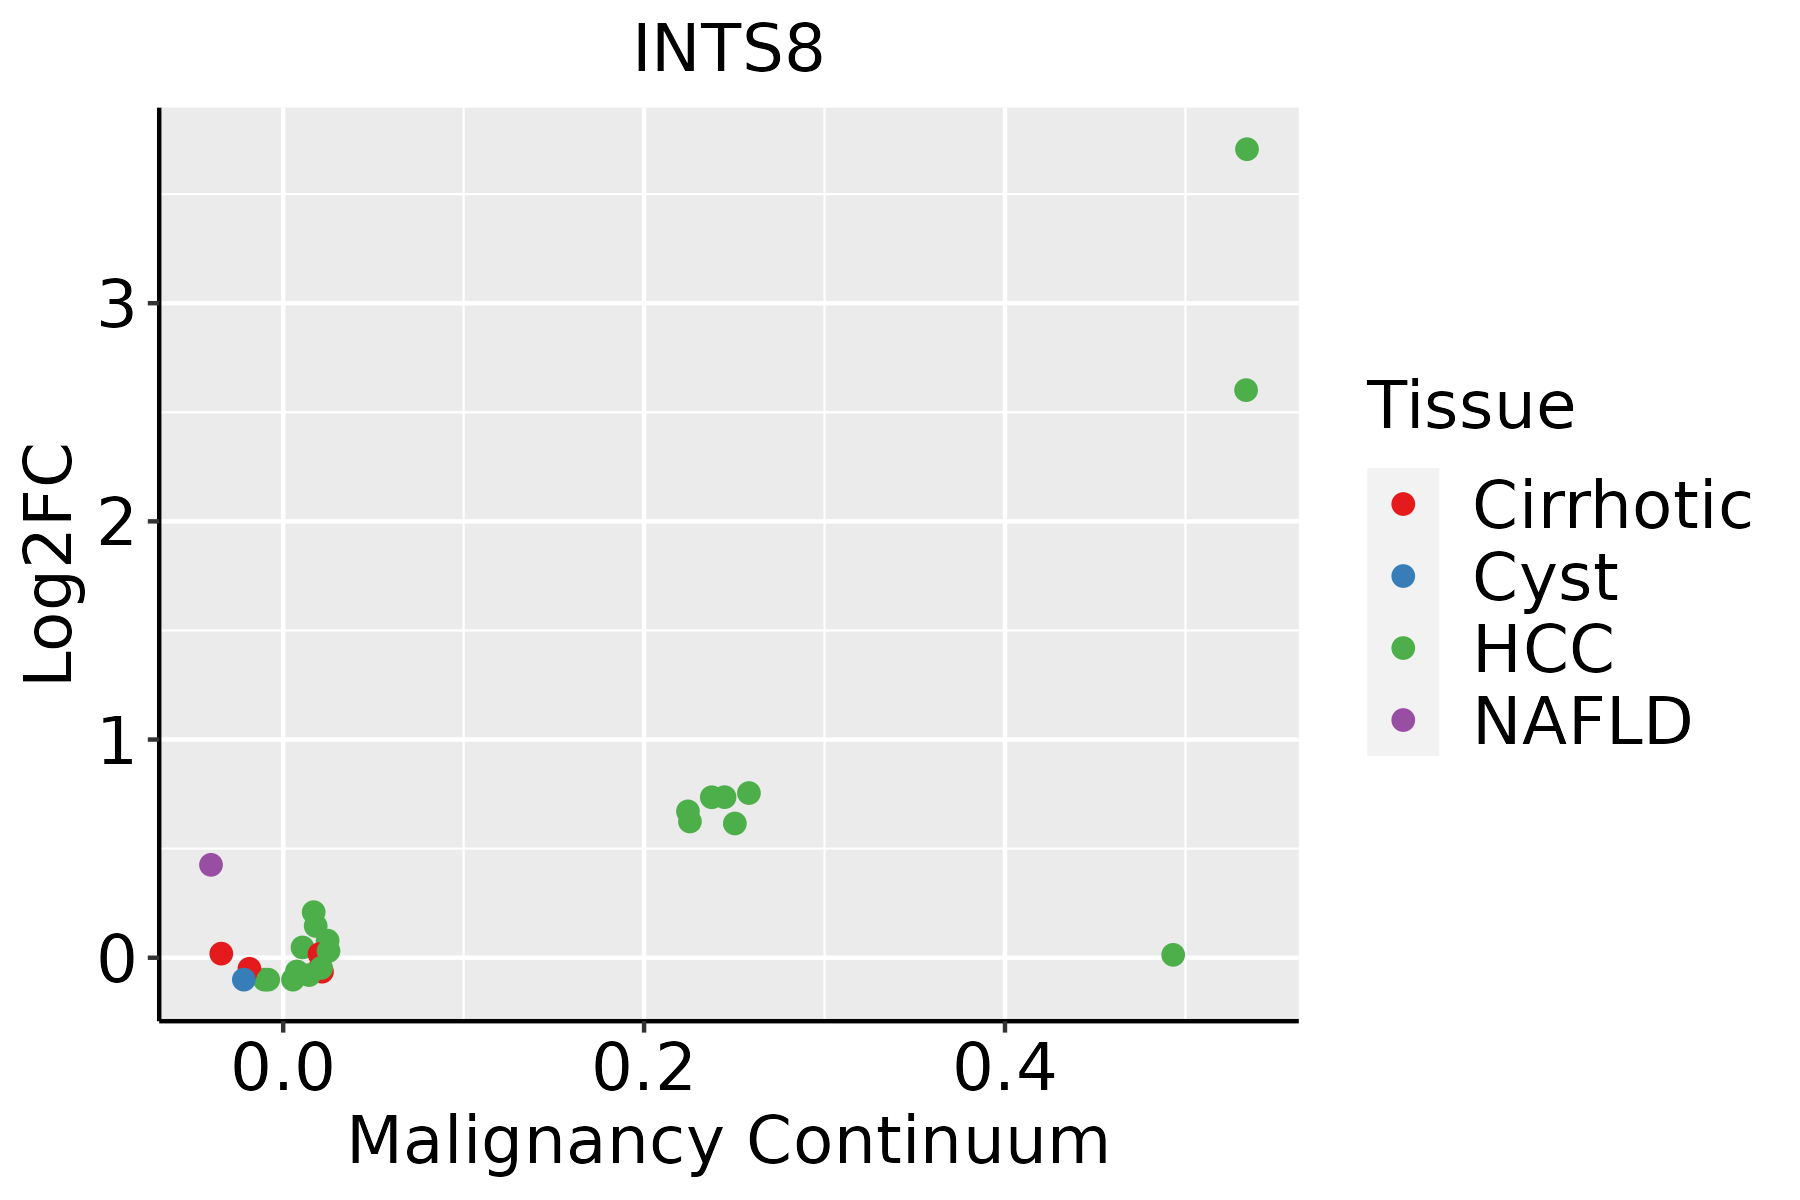 | HCC: Hepatocellular carcinoma |
| NAFLD: Non-alcoholic fatty liver disease | ||
| Oral Cavity |  | EOLP: Erosive Oral lichen planus |
| LP: leukoplakia | ||
| NEOLP: Non-erosive oral lichen planus | ||
| OSCC: Oral squamous cell carcinoma | ||
| Skin | 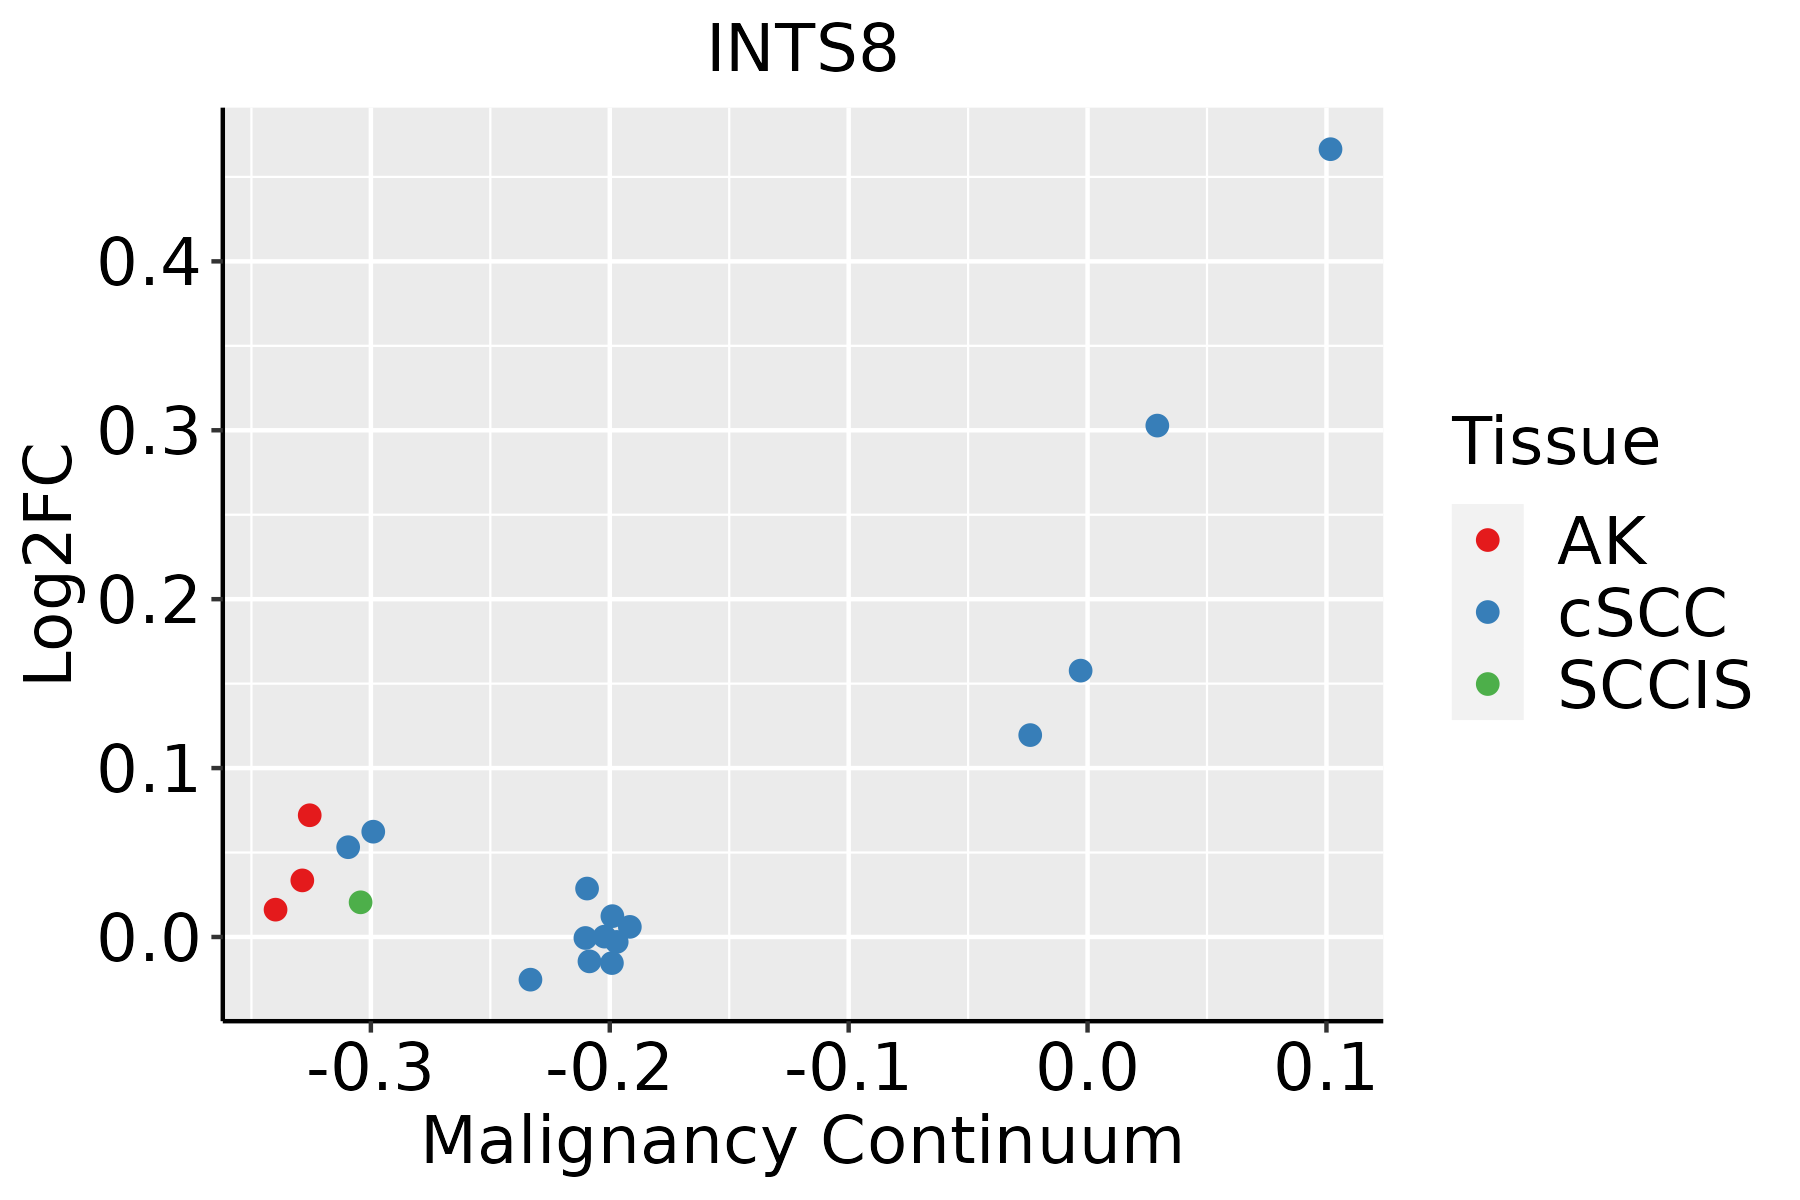 | AK: Actinic keratosis |
| cSCC: Cutaneous squamous cell carcinoma | ||
| SCCIS:squamous cell carcinoma in situ |
| ∗log2FC in expression of this searched gene in stem-like cells from each diseased tissue sample relative to stem-like cells in normal samples in each tissue plotted against the malignancy continuum. Samples are colored based on if they are from different disease stage. |
Top |
Malignant transformation related pathway analysis |
| Find out the enriched GO biological processes and KEGG pathways involved in transition from healthy to precancer to cancer |
| Tissue | Disease Stage | Enriched GO biological Processes |
| Colorectum | AD |  |
| Colorectum | SER |  |
| Colorectum | MSS |  |
| Colorectum | MSI-H |  |
| Colorectum | FAP |  |
| ∗Top 15 enriched GO BP terms are showed in the bar plot of each disease state in each tissue. Each row represents a significant GO biological process which is colored according to the -log10(p.adjust). |
| Page: 1 2 3 4 5 6 7 8 9 |
| GO ID | Tissue | Disease Stage | Description | Gene Ratio | Bg Ratio | pvalue | p.adjust | Count |
| GO:003447015 | Esophagus | ESCC | ncRNA processing | 300/8552 | 395/18723 | 3.09e-35 | 3.26e-32 | 300 |
| GO:003466012 | Esophagus | ESCC | ncRNA metabolic process | 346/8552 | 485/18723 | 4.35e-31 | 2.51e-28 | 346 |
| GO:00311233 | Esophagus | ESCC | RNA 3'-end processing | 76/8552 | 116/18723 | 1.25e-05 | 1.15e-04 | 76 |
| GO:00344704 | Liver | NAFLD | ncRNA processing | 57/1882 | 395/18723 | 3.34e-03 | 2.93e-02 | 57 |
| GO:00344702 | Liver | HCC | ncRNA processing | 293/7958 | 395/18723 | 4.26e-38 | 6.76e-35 | 293 |
| GO:00346601 | Liver | HCC | ncRNA metabolic process | 332/7958 | 485/18723 | 1.48e-31 | 7.80e-29 | 332 |
| GO:00311231 | Liver | HCC | RNA 3'-end processing | 81/7958 | 116/18723 | 2.27e-09 | 6.32e-08 | 81 |
| GO:00344709 | Oral cavity | OSCC | ncRNA processing | 263/7305 | 395/18723 | 4.38e-29 | 2.78e-26 | 263 |
| GO:00346605 | Oral cavity | OSCC | ncRNA metabolic process | 296/7305 | 485/18723 | 2.94e-23 | 6.65e-21 | 296 |
| GO:00311232 | Oral cavity | OSCC | RNA 3'-end processing | 75/7305 | 116/18723 | 1.93e-08 | 3.79e-07 | 75 |
| GO:003447017 | Skin | cSCC | ncRNA processing | 215/4864 | 395/18723 | 6.83e-34 | 4.28e-31 | 215 |
| GO:003466013 | Skin | cSCC | ncRNA metabolic process | 234/4864 | 485/18723 | 1.37e-26 | 4.77e-24 | 234 |
| GO:00311234 | Skin | cSCC | RNA 3'-end processing | 58/4864 | 116/18723 | 2.47e-08 | 6.89e-07 | 58 |
| GO:0043628 | Skin | cSCC | ncRNA 3'-end processing | 22/4864 | 50/18723 | 4.31e-03 | 2.27e-02 | 22 |
| Page: 1 |
| Pathway ID | Tissue | Disease Stage | Description | Gene Ratio | Bg Ratio | pvalue | p.adjust | qvalue | Count |
| Page: 1 |
Top |
Cell-cell communication analysis |
| Identification of potential cell-cell interactions between two cell types and their ligand-receptor pairs for different disease states |
| Ligand | Receptor | LRpair | Pathway | Tissue | Disease Stage |
| Page: 1 |
Top |
Single-cell gene regulatory network inference analysis |
| Find out the significant the regulons (TFs) and the target genes of each regulon across cell types for different disease states |
| TF | Cell Type | Tissue | Disease Stage | Target Gene | RSS | Regulon Activity |
| ∗The dot plots of a searched regulon are shown for all cell subpopulations in each disease state of each tissue based on the regulon specific score inferred using pySCENIC and by calculating the average expression. |
| Page: 1 |
Top |
Somatic mutation of malignant transformation related genes |
| Annotation of somatic variants for genes involved in malignant transformation |
| Hugo Symbol | Variant Class | Variant Classification | dbSNP RS | HGVSc | HGVSp | HGVSp Short | SWISSPROT | BIOTYPE | SIFT | PolyPhen | Tumor Sample Barcode | Tissue | Histology | Sex | Age | Stage | Therapy Types | Drugs | Outcome |
| INTS8 | SNV | Missense_Mutation | novel | c.2968A>T | p.Met990Leu | p.M990L | Q75QN2 | protein_coding | tolerated(0.65) | possibly_damaging(0.811) | TCGA-A8-A09A-01 | Breast | breast invasive carcinoma | Female | <65 | I/II | Hormone Therapy | tamoxiphen | SD |
| INTS8 | SNV | Missense_Mutation | c.1252C>G | p.Leu418Val | p.L418V | Q75QN2 | protein_coding | deleterious(0.01) | benign(0.178) | TCGA-A8-A09G-01 | Breast | breast invasive carcinoma | Female | >=65 | III/IV | Unknown | Unknown | SD | |
| INTS8 | SNV | Missense_Mutation | c.230N>T | p.Arg77Ile | p.R77I | Q75QN2 | protein_coding | deleterious(0) | probably_damaging(0.994) | TCGA-AN-A046-01 | Breast | breast invasive carcinoma | Female | >=65 | I/II | Unknown | Unknown | SD | |
| INTS8 | SNV | Missense_Mutation | c.2874C>G | p.Ile958Met | p.I958M | Q75QN2 | protein_coding | deleterious(0.04) | benign(0.07) | TCGA-AN-A0XR-01 | Breast | breast invasive carcinoma | Female | <65 | III/IV | Unknown | Unknown | SD | |
| INTS8 | SNV | Missense_Mutation | c.2510N>C | p.Ile837Thr | p.I837T | Q75QN2 | protein_coding | tolerated(0.3) | benign(0.003) | TCGA-B6-A0RV-01 | Breast | breast invasive carcinoma | Female | <65 | III/IV | Unknown | Unknown | SD | |
| INTS8 | SNV | Missense_Mutation | novel | c.2942N>A | p.Arg981Lys | p.R981K | Q75QN2 | protein_coding | tolerated(0.55) | benign(0.005) | TCGA-BH-A0B6-01 | Breast | breast invasive carcinoma | Female | <65 | I/II | Unknown | Unknown | SD |
| INTS8 | SNV | Missense_Mutation | c.1318N>A | p.Ala440Thr | p.A440T | Q75QN2 | protein_coding | tolerated(0.06) | benign(0.295) | TCGA-D8-A1XK-01 | Breast | breast invasive carcinoma | Female | <65 | I/II | Chemotherapy | doxorubicine+cyclophosphamide | SD | |
| INTS8 | SNV | Missense_Mutation | c.2791N>C | p.Tyr931His | p.Y931H | Q75QN2 | protein_coding | deleterious(0.03) | probably_damaging(0.944) | TCGA-D8-A1XK-01 | Breast | breast invasive carcinoma | Female | <65 | I/II | Chemotherapy | doxorubicine+cyclophosphamide | SD | |
| INTS8 | SNV | Missense_Mutation | novel | c.2845G>A | p.Gly949Arg | p.G949R | Q75QN2 | protein_coding | deleterious(0) | probably_damaging(0.995) | TCGA-GM-A2DF-01 | Breast | breast invasive carcinoma | Female | <65 | I/II | Chemotherapy | taxol | CR |
| INTS8 | insertion | Frame_Shift_Ins | novel | c.296_297insCACAGTTTTGTTTTGCTTTATTTATTTATGTATTTATTTG | p.Leu99PhefsTer29 | p.L99Ffs*29 | Q75QN2 | protein_coding | TCGA-A8-A06P-01 | Breast | breast invasive carcinoma | Female | <65 | III/IV | Unspecific | SD |
| Page: 1 2 3 4 5 6 7 8 9 10 |
Top |
Related drugs of malignant transformation related genes |
| Identification of chemicals and drugs interact with genes involved in malignant transfromation |
| (DGIdb 4.0) |
| Entrez ID | Symbol | Category | Interaction Types | Drug Claim Name | Drug Name | PMIDs |
| Page: 1 |

Copyright 2023-Present -The University of Texas Health Science Center at Houston |