
|
|||||
|
 | |
| |
| |
| |
| |
| |
|
Gene: INTS6 |
Gene summary for INTS6 |
| Gene information | Species | Human | Gene symbol | INTS6 | Gene ID | 26512 |
| Gene name | integrator complex subunit 6 | |
| Gene Alias | DBI-1 | |
| Cytomap | 13q14.3 | |
| Gene Type | protein-coding | GO ID | GO:0006139 | UniProtAcc | Q9UL03 |
Top |
Malignant transformation analysis |
| Identification of the aberrant gene expression in precancerous and cancerous lesions by comparing the gene expression of stem-like cells in diseased tissues with normal stem cells |
| Entrez ID | Symbol | Replicates | Species | Organ | Tissue | Adj P-value | Log2FC | Malignancy |
| 26512 | INTS6 | HTA11_3410_2000001011 | Human | Colorectum | AD | 2.97e-09 | -4.65e-01 | 0.0155 |
| 26512 | INTS6 | HTA11_866_3004761011 | Human | Colorectum | AD | 7.87e-05 | -4.45e-01 | 0.096 |
| 26512 | INTS6 | HTA11_7696_3000711011 | Human | Colorectum | AD | 1.45e-08 | -4.53e-01 | 0.0674 |
| 26512 | INTS6 | HTA11_99999974143_84620 | Human | Colorectum | MSS | 4.71e-09 | -4.48e-01 | 0.3005 |
| 26512 | INTS6 | A001-C-207 | Human | Colorectum | FAP | 3.14e-02 | -3.42e-01 | 0.1278 |
| 26512 | INTS6 | A015-C-203 | Human | Colorectum | FAP | 3.22e-19 | -4.77e-01 | -0.1294 |
| 26512 | INTS6 | A015-C-204 | Human | Colorectum | FAP | 6.46e-05 | -4.28e-01 | -0.0228 |
| 26512 | INTS6 | A002-C-201 | Human | Colorectum | FAP | 4.93e-09 | -4.07e-01 | 0.0324 |
| 26512 | INTS6 | A002-C-203 | Human | Colorectum | FAP | 8.35e-05 | -2.81e-01 | 0.2786 |
| 26512 | INTS6 | A001-C-119 | Human | Colorectum | FAP | 4.18e-06 | -4.59e-01 | -0.1557 |
| 26512 | INTS6 | A001-C-108 | Human | Colorectum | FAP | 5.67e-14 | -4.11e-01 | -0.0272 |
| 26512 | INTS6 | A002-C-205 | Human | Colorectum | FAP | 4.28e-16 | -5.14e-01 | -0.1236 |
| 26512 | INTS6 | A001-C-104 | Human | Colorectum | FAP | 9.47e-04 | -3.50e-01 | 0.0184 |
| 26512 | INTS6 | A015-C-006 | Human | Colorectum | FAP | 1.79e-07 | -4.05e-01 | -0.0994 |
| 26512 | INTS6 | A015-C-106 | Human | Colorectum | FAP | 1.98e-07 | -3.91e-01 | -0.0511 |
| 26512 | INTS6 | A002-C-114 | Human | Colorectum | FAP | 4.11e-10 | -3.62e-01 | -0.1561 |
| 26512 | INTS6 | A015-C-104 | Human | Colorectum | FAP | 2.52e-19 | -4.41e-01 | -0.1899 |
| 26512 | INTS6 | A001-C-014 | Human | Colorectum | FAP | 1.93e-10 | -3.84e-01 | 0.0135 |
| 26512 | INTS6 | A002-C-016 | Human | Colorectum | FAP | 3.37e-10 | -3.77e-01 | 0.0521 |
| 26512 | INTS6 | A015-C-002 | Human | Colorectum | FAP | 2.82e-07 | -4.32e-01 | -0.0763 |
| Page: 1 2 3 4 5 6 7 8 9 10 |
| Tissue | Expression Dynamics | Abbreviation |
| Colorectum (GSE201348) |  | FAP: Familial adenomatous polyposis |
| CRC: Colorectal cancer | ||
| Colorectum (HTA11) |  | AD: Adenomas |
| SER: Sessile serrated lesions | ||
| MSI-H: Microsatellite-high colorectal cancer | ||
| MSS: Microsatellite stable colorectal cancer | ||
| Endometrium |  | AEH: Atypical endometrial hyperplasia |
| EEC: Endometrioid Cancer | ||
| Esophagus | 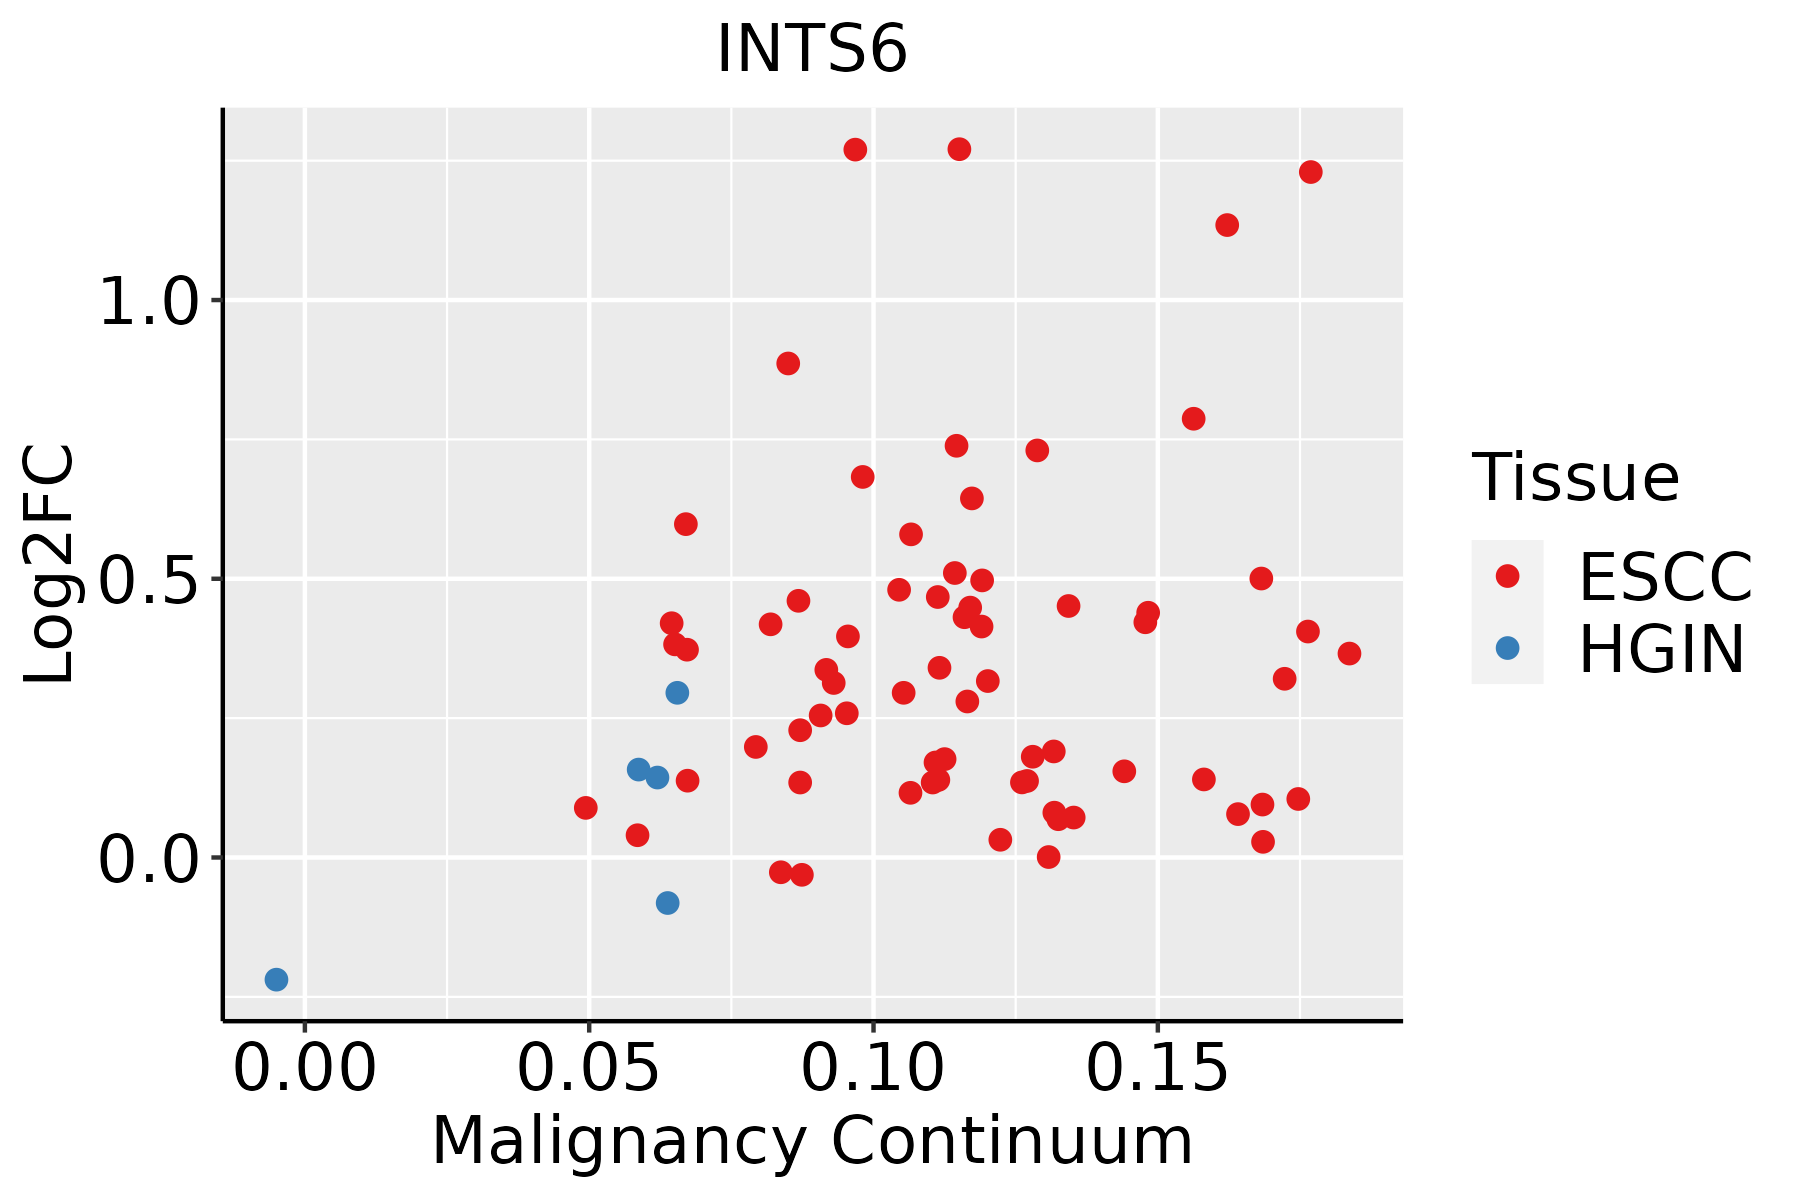 | ESCC: Esophageal squamous cell carcinoma |
| HGIN: High-grade intraepithelial neoplasias | ||
| LGIN: Low-grade intraepithelial neoplasias | ||
| Liver | 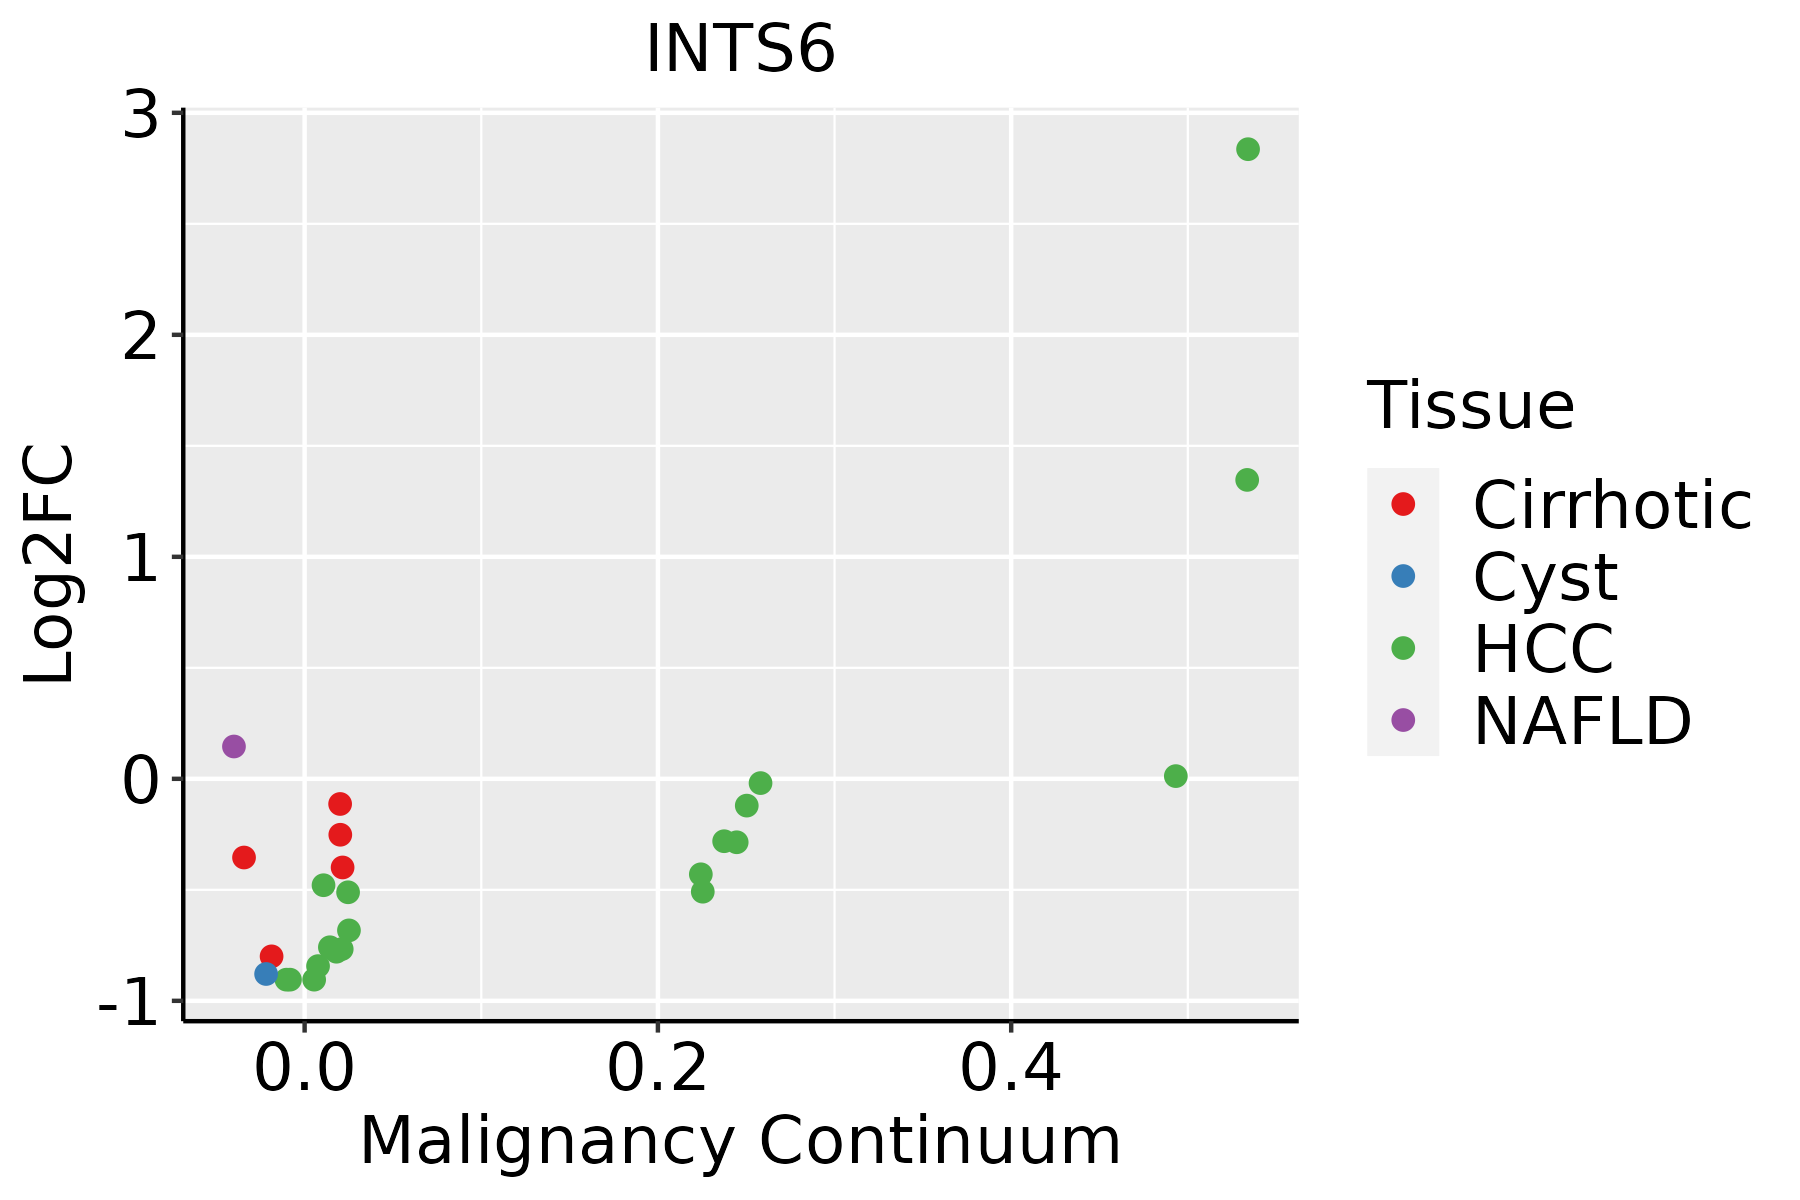 | HCC: Hepatocellular carcinoma |
| NAFLD: Non-alcoholic fatty liver disease | ||
| Lung | 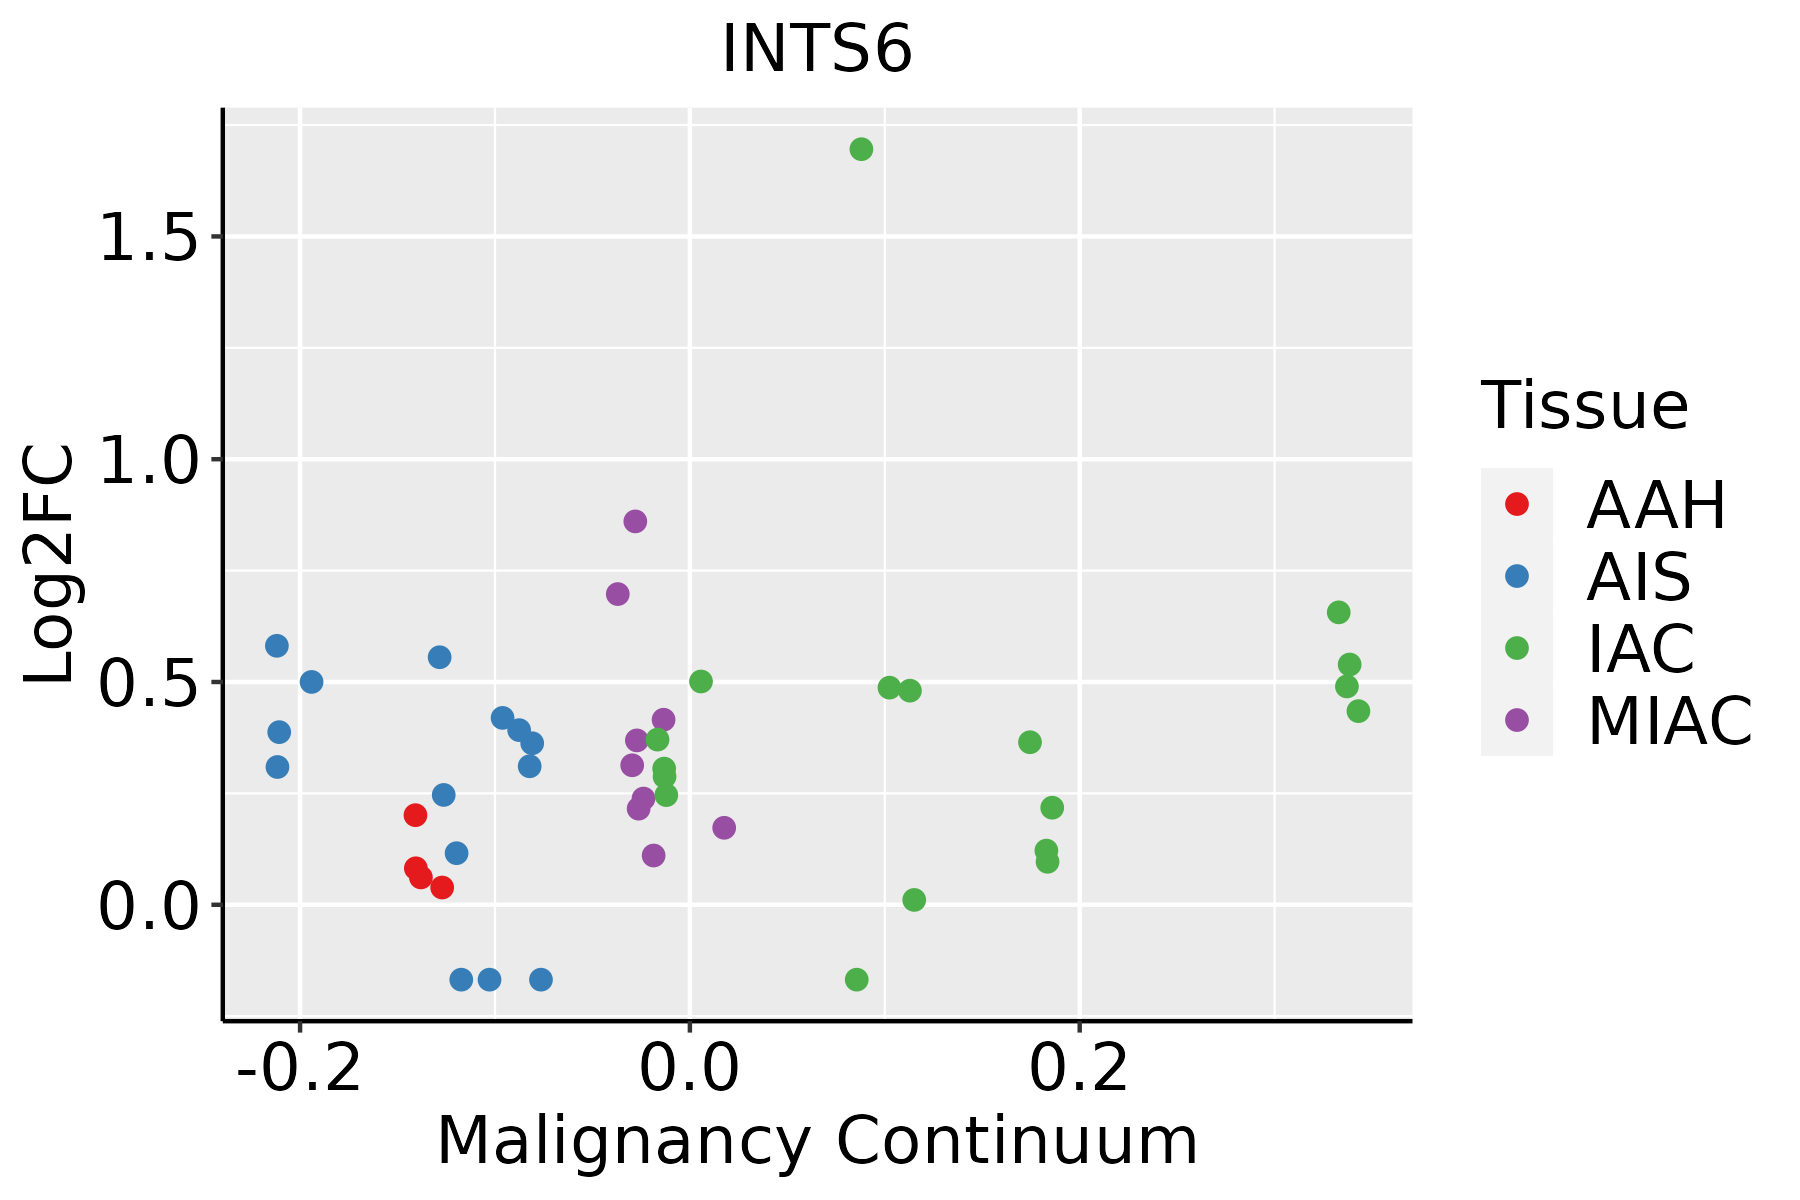 | AAH: Atypical adenomatous hyperplasia |
| AIS: Adenocarcinoma in situ | ||
| IAC: Invasive lung adenocarcinoma | ||
| MIA: Minimally invasive adenocarcinoma | ||
| Oral Cavity | 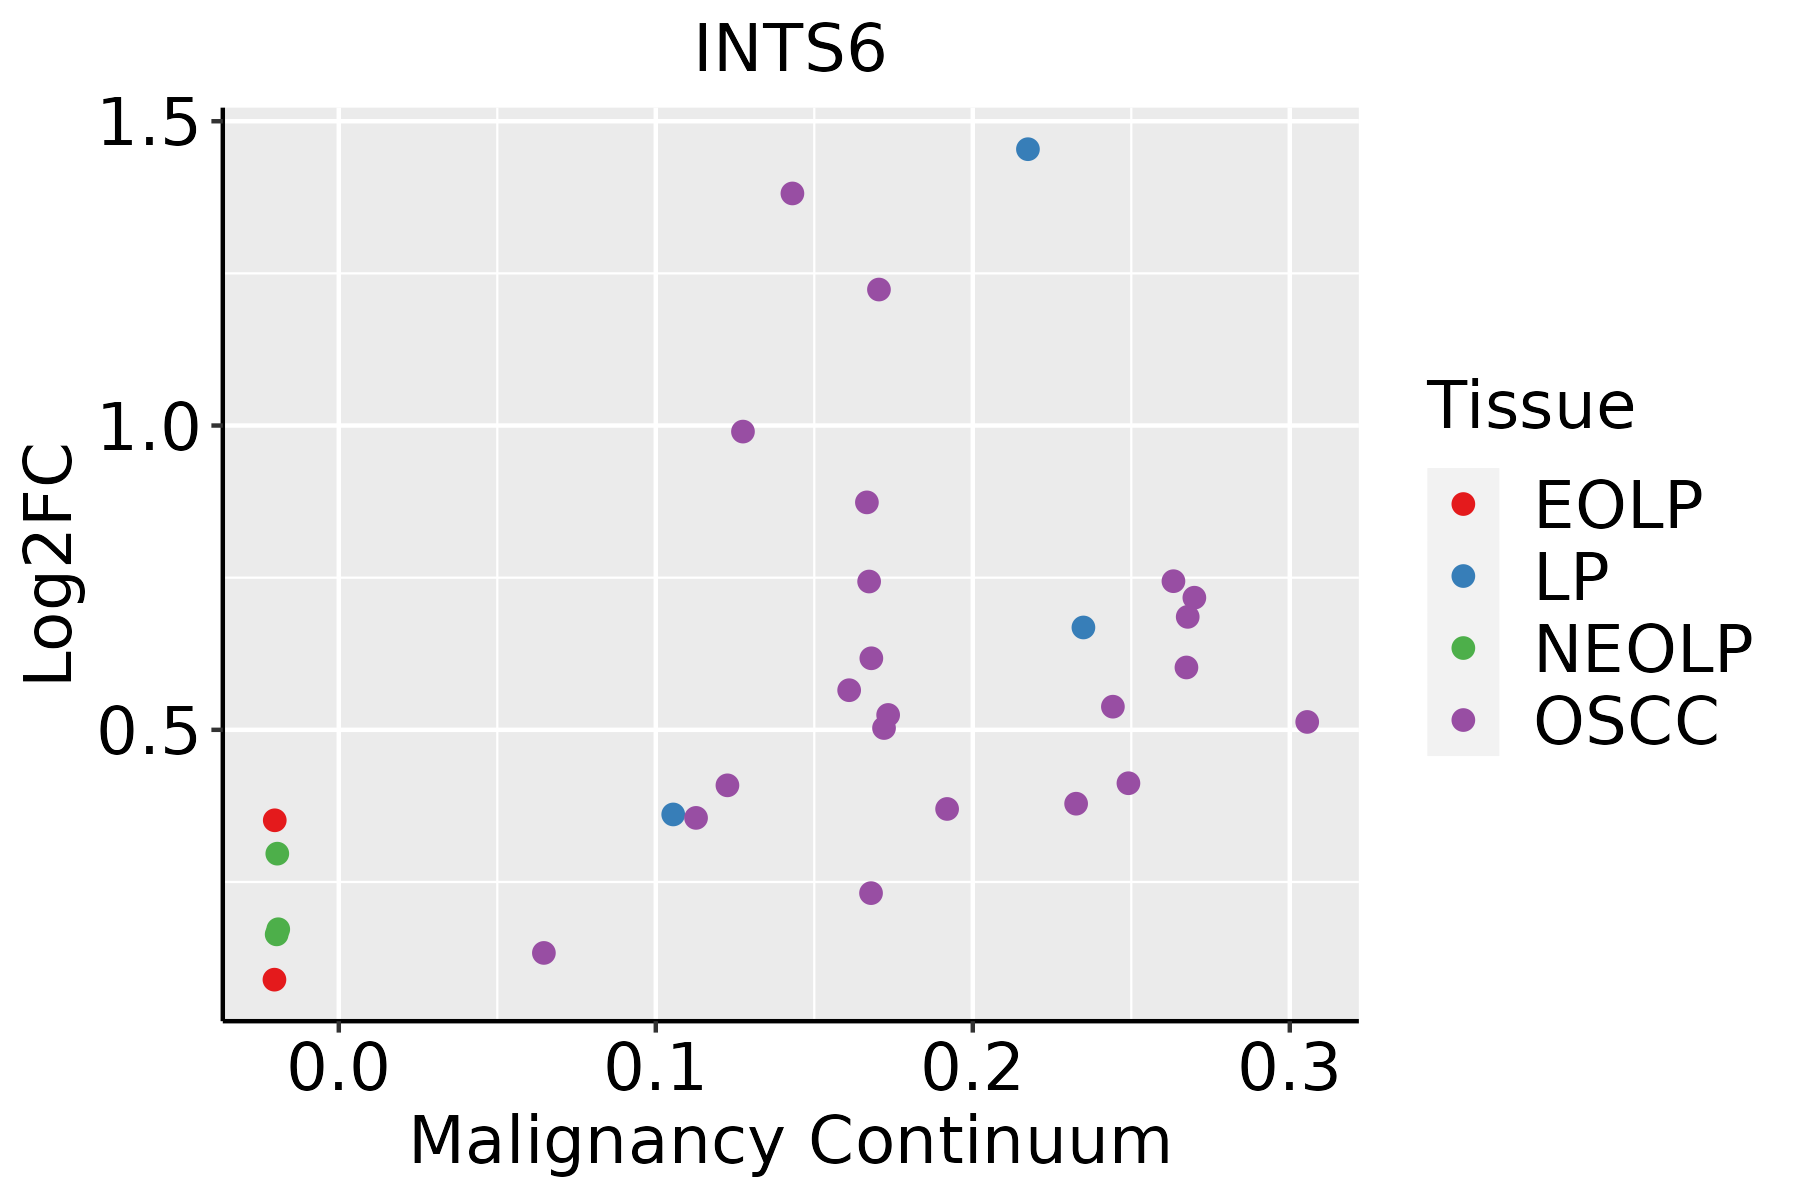 | EOLP: Erosive Oral lichen planus |
| LP: leukoplakia | ||
| NEOLP: Non-erosive oral lichen planus | ||
| OSCC: Oral squamous cell carcinoma | ||
| Prostate | 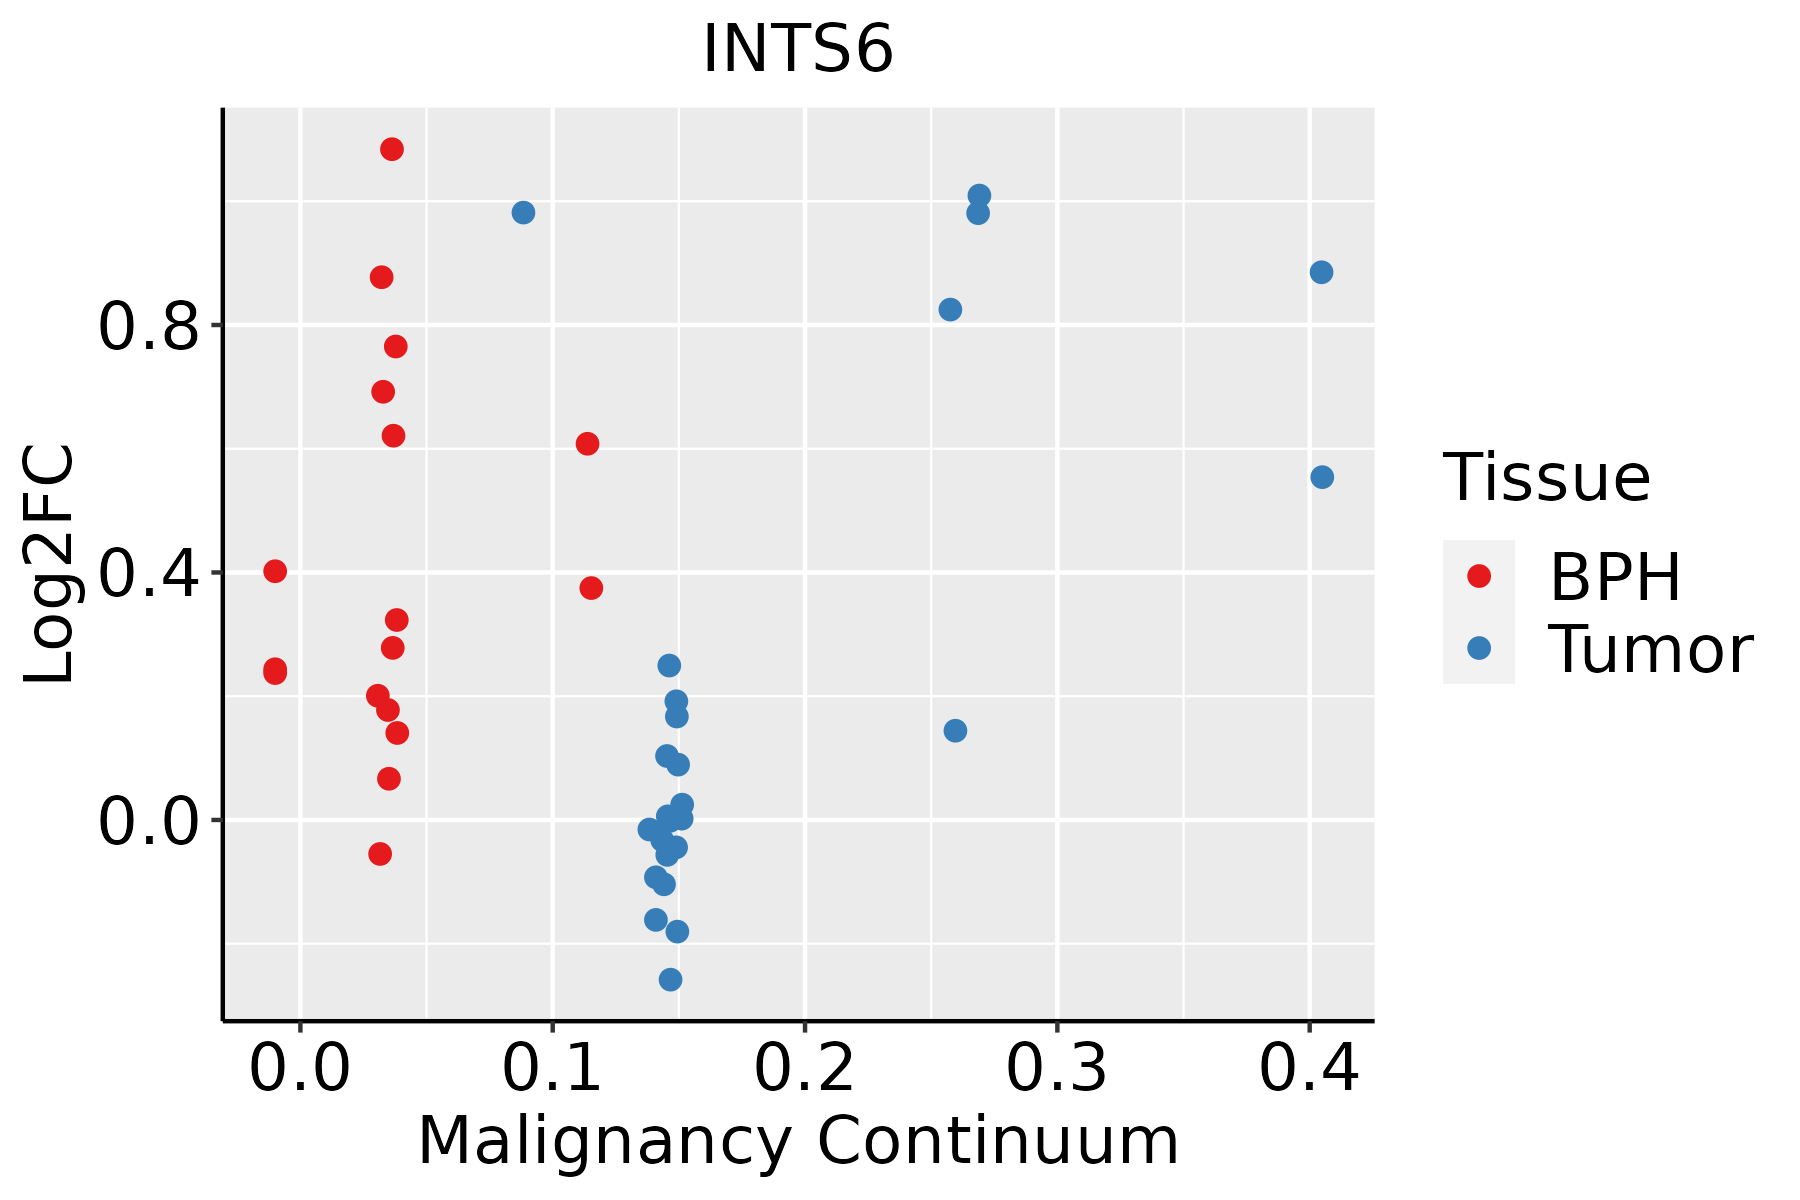 | BPH: Benign Prostatic Hyperplasia |
| Skin | 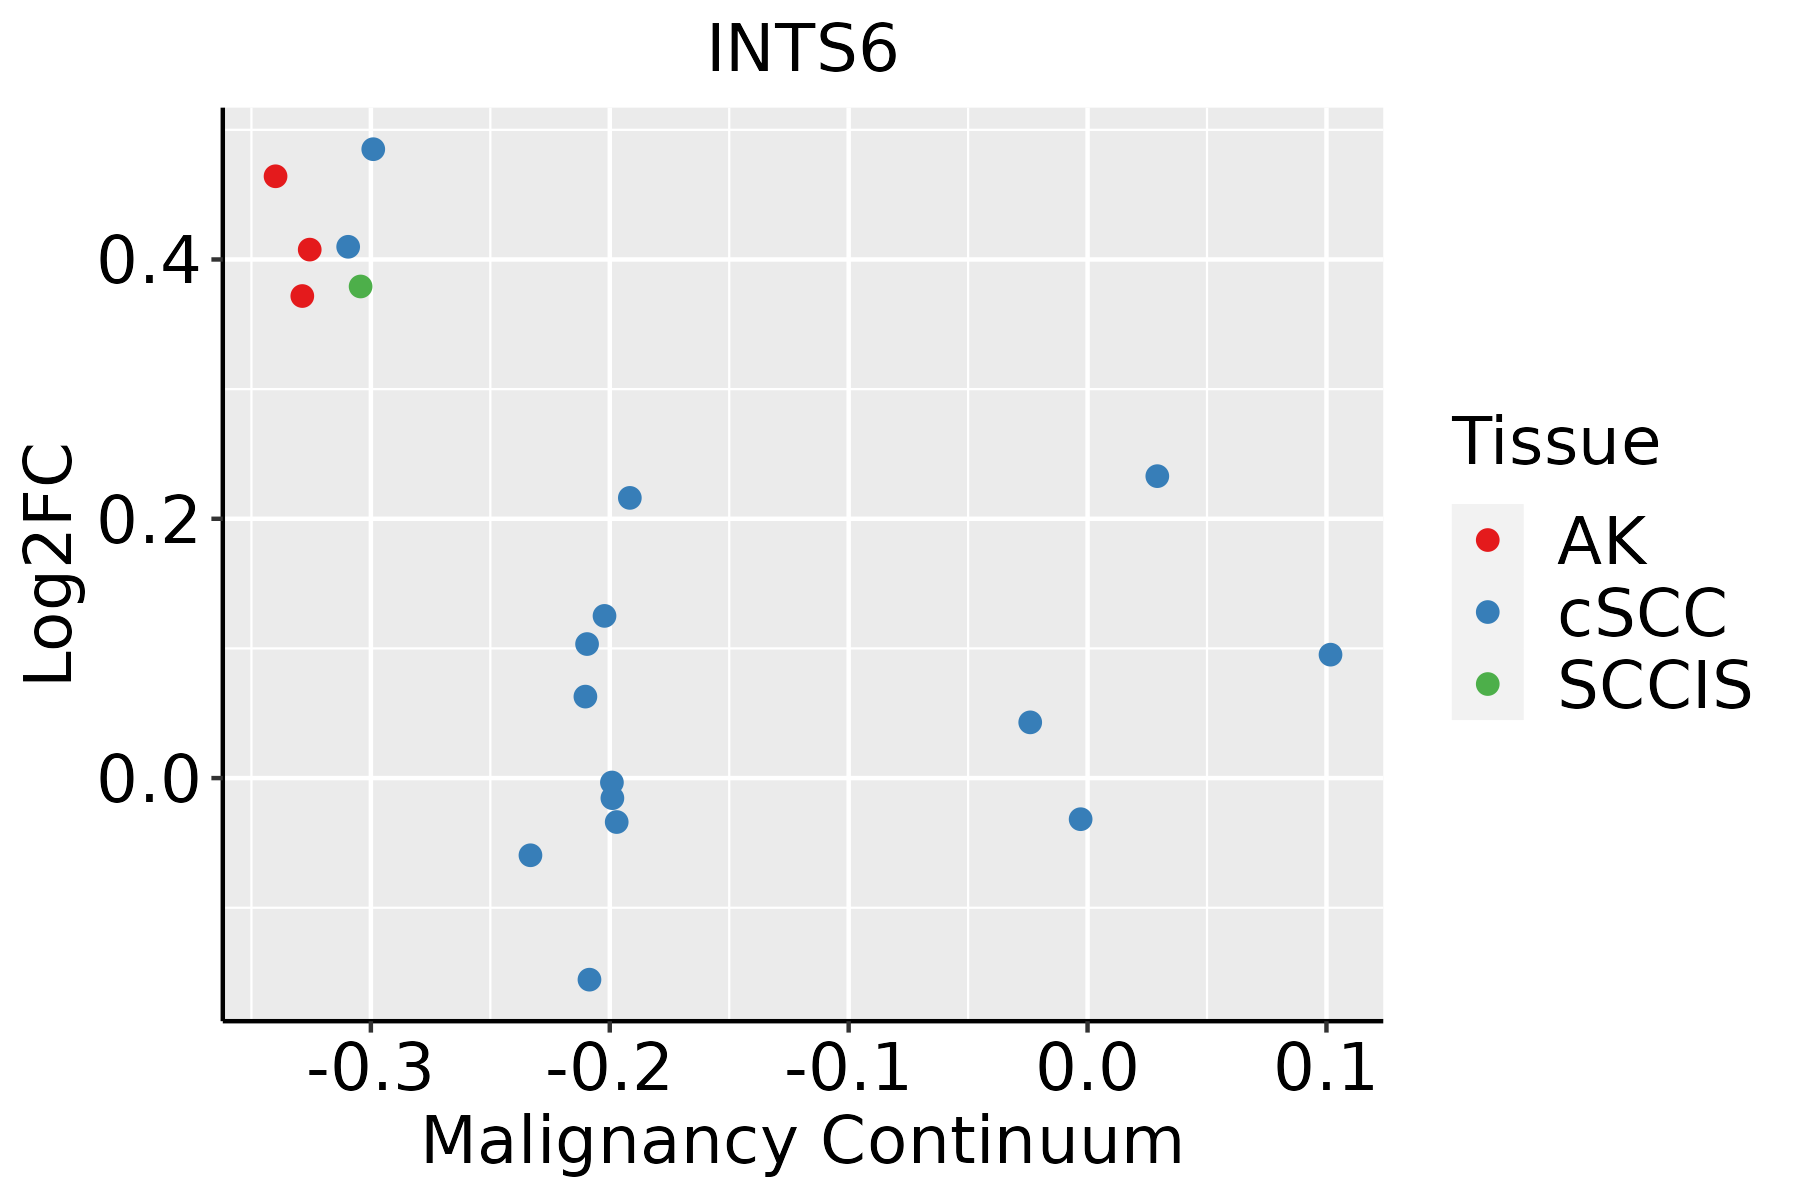 | AK: Actinic keratosis |
| cSCC: Cutaneous squamous cell carcinoma | ||
| SCCIS:squamous cell carcinoma in situ | ||
| Thyroid | 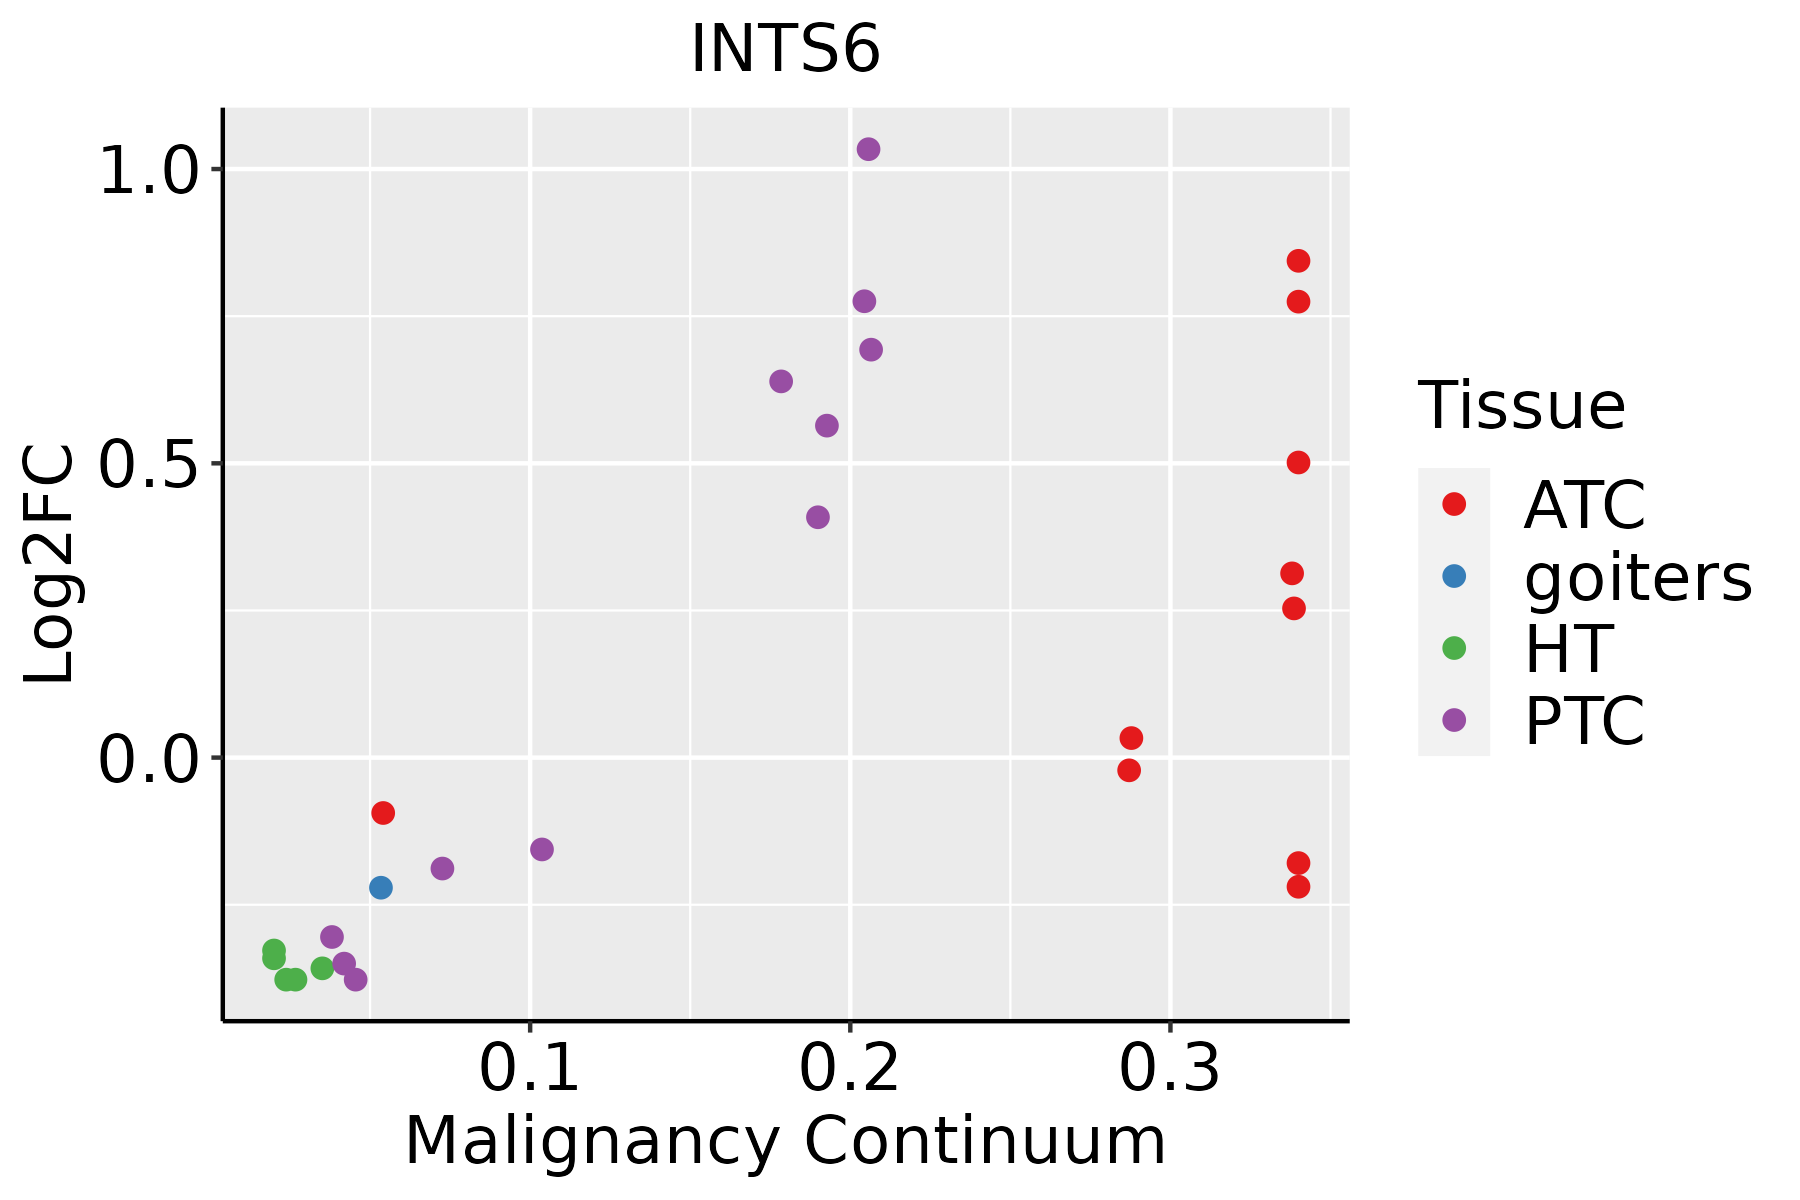 | ATC: Anaplastic thyroid cancer |
| HT: Hashimoto's thyroiditis | ||
| PTC: Papillary thyroid cancer |
| ∗log2FC in expression of this searched gene in stem-like cells from each diseased tissue sample relative to stem-like cells in normal samples in each tissue plotted against the malignancy continuum. Samples are colored based on if they are from different disease stage. |
Top |
Malignant transformation related pathway analysis |
| Find out the enriched GO biological processes and KEGG pathways involved in transition from healthy to precancer to cancer |
| Tissue | Disease Stage | Enriched GO biological Processes |
| Colorectum | AD |  |
| Colorectum | SER |  |
| Colorectum | MSS |  |
| Colorectum | MSI-H |  |
| Colorectum | FAP |  |
| ∗Top 15 enriched GO BP terms are showed in the bar plot of each disease state in each tissue. Each row represents a significant GO biological process which is colored according to the -log10(p.adjust). |
| Page: 1 2 3 4 5 6 7 8 9 |
| GO ID | Tissue | Disease Stage | Description | Gene Ratio | Bg Ratio | pvalue | p.adjust | Count |
| GO:00344707 | Endometrium | AEH | ncRNA processing | 62/2100 | 395/18723 | 3.93e-03 | 2.65e-02 | 62 |
| GO:003447012 | Endometrium | EEC | ncRNA processing | 63/2168 | 395/18723 | 5.20e-03 | 3.26e-02 | 63 |
| GO:003447015 | Esophagus | ESCC | ncRNA processing | 300/8552 | 395/18723 | 3.09e-35 | 3.26e-32 | 300 |
| GO:003466012 | Esophagus | ESCC | ncRNA metabolic process | 346/8552 | 485/18723 | 4.35e-31 | 2.51e-28 | 346 |
| GO:00311233 | Esophagus | ESCC | RNA 3'-end processing | 76/8552 | 116/18723 | 1.25e-05 | 1.15e-04 | 76 |
| GO:00344704 | Liver | NAFLD | ncRNA processing | 57/1882 | 395/18723 | 3.34e-03 | 2.93e-02 | 57 |
| GO:00344701 | Liver | Cirrhotic | ncRNA processing | 158/4634 | 395/18723 | 1.09e-11 | 6.96e-10 | 158 |
| GO:00346603 | Liver | Cirrhotic | ncRNA metabolic process | 173/4634 | 485/18723 | 3.64e-08 | 1.21e-06 | 173 |
| GO:0031123 | Liver | Cirrhotic | RNA 3'-end processing | 42/4634 | 116/18723 | 3.85e-03 | 2.10e-02 | 42 |
| GO:00344702 | Liver | HCC | ncRNA processing | 293/7958 | 395/18723 | 4.26e-38 | 6.76e-35 | 293 |
| GO:00346601 | Liver | HCC | ncRNA metabolic process | 332/7958 | 485/18723 | 1.48e-31 | 7.80e-29 | 332 |
| GO:00311231 | Liver | HCC | RNA 3'-end processing | 81/7958 | 116/18723 | 2.27e-09 | 6.32e-08 | 81 |
| GO:00344703 | Liver | Cyst | ncRNA processing | 25/496 | 395/18723 | 5.78e-05 | 3.01e-03 | 25 |
| GO:00346602 | Liver | Cyst | ncRNA metabolic process | 28/496 | 485/18723 | 1.05e-04 | 4.67e-03 | 28 |
| GO:00344709 | Oral cavity | OSCC | ncRNA processing | 263/7305 | 395/18723 | 4.38e-29 | 2.78e-26 | 263 |
| GO:00346605 | Oral cavity | OSCC | ncRNA metabolic process | 296/7305 | 485/18723 | 2.94e-23 | 6.65e-21 | 296 |
| GO:00311232 | Oral cavity | OSCC | RNA 3'-end processing | 75/7305 | 116/18723 | 1.93e-08 | 3.79e-07 | 75 |
| GO:003447014 | Oral cavity | LP | ncRNA processing | 184/4623 | 395/18723 | 1.20e-21 | 3.12e-19 | 184 |
| GO:003466011 | Oral cavity | LP | ncRNA metabolic process | 205/4623 | 485/18723 | 6.46e-18 | 1.09e-15 | 205 |
| GO:003112311 | Oral cavity | LP | RNA 3'-end processing | 48/4623 | 116/18723 | 5.51e-05 | 7.58e-04 | 48 |
| Page: 1 2 |
| Pathway ID | Tissue | Disease Stage | Description | Gene Ratio | Bg Ratio | pvalue | p.adjust | qvalue | Count |
| Page: 1 |
Top |
Cell-cell communication analysis |
| Identification of potential cell-cell interactions between two cell types and their ligand-receptor pairs for different disease states |
| Ligand | Receptor | LRpair | Pathway | Tissue | Disease Stage |
| Page: 1 |
Top |
Single-cell gene regulatory network inference analysis |
| Find out the significant the regulons (TFs) and the target genes of each regulon across cell types for different disease states |
| TF | Cell Type | Tissue | Disease Stage | Target Gene | RSS | Regulon Activity |
| ∗The dot plots of a searched regulon are shown for all cell subpopulations in each disease state of each tissue based on the regulon specific score inferred using pySCENIC and by calculating the average expression. |
| Page: 1 |
Top |
Somatic mutation of malignant transformation related genes |
| Annotation of somatic variants for genes involved in malignant transformation |
| Hugo Symbol | Variant Class | Variant Classification | dbSNP RS | HGVSc | HGVSp | HGVSp Short | SWISSPROT | BIOTYPE | SIFT | PolyPhen | Tumor Sample Barcode | Tissue | Histology | Sex | Age | Stage | Therapy Types | Drugs | Outcome |
| INTS6 | SNV | Missense_Mutation | novel | c.1481N>T | p.Ser494Leu | p.S494L | Q9UL03 | protein_coding | deleterious(0.01) | probably_damaging(0.947) | TCGA-3C-AALI-01 | Breast | breast invasive carcinoma | Female | <65 | I/II | Unspecific | Poly E | Complete Response |
| INTS6 | SNV | Missense_Mutation | c.164N>C | p.Phe55Ser | p.F55S | Q9UL03 | protein_coding | deleterious(0.05) | benign(0.007) | TCGA-A2-A0CL-01 | Breast | breast invasive carcinoma | Female | <65 | III/IV | Chemotherapy | cytoxan | SD | |
| INTS6 | SNV | Missense_Mutation | c.2059N>G | p.Thr687Ala | p.T687A | Q9UL03 | protein_coding | tolerated(0.53) | benign(0) | TCGA-A2-A0EQ-01 | Breast | breast invasive carcinoma | Female | <65 | I/II | Chemotherapy | adriamycin | SD | |
| INTS6 | SNV | Missense_Mutation | c.1237N>C | p.Glu413Gln | p.E413Q | Q9UL03 | protein_coding | tolerated(0.27) | possibly_damaging(0.809) | TCGA-AC-A23H-01 | Breast | breast invasive carcinoma | Female | >=65 | I/II | Unknown | Unknown | PD | |
| INTS6 | SNV | Missense_Mutation | novel | c.1153N>G | p.Asn385Asp | p.N385D | Q9UL03 | protein_coding | deleterious(0.01) | probably_damaging(0.999) | TCGA-AN-A046-01 | Breast | breast invasive carcinoma | Female | >=65 | I/II | Unknown | Unknown | SD |
| INTS6 | SNV | Missense_Mutation | c.520N>T | p.Arg174Trp | p.R174W | Q9UL03 | protein_coding | deleterious(0) | probably_damaging(1) | TCGA-AN-A046-01 | Breast | breast invasive carcinoma | Female | >=65 | I/II | Unknown | Unknown | SD | |
| INTS6 | SNV | Missense_Mutation | c.1904T>G | p.Val635Gly | p.V635G | Q9UL03 | protein_coding | deleterious(0.01) | possibly_damaging(0.843) | TCGA-AO-A1KR-01 | Breast | breast invasive carcinoma | Female | <65 | I/II | Chemotherapy | cyclophosphamide | SD | |
| INTS6 | SNV | Missense_Mutation | c.902N>A | p.Arg301His | p.R301H | Q9UL03 | protein_coding | deleterious(0.01) | benign(0.433) | TCGA-D8-A1XK-01 | Breast | breast invasive carcinoma | Female | <65 | I/II | Chemotherapy | doxorubicine+cyclophosphamide | SD | |
| INTS6 | SNV | Missense_Mutation | c.1653T>A | p.Asn551Lys | p.N551K | Q9UL03 | protein_coding | tolerated(0.57) | benign(0.206) | TCGA-E2-A1IO-01 | Breast | breast invasive carcinoma | Female | <65 | I/II | Chemotherapy | docetaxel | SD | |
| INTS6 | SNV | Missense_Mutation | c.1903N>C | p.Val635Leu | p.V635L | Q9UL03 | protein_coding | tolerated(0.11) | benign(0.056) | TCGA-E2-A1LH-01 | Breast | breast invasive carcinoma | Female | <65 | I/II | Chemotherapy | adriamycin | SD |
| Page: 1 2 3 4 5 6 7 8 9 |
Top |
Related drugs of malignant transformation related genes |
| Identification of chemicals and drugs interact with genes involved in malignant transfromation |
| (DGIdb 4.0) |
| Entrez ID | Symbol | Category | Interaction Types | Drug Claim Name | Drug Name | PMIDs |
| Page: 1 |

Copyright 2023-Present -The University of Texas Health Science Center at Houston |