Schematic overview of the cellular and molecular mechanisms involved in the cancer progression, including the proposed cellular and molecular mechanisms in cancer cells trajectory. AT1: alveolar type 1 cells; AT2: alveolar type 2 cells; AAH: atypical adenomatous hyperplasia; AIS: adenocarcinoma in situ; MIA: minimally invasive adenocarcinoma; IA: invasive adenocarcinoma; EMT: epithelial-mesenchymal transition

Home

Download

Statistics

Help

Contact

Center for Computational Systems Medicine
leaf

Gene summary

leaf

Malignant transformation analysis

leaf

Malignant transformation related pathway analysis

leaf

Cell-cell communication analysis

leaf

Single-cell gene regulatory network inference analysis

leaf

Somatic mutation of malignant transformation related genes

leaf

Related drugs of malignant transformation related genes

Gene: INTS3

Gene summary for INTS3

check button Gene summary.

Gene informationSpeciesHuman
Gene symbol

INTS3

Gene ID

65123

Gene nameintegrator complex subunit 3
Gene AliasC1orf193
Cytomap1q21.3
Gene Typeprotein-coding
GO ID

GO:0000075

UniProtAcc

Q68E01


Top

Malignant transformation analysis

check button Identification of the aberrant gene expression in precancerous and cancerous lesions by comparing the gene expression of stem-like cells in diseased tissues with normal stem cells
check button Malignant transformation involving gene list.
Entrez IDSymbolReplicatesSpeciesOrganTissueAdj P-valueLog2FCMalignancy
65123INTS3LZE4THumanEsophagusESCC1.37e-041.24e-010.0811
65123INTS3LZE7THumanEsophagusESCC5.57e-033.12e-010.0667
65123INTS3LZE8THumanEsophagusESCC2.72e-021.29e-010.067
65123INTS3LZE24THumanEsophagusESCC2.50e-112.47e-010.0596
65123INTS3P1T-EHumanEsophagusESCC1.55e-064.41e-010.0875
65123INTS3P2T-EHumanEsophagusESCC5.57e-162.44e-010.1177
65123INTS3P4T-EHumanEsophagusESCC7.26e-111.38e-010.1323
65123INTS3P5T-EHumanEsophagusESCC3.42e-153.32e-010.1327
65123INTS3P8T-EHumanEsophagusESCC1.56e-102.33e-010.0889
65123INTS3P9T-EHumanEsophagusESCC1.06e-112.58e-010.1131
65123INTS3P10T-EHumanEsophagusESCC3.71e-153.20e-010.116
65123INTS3P11T-EHumanEsophagusESCC2.47e-021.84e-010.1426
65123INTS3P12T-EHumanEsophagusESCC2.89e-071.33e-010.1122
65123INTS3P15T-EHumanEsophagusESCC2.98e-143.23e-010.1149
65123INTS3P16T-EHumanEsophagusESCC3.43e-112.22e-010.1153
65123INTS3P17T-EHumanEsophagusESCC1.82e-021.68e-010.1278
65123INTS3P20T-EHumanEsophagusESCC4.31e-102.00e-010.1124
65123INTS3P21T-EHumanEsophagusESCC2.94e-132.92e-010.1617
65123INTS3P22T-EHumanEsophagusESCC1.14e-102.26e-010.1236
65123INTS3P23T-EHumanEsophagusESCC3.04e-113.11e-010.108
Page: 1 2 3 4 5 

check button Transcriptomic changes along malignancy continuum.
TissueExpression DynamicsAbbreviation
EsophagusThe image shows the transcriptomic changes along malignancy continuum.log2FC in expression of this searched gene in stem-like cells from each diseased tissue sample relative to stem-like cells in normal samples in each tissue plotted against the malignancy continuum. Samples are colored based on if they are from different disease stage.
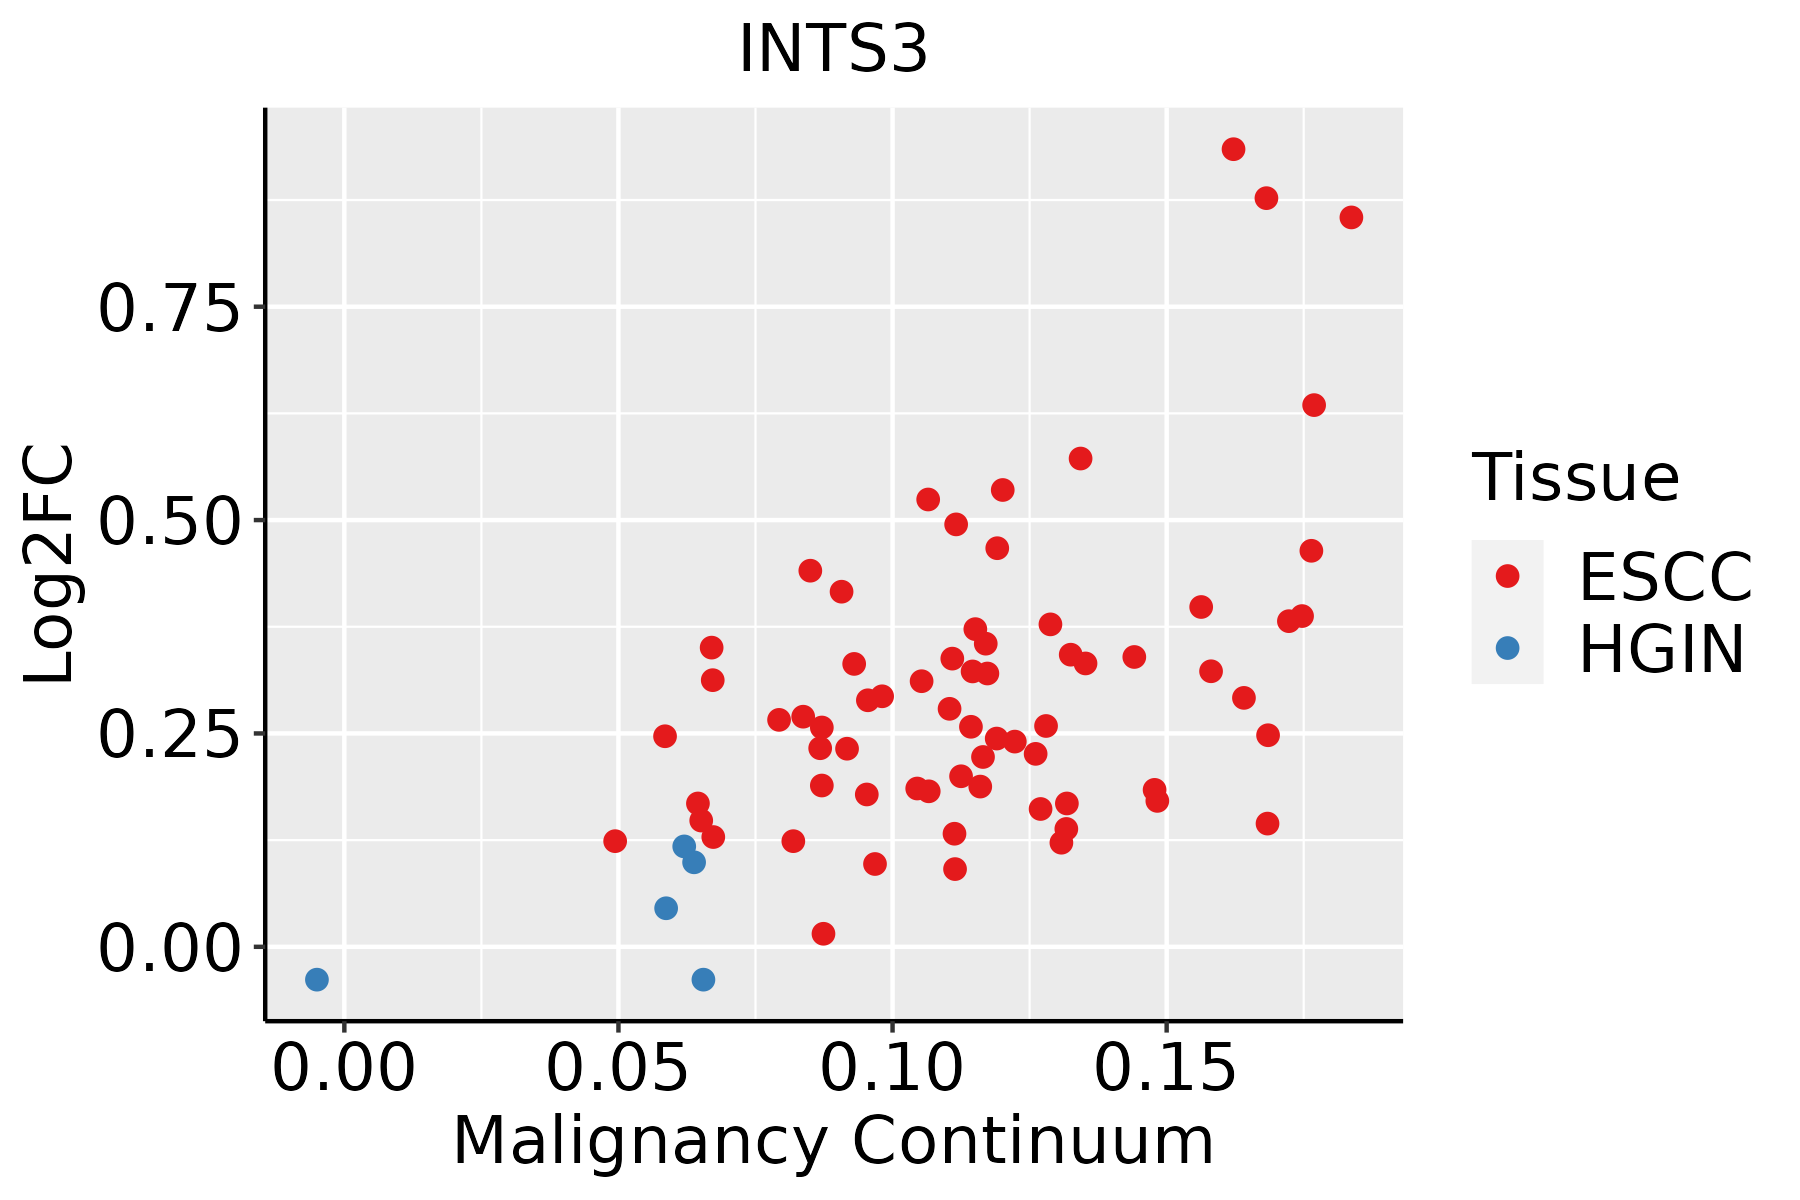
ESCC: Esophageal squamous cell carcinoma
HGIN: High-grade intraepithelial neoplasias
LGIN: Low-grade intraepithelial neoplasias
LiverThe image shows the transcriptomic changes along malignancy continuum.log2FC in expression of this searched gene in stem-like cells from each diseased tissue sample relative to stem-like cells in normal samples in each tissue plotted against the malignancy continuum. Samples are colored based on if they are from different disease stage.HCC: Hepatocellular carcinoma
NAFLD: Non-alcoholic fatty liver disease
Oral CavityThe image shows the transcriptomic changes along malignancy continuum.log2FC in expression of this searched gene in stem-like cells from each diseased tissue sample relative to stem-like cells in normal samples in each tissue plotted against the malignancy continuum. Samples are colored based on if they are from different disease stage.
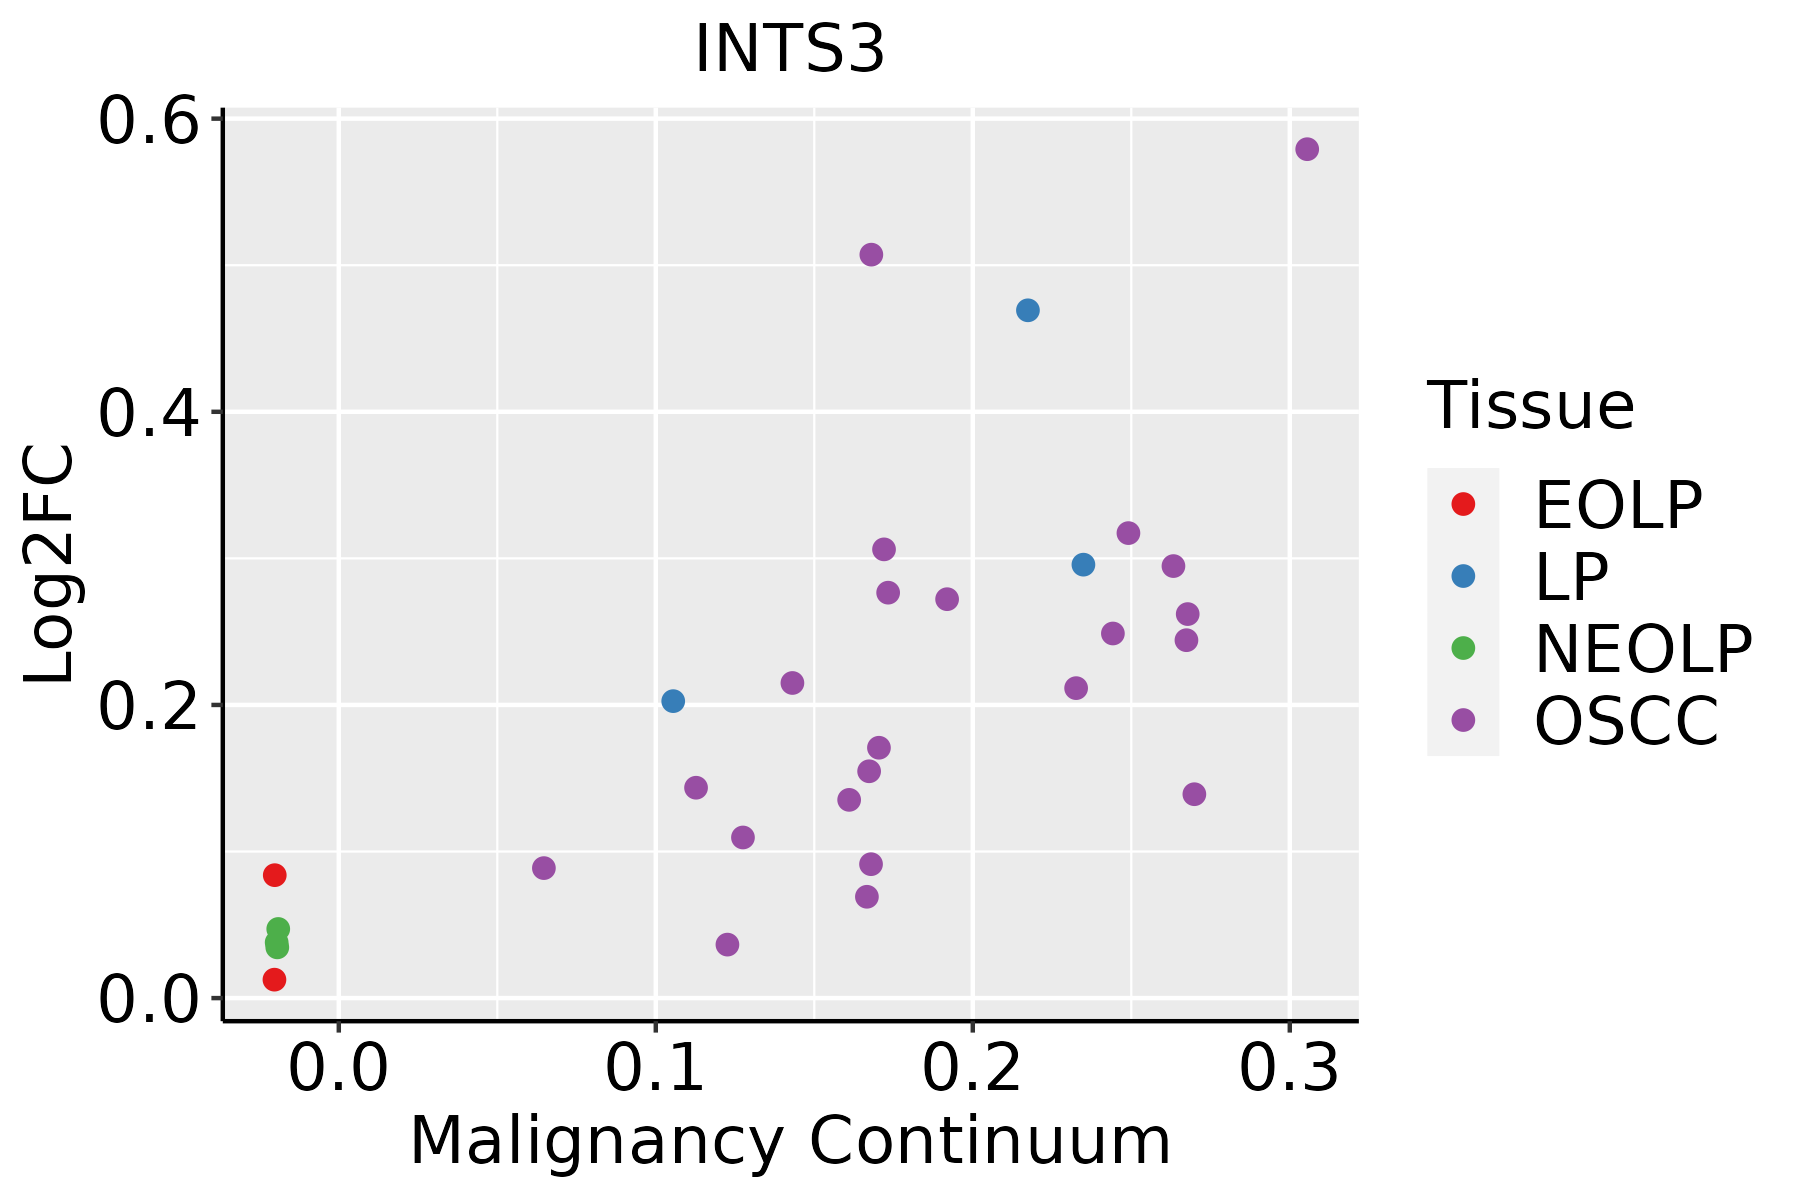
EOLP: Erosive Oral lichen planus
LP: leukoplakia
NEOLP: Non-erosive oral lichen planus
OSCC: Oral squamous cell carcinoma
ThyroidThe image shows the transcriptomic changes along malignancy continuum.log2FC in expression of this searched gene in stem-like cells from each diseased tissue sample relative to stem-like cells in normal samples in each tissue plotted against the malignancy continuum. Samples are colored based on if they are from different disease stage.ATC: Anaplastic thyroid cancer
HT: Hashimoto's thyroiditis
PTC: Papillary thyroid cancer
∗log2FC in expression of this searched gene in stem-like cells from each diseased tissue sample relative to stem-like cells in normal samples in each tissue plotted against the malignancy continuum. Samples are colored based on if they are from different disease stage.

Top

Malignant transformation related pathway analysis

check buttonFind out the enriched GO biological processes and KEGG pathways involved in transition from healthy to precancer to cancer
check button Figure of enriched GO biological processes.
TissueDisease StageEnriched GO biological Processes
ColorectumADGO analysis - Figure of enriched GO biological processes: Top 15 enriched GO BP terms are showed in the bar plot of each disease state in each tissue. Each row represents a significant GO biological process which is colored according to the -log10(p.adjust).
ColorectumSERGO analysis - Figure of enriched GO biological processes: Top 15 enriched GO BP terms are showed in the bar plot of each disease state in each tissue. Each row represents a significant GO biological process which is colored according to the -log10(p.adjust).
ColorectumMSSGO analysis - Figure of enriched GO biological processes: Top 15 enriched GO BP terms are showed in the bar plot of each disease state in each tissue. Each row represents a significant GO biological process which is colored according to the -log10(p.adjust).
ColorectumMSI-HGO analysis - Figure of enriched GO biological processes: Top 15 enriched GO BP terms are showed in the bar plot of each disease state in each tissue. Each row represents a significant GO biological process which is colored according to the -log10(p.adjust).
ColorectumFAPGO analysis - Figure of enriched GO biological processes: Top 15 enriched GO BP terms are showed in the bar plot of each disease state in each tissue. Each row represents a significant GO biological process which is colored according to the -log10(p.adjust).
∗Top 15 enriched GO BP terms are showed in the bar plot of each disease state in each tissue. Each row represents a significant GO biological process which is colored according to the -log10(p.adjust).
Page: 1 2 3 4 5 6 7 8 9 

check button Enriched GO biological processes.
GO IDTissueDisease StageDescriptionGene RatioBg Ratiopvaluep.adjustCount
GO:003447015EsophagusESCCncRNA processing300/8552395/187233.09e-353.26e-32300
GO:003466012EsophagusESCCncRNA metabolic process346/8552485/187234.35e-312.51e-28346
GO:004477216EsophagusESCCmitotic cell cycle phase transition281/8552424/187234.63e-184.45e-16281
GO:000734615EsophagusESCCregulation of mitotic cell cycle293/8552457/187238.00e-165.64e-14293
GO:001021217EsophagusESCCresponse to ionizing radiation110/8552148/187231.11e-124.78e-11110
GO:190198713EsophagusESCCregulation of cell cycle phase transition242/8552390/187233.86e-111.26e-09242
GO:000931419EsophagusESCCresponse to radiation277/8552456/187234.42e-111.43e-09277
GO:190199013EsophagusESCCregulation of mitotic cell cycle phase transition191/8552299/187231.35e-103.94e-09191
GO:00457865EsophagusESCCnegative regulation of cell cycle236/8552385/187233.62e-109.93e-09236
GO:00000754EsophagusESCCcell cycle checkpoint117/8552169/187234.47e-101.17e-08117
GO:00448394EsophagusESCCcell cycle G2/M phase transition103/8552148/187233.09e-096.67e-08103
GO:00000864EsophagusESCCG2/M transition of mitotic cell cycle96/8552137/187236.00e-091.23e-0796
GO:00070934EsophagusESCCmitotic cell cycle checkpoint90/8552129/187232.49e-084.69e-0790
GO:00109484EsophagusESCCnegative regulation of cell cycle process177/8552294/187233.26e-074.59e-06177
GO:19019883EsophagusESCCnegative regulation of cell cycle phase transition151/8552249/187231.28e-061.57e-05151
GO:004593013EsophagusESCCnegative regulation of mitotic cell cycle143/8552235/187231.84e-062.15e-05143
GO:190199113EsophagusESCCnegative regulation of mitotic cell cycle phase transition112/8552179/187233.69e-064.03e-05112
GO:00103891EsophagusESCCregulation of G2/M transition of mitotic cell cycle64/855294/187239.21e-068.82e-0564
GO:19027491EsophagusESCCregulation of cell cycle G2/M phase transition68/8552102/187231.48e-051.33e-0468
GO:00109721EsophagusESCCnegative regulation of G2/M transition of mitotic cell cycle41/855260/187233.25e-041.91e-0341
Page: 1 2 3 4 5 6 

check button Enriched KEGG pathways.
Pathway IDTissueDisease StageDescriptionGene RatioBg Ratiopvaluep.adjustqvalueCount
Page: 1 

Top

Cell-cell communication analysis

check buttonIdentification of potential cell-cell interactions between two cell types and their ligand-receptor pairs for different disease states
LigandReceptorLRpairPathwayTissueDisease Stage
Page: 1 

Top

Single-cell gene regulatory network inference analysis

check buttonFind out the significant the regulons (TFs) and the target genes of each regulon across cell types for different disease states
TFCell TypeTissueDisease StageTarget GeneRSSRegulon Activity
∗The dot plots of a searched regulon are shown for all cell subpopulations in each disease state of each tissue based on the regulon specific score inferred using pySCENIC and by calculating the average expression.
Page: 1 

Top

Somatic mutation of malignant transformation related genes

check buttonAnnotation of somatic variants for genes involved in malignant transformation
Hugo SymbolVariant ClassVariant ClassificationdbSNP RSHGVScHGVSpHGVSp ShortSWISSPROTBIOTYPESIFTPolyPhenTumor Sample BarcodeTissueHistologySexAgeStageTherapy TypesDrugsOutcome
INTS3SNVMissense_Mutationc.1439N>Tp.Lys480Metp.K480MQ68E01protein_codingdeleterious(0)probably_damaging(0.993)TCGA-AO-A0J6-01Breastbreast invasive carcinomaFemale<65I/IIChemotherapydoxorubicinSD
INTS3SNVMissense_Mutationc.2131N>Cp.Ala711Prop.A711PQ68E01protein_codingdeleterious(0.02)probably_damaging(0.991)TCGA-B6-A0RE-01Breastbreast invasive carcinomaFemale<65I/IIUnknownUnknownSD
INTS3SNVMissense_Mutationnovelc.2857N>Tp.His953Tyrp.H953YQ68E01protein_codingtolerated(0.93)possibly_damaging(0.888)TCGA-BH-A0AY-01Breastbreast invasive carcinomaFemale<65I/IIChemotherapySD
INTS3SNVMissense_Mutationnovelc.1044C>Gp.Asp348Glup.D348EQ68E01protein_codingdeleterious(0)probably_damaging(0.978)TCGA-BH-A8FZ-01Breastbreast invasive carcinomaFemale<65I/IIUnknownUnknownSD
INTS3SNVMissense_Mutationc.1870N>Ap.Glu624Lysp.E624KQ68E01protein_codingtolerated(0.37)probably_damaging(0.953)TCGA-D8-A147-01Breastbreast invasive carcinomaFemale<65I/IIChemotherapydoxorubicineSD
INTS3SNVMissense_Mutationc.2011N>Gp.Leu671Valp.L671VQ68E01protein_codingtolerated(0.96)benign(0)TCGA-D8-A147-01Breastbreast invasive carcinomaFemale<65I/IIChemotherapydoxorubicineSD
INTS3SNVMissense_Mutationnovelc.928G>Cp.Glu310Glnp.E310QQ68E01protein_codingdeleterious(0.02)probably_damaging(0.986)TCGA-LL-A73Y-01Breastbreast invasive carcinomaFemale>=65I/IIChemotherapytaxotereSD
INTS3insertionIn_Frame_Insnovelc.1516_1516+1insATTp.Val506delinsAspPhep.V506delinsDFQ68E01protein_codingTCGA-A8-A07R-01Breastbreast invasive carcinomaFemale>=65III/IVAncillaryzoledronicSD
INTS3insertionFrame_Shift_Insnovelc.1359_1360insTCCTTGGAATGTGCTGATTCAGATATGACAAp.Gln454SerfsTer34p.Q454Sfs*34Q68E01protein_codingTCGA-BH-A0DP-01Breastbreast invasive carcinomaFemale<65I/IIHormone TherapyarimidexSD
INTS3insertionNonsense_Mutationnovelc.311_312insTTAAAGAAATCAGGTCACCTGTTTATGGTTTCCACATTTTAGATTTTGp.Ala104_Gln105insTerp.A104_Q105ins*Q68E01protein_codingTCGA-BH-A0HK-01Breastbreast invasive carcinomaFemale>=65I/IIHormone TherapyarimidexSD
Page: 1 2 3 4 5 6 7 8 9 10 11 12 

Top

Related drugs of malignant transformation related genes

check buttonIdentification of chemicals and drugs interact with genes involved in malignant transfromation
(DGIdb 4.0)
Entrez IDSymbolCategoryInteraction TypesDrug Claim NameDrug NamePMIDs
Page: 1