
|
|||||
|
 | |
| |
| |
| |
| |
| |
|
Gene: INTS14 |
Gene summary for INTS14 |
| Gene information | Species | Human | Gene symbol | INTS14 | Gene ID | 81556 |
| Gene name | integrator complex subunit 14 | |
| Gene Alias | C15orf44 | |
| Cytomap | 15q22.31 | |
| Gene Type | protein-coding | GO ID | GO:0006139 | UniProtAcc | Q96SY0 |
Top |
Malignant transformation analysis |
| Identification of the aberrant gene expression in precancerous and cancerous lesions by comparing the gene expression of stem-like cells in diseased tissues with normal stem cells |
| Entrez ID | Symbol | Replicates | Species | Organ | Tissue | Adj P-value | Log2FC | Malignancy |
| 81556 | INTS14 | S014 | Human | Liver | HCC | 2.69e-09 | 3.75e-01 | 0.2254 |
| 81556 | INTS14 | S015 | Human | Liver | HCC | 1.07e-13 | 5.37e-01 | 0.2375 |
| 81556 | INTS14 | S016 | Human | Liver | HCC | 1.11e-15 | 4.50e-01 | 0.2243 |
| 81556 | INTS14 | S027 | Human | Liver | HCC | 8.40e-09 | 5.52e-01 | 0.2446 |
| 81556 | INTS14 | S028 | Human | Liver | HCC | 2.21e-26 | 7.23e-01 | 0.2503 |
| 81556 | INTS14 | S029 | Human | Liver | HCC | 1.01e-17 | 6.44e-01 | 0.2581 |
| Page: 1 |
| Tissue | Expression Dynamics | Abbreviation |
| Liver | 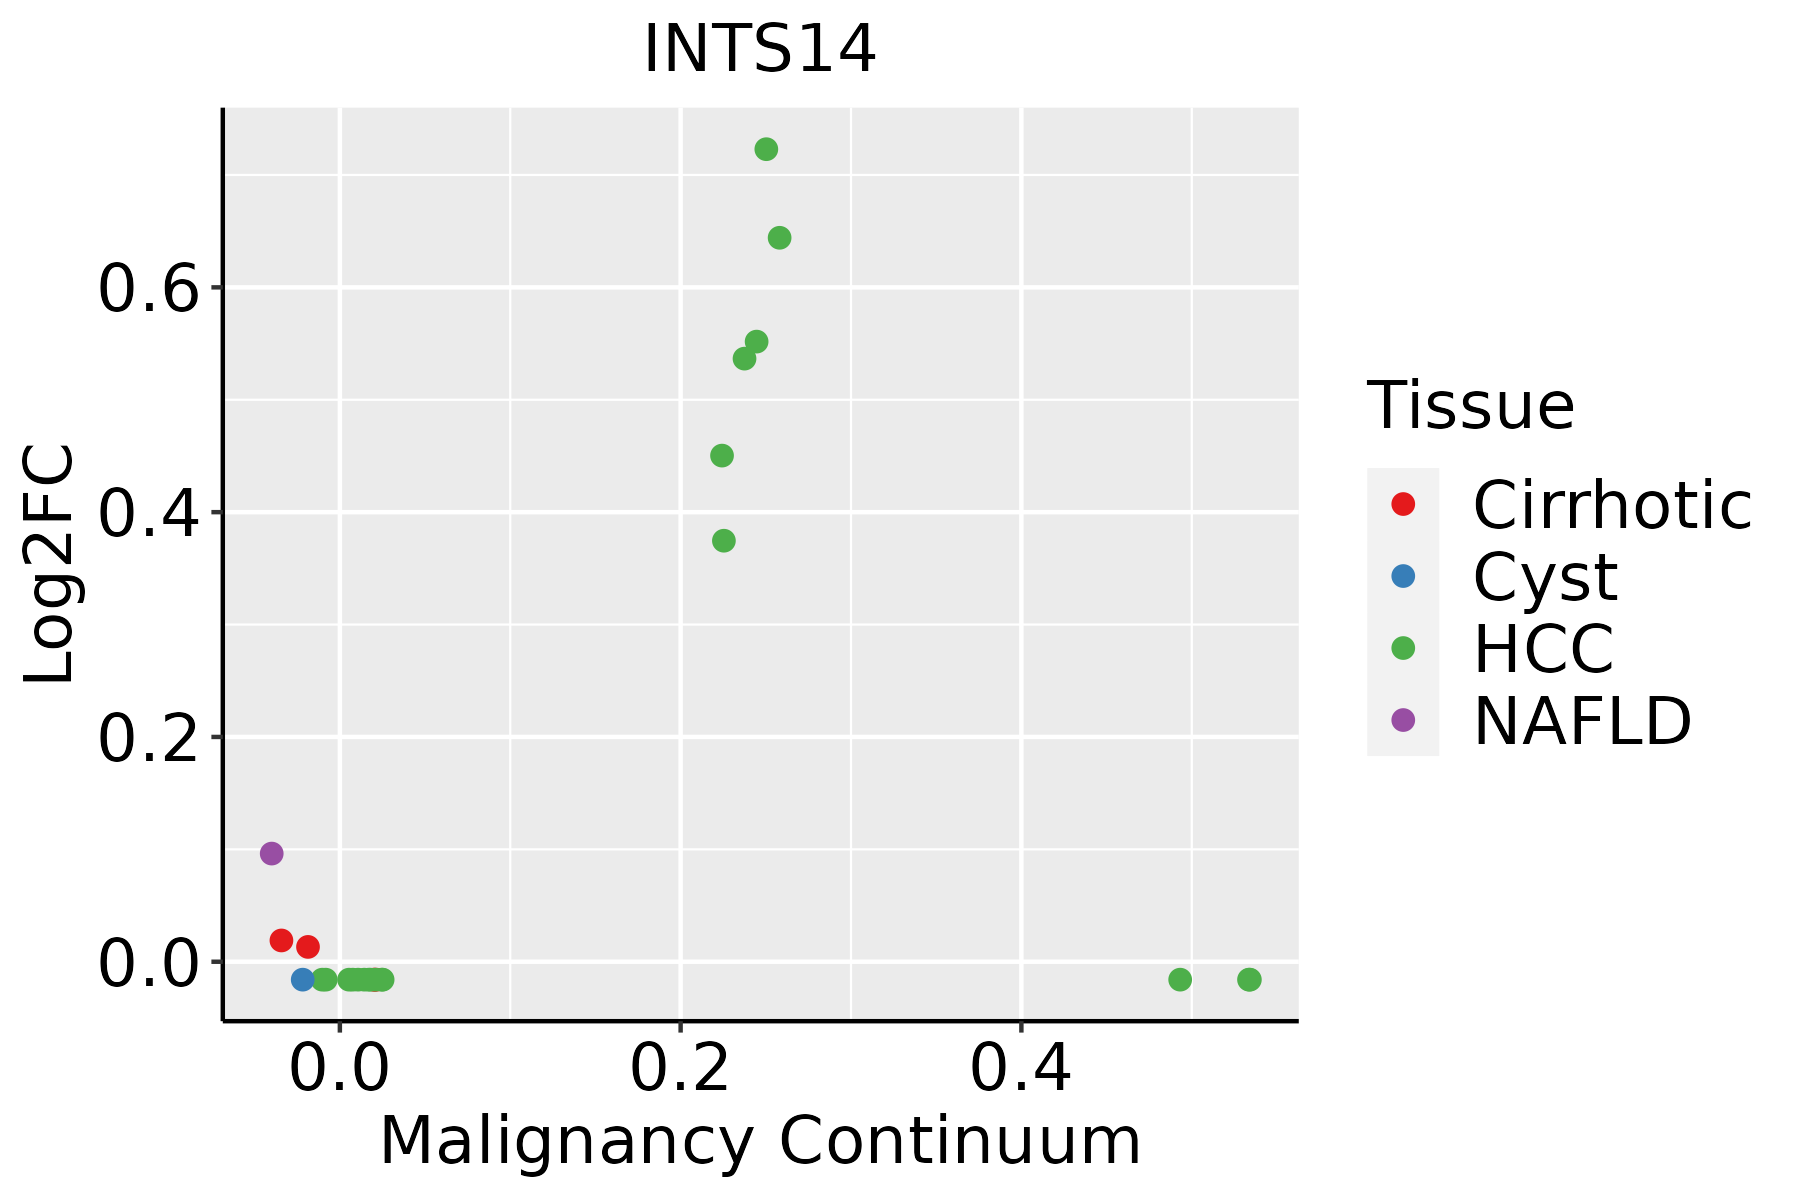 | HCC: Hepatocellular carcinoma |
| NAFLD: Non-alcoholic fatty liver disease |
| ∗log2FC in expression of this searched gene in stem-like cells from each diseased tissue sample relative to stem-like cells in normal samples in each tissue plotted against the malignancy continuum. Samples are colored based on if they are from different disease stage. |
Top |
Malignant transformation related pathway analysis |
| Find out the enriched GO biological processes and KEGG pathways involved in transition from healthy to precancer to cancer |
| Tissue | Disease Stage | Enriched GO biological Processes |
| Colorectum | AD |  |
| Colorectum | SER |  |
| Colorectum | MSS |  |
| Colorectum | MSI-H |  |
| Colorectum | FAP |  |
| ∗Top 15 enriched GO BP terms are showed in the bar plot of each disease state in each tissue. Each row represents a significant GO biological process which is colored according to the -log10(p.adjust). |
| Page: 1 2 3 4 5 6 7 8 9 |
| GO ID | Tissue | Disease Stage | Description | Gene Ratio | Bg Ratio | pvalue | p.adjust | Count |
| GO:00344702 | Liver | HCC | ncRNA processing | 293/7958 | 395/18723 | 4.26e-38 | 6.76e-35 | 293 |
| GO:00346601 | Liver | HCC | ncRNA metabolic process | 332/7958 | 485/18723 | 1.48e-31 | 7.80e-29 | 332 |
| GO:00311231 | Liver | HCC | RNA 3'-end processing | 81/7958 | 116/18723 | 2.27e-09 | 6.32e-08 | 81 |
| Page: 1 |
| Pathway ID | Tissue | Disease Stage | Description | Gene Ratio | Bg Ratio | pvalue | p.adjust | qvalue | Count |
| Page: 1 |
Top |
Cell-cell communication analysis |
| Identification of potential cell-cell interactions between two cell types and their ligand-receptor pairs for different disease states |
| Ligand | Receptor | LRpair | Pathway | Tissue | Disease Stage |
| Page: 1 |
Top |
Single-cell gene regulatory network inference analysis |
| Find out the significant the regulons (TFs) and the target genes of each regulon across cell types for different disease states |
| TF | Cell Type | Tissue | Disease Stage | Target Gene | RSS | Regulon Activity |
| ∗The dot plots of a searched regulon are shown for all cell subpopulations in each disease state of each tissue based on the regulon specific score inferred using pySCENIC and by calculating the average expression. |
| Page: 1 |
Top |
Somatic mutation of malignant transformation related genes |
| Annotation of somatic variants for genes involved in malignant transformation |
| Hugo Symbol | Variant Class | Variant Classification | dbSNP RS | HGVSc | HGVSp | HGVSp Short | SWISSPROT | BIOTYPE | SIFT | PolyPhen | Tumor Sample Barcode | Tissue | Histology | Sex | Age | Stage | Therapy Types | Drugs | Outcome |
| INTS14 | SNV | Missense_Mutation | c.1332N>C | p.Gln444His | p.Q444H | Q96SY0 | protein_coding | tolerated(0.83) | benign(0) | TCGA-A2-A0D4-01 | Breast | breast invasive carcinoma | Female | <65 | I/II | Chemotherapy | adriamycin | SD | |
| INTS14 | SNV | Missense_Mutation | c.676G>A | p.Asp226Asn | p.D226N | Q96SY0 | protein_coding | tolerated(0.19) | benign(0.325) | TCGA-AC-A23H-01 | Breast | breast invasive carcinoma | Female | >=65 | I/II | Unknown | Unknown | PD | |
| INTS14 | SNV | Missense_Mutation | c.1091N>C | p.Arg364Thr | p.R364T | Q96SY0 | protein_coding | deleterious(0) | probably_damaging(0.994) | TCGA-AO-A128-01 | Breast | breast invasive carcinoma | Female | <65 | I/II | Chemotherapy | doxorubicin | SD | |
| INTS14 | SNV | Missense_Mutation | c.830G>A | p.Gly277Glu | p.G277E | Q96SY0 | protein_coding | deleterious(0) | probably_damaging(0.999) | TCGA-AQ-A0Y5-01 | Breast | breast invasive carcinoma | Female | >=65 | III/IV | Chemotherapy | cytoxan | SD | |
| INTS14 | insertion | Frame_Shift_Ins | novel | c.1091_1092insTAACTCA | p.Arg364SerfsTer10 | p.R364Sfs*10 | Q96SY0 | protein_coding | TCGA-AO-A128-01 | Breast | breast invasive carcinoma | Female | <65 | I/II | Chemotherapy | doxorubicin | SD | ||
| INTS14 | SNV | Missense_Mutation | novel | c.73G>T | p.Asp25Tyr | p.D25Y | Q96SY0 | protein_coding | tolerated(1) | probably_damaging(0.997) | TCGA-AA-3854-01 | Colorectum | colon adenocarcinoma | Female | >=65 | I/II | Unknown | Unknown | SD |
| INTS14 | SNV | Missense_Mutation | novel | c.359N>G | p.Asp120Gly | p.D120G | Q96SY0 | protein_coding | deleterious(0.02) | benign(0.037) | TCGA-F5-6814-01 | Colorectum | rectum adenocarcinoma | Male | <65 | I/II | Unknown | Unknown | SD |
| INTS14 | SNV | Missense_Mutation | novel | c.1128N>A | p.Phe376Leu | p.F376L | Q96SY0 | protein_coding | tolerated(0.08) | benign(0.019) | TCGA-A5-A0G2-01 | Endometrium | uterine corpus endometrioid carcinoma | Female | <65 | III/IV | Unknown | Unknown | SD |
| INTS14 | SNV | Missense_Mutation | novel | c.346G>C | p.Glu116Gln | p.E116Q | Q96SY0 | protein_coding | tolerated(1) | benign(0.005) | TCGA-A5-A1OH-01 | Endometrium | uterine corpus endometrioid carcinoma | Female | >=65 | III/IV | Chemotherapy | carboplatin | CR |
| INTS14 | SNV | Missense_Mutation | novel | c.1361N>A | p.Ser454Tyr | p.S454Y | Q96SY0 | protein_coding | deleterious(0) | possibly_damaging(0.447) | TCGA-AJ-A3EK-01 | Endometrium | uterine corpus endometrioid carcinoma | Female | <65 | I/II | Chemotherapy | carboplatin | CR |
| Page: 1 2 3 4 |
Top |
Related drugs of malignant transformation related genes |
| Identification of chemicals and drugs interact with genes involved in malignant transfromation |
| (DGIdb 4.0) |
| Entrez ID | Symbol | Category | Interaction Types | Drug Claim Name | Drug Name | PMIDs |
| Page: 1 |

Copyright 2023-Present -The University of Texas Health Science Center at Houston |