
|
|||||
|
 | |
| |
| |
| |
| |
| |
|
Gene: INTS11 |
Gene summary for INTS11 |
| Gene information | Species | Human | Gene symbol | INTS11 | Gene ID | 54973 |
| Gene name | integrator complex subunit 11 | |
| Gene Alias | CPSF3L | |
| Cytomap | 1p36.33 | |
| Gene Type | protein-coding | GO ID | GO:0006139 | UniProtAcc | Q5TA45 |
Top |
Malignant transformation analysis |
| Identification of the aberrant gene expression in precancerous and cancerous lesions by comparing the gene expression of stem-like cells in diseased tissues with normal stem cells |
| Entrez ID | Symbol | Replicates | Species | Organ | Tissue | Adj P-value | Log2FC | Malignancy |
| 54973 | INTS11 | LZE2T | Human | Esophagus | ESCC | 1.52e-08 | 6.52e-01 | 0.082 |
| 54973 | INTS11 | LZE4T | Human | Esophagus | ESCC | 1.20e-26 | 5.85e-01 | 0.0811 |
| 54973 | INTS11 | LZE5T | Human | Esophagus | ESCC | 1.40e-06 | 4.66e-01 | 0.0514 |
| 54973 | INTS11 | LZE7T | Human | Esophagus | ESCC | 1.21e-26 | 8.57e-01 | 0.0667 |
| 54973 | INTS11 | LZE8T | Human | Esophagus | ESCC | 1.78e-21 | 5.51e-01 | 0.067 |
| 54973 | INTS11 | LZE20T | Human | Esophagus | ESCC | 3.87e-19 | 4.55e-01 | 0.0662 |
| 54973 | INTS11 | LZE21D1 | Human | Esophagus | HGIN | 1.52e-08 | 5.43e-01 | 0.0632 |
| 54973 | INTS11 | LZE22D1 | Human | Esophagus | HGIN | 4.30e-07 | 3.26e-01 | 0.0595 |
| 54973 | INTS11 | LZE22T | Human | Esophagus | ESCC | 6.95e-12 | 5.38e-01 | 0.068 |
| 54973 | INTS11 | LZE24T | Human | Esophagus | ESCC | 7.47e-51 | 9.96e-01 | 0.0596 |
| 54973 | INTS11 | LZE21T | Human | Esophagus | ESCC | 1.16e-05 | 3.87e-01 | 0.0655 |
| 54973 | INTS11 | LZE6T | Human | Esophagus | ESCC | 1.07e-15 | 5.29e-01 | 0.0845 |
| 54973 | INTS11 | S014 | Human | Liver | HCC | 1.72e-41 | 1.25e+00 | 0.2254 |
| 54973 | INTS11 | S015 | Human | Liver | HCC | 9.96e-41 | 1.35e+00 | 0.2375 |
| 54973 | INTS11 | S016 | Human | Liver | HCC | 2.99e-46 | 1.23e+00 | 0.2243 |
| 54973 | INTS11 | S027 | Human | Liver | HCC | 5.85e-14 | 9.03e-01 | 0.2446 |
| 54973 | INTS11 | S028 | Human | Liver | HCC | 1.76e-38 | 1.19e+00 | 0.2503 |
| 54973 | INTS11 | S029 | Human | Liver | HCC | 5.88e-32 | 1.31e+00 | 0.2581 |
| 54973 | INTS11 | male-WTA | Human | Thyroid | PTC | 2.12e-13 | 1.66e-01 | 0.1037 |
| 54973 | INTS11 | PTC01 | Human | Thyroid | PTC | 2.34e-18 | 3.63e-01 | 0.1899 |
| Page: 1 2 |
| Tissue | Expression Dynamics | Abbreviation |
| Esophagus |  | ESCC: Esophageal squamous cell carcinoma |
| HGIN: High-grade intraepithelial neoplasias | ||
| LGIN: Low-grade intraepithelial neoplasias | ||
| Liver | 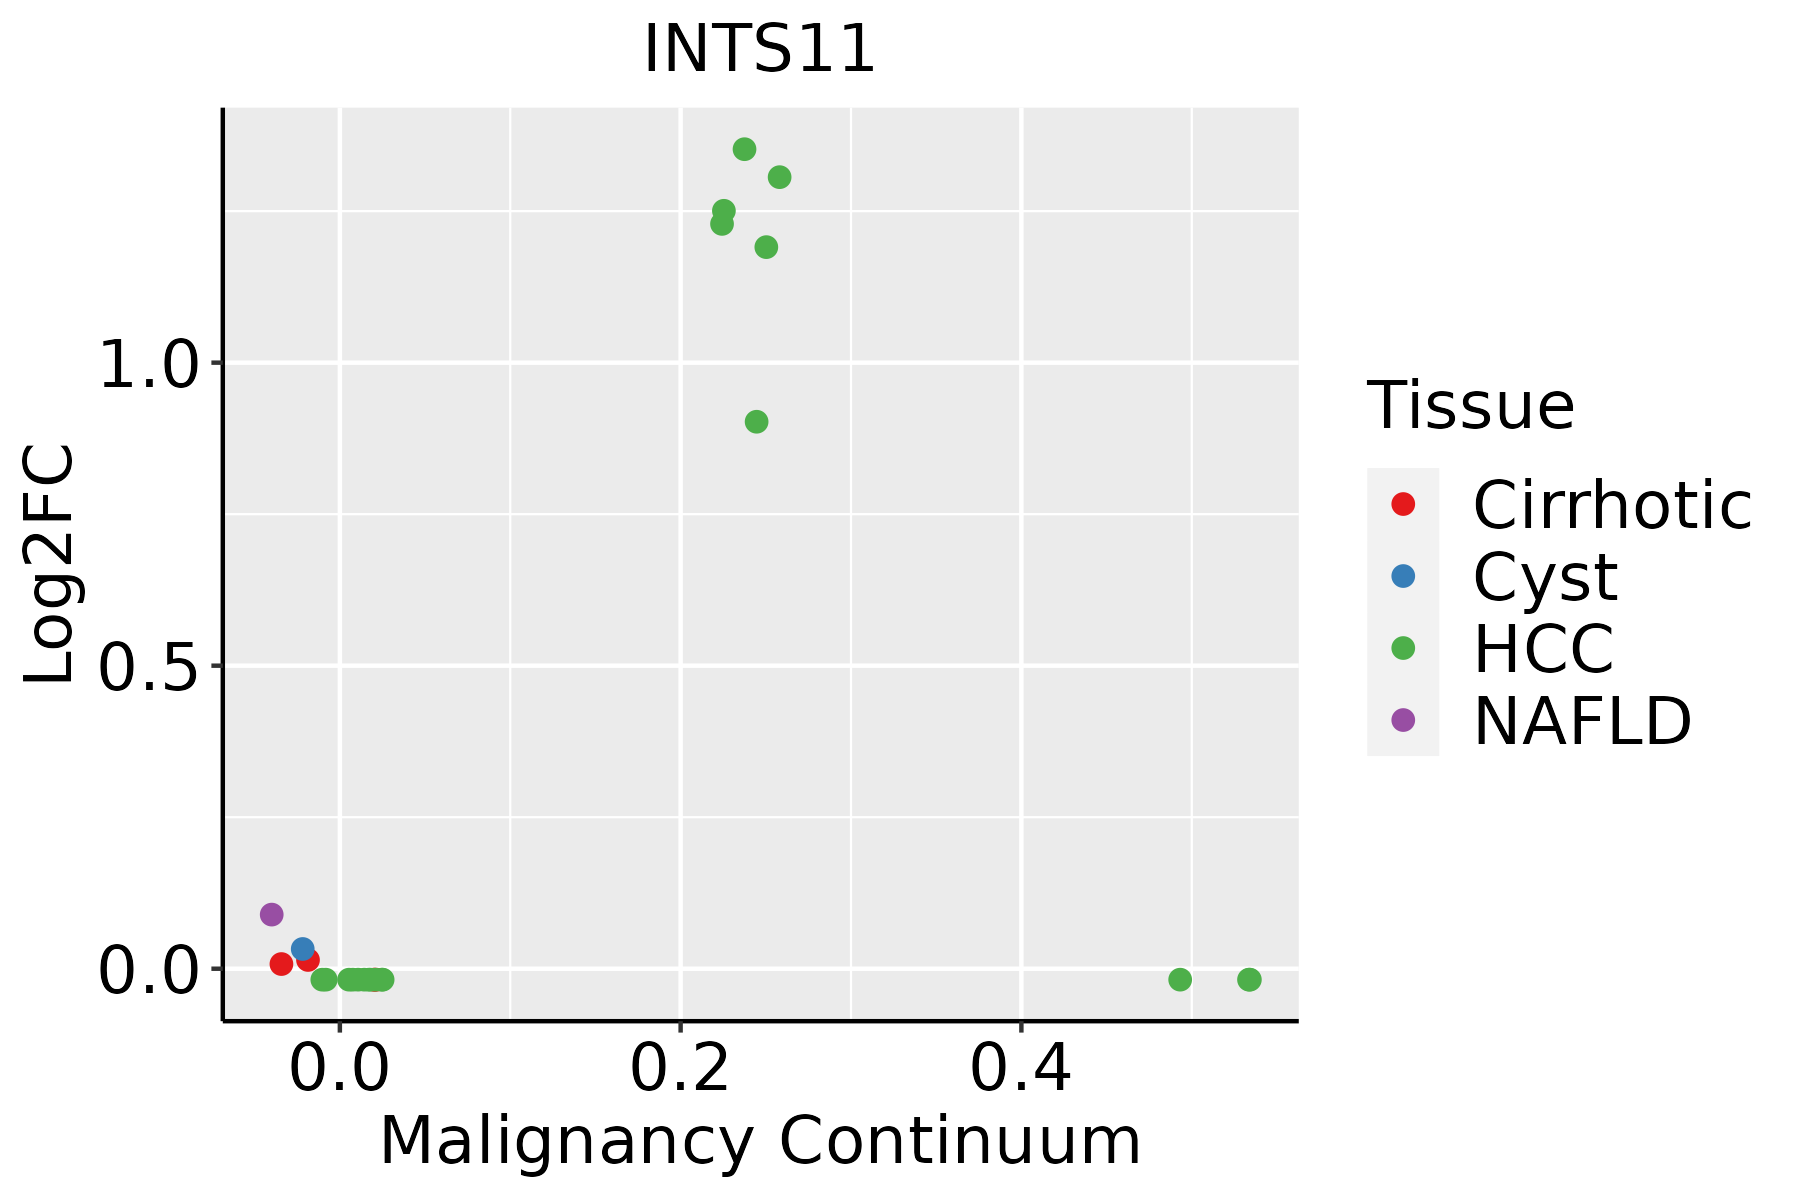 | HCC: Hepatocellular carcinoma |
| NAFLD: Non-alcoholic fatty liver disease | ||
| Thyroid | 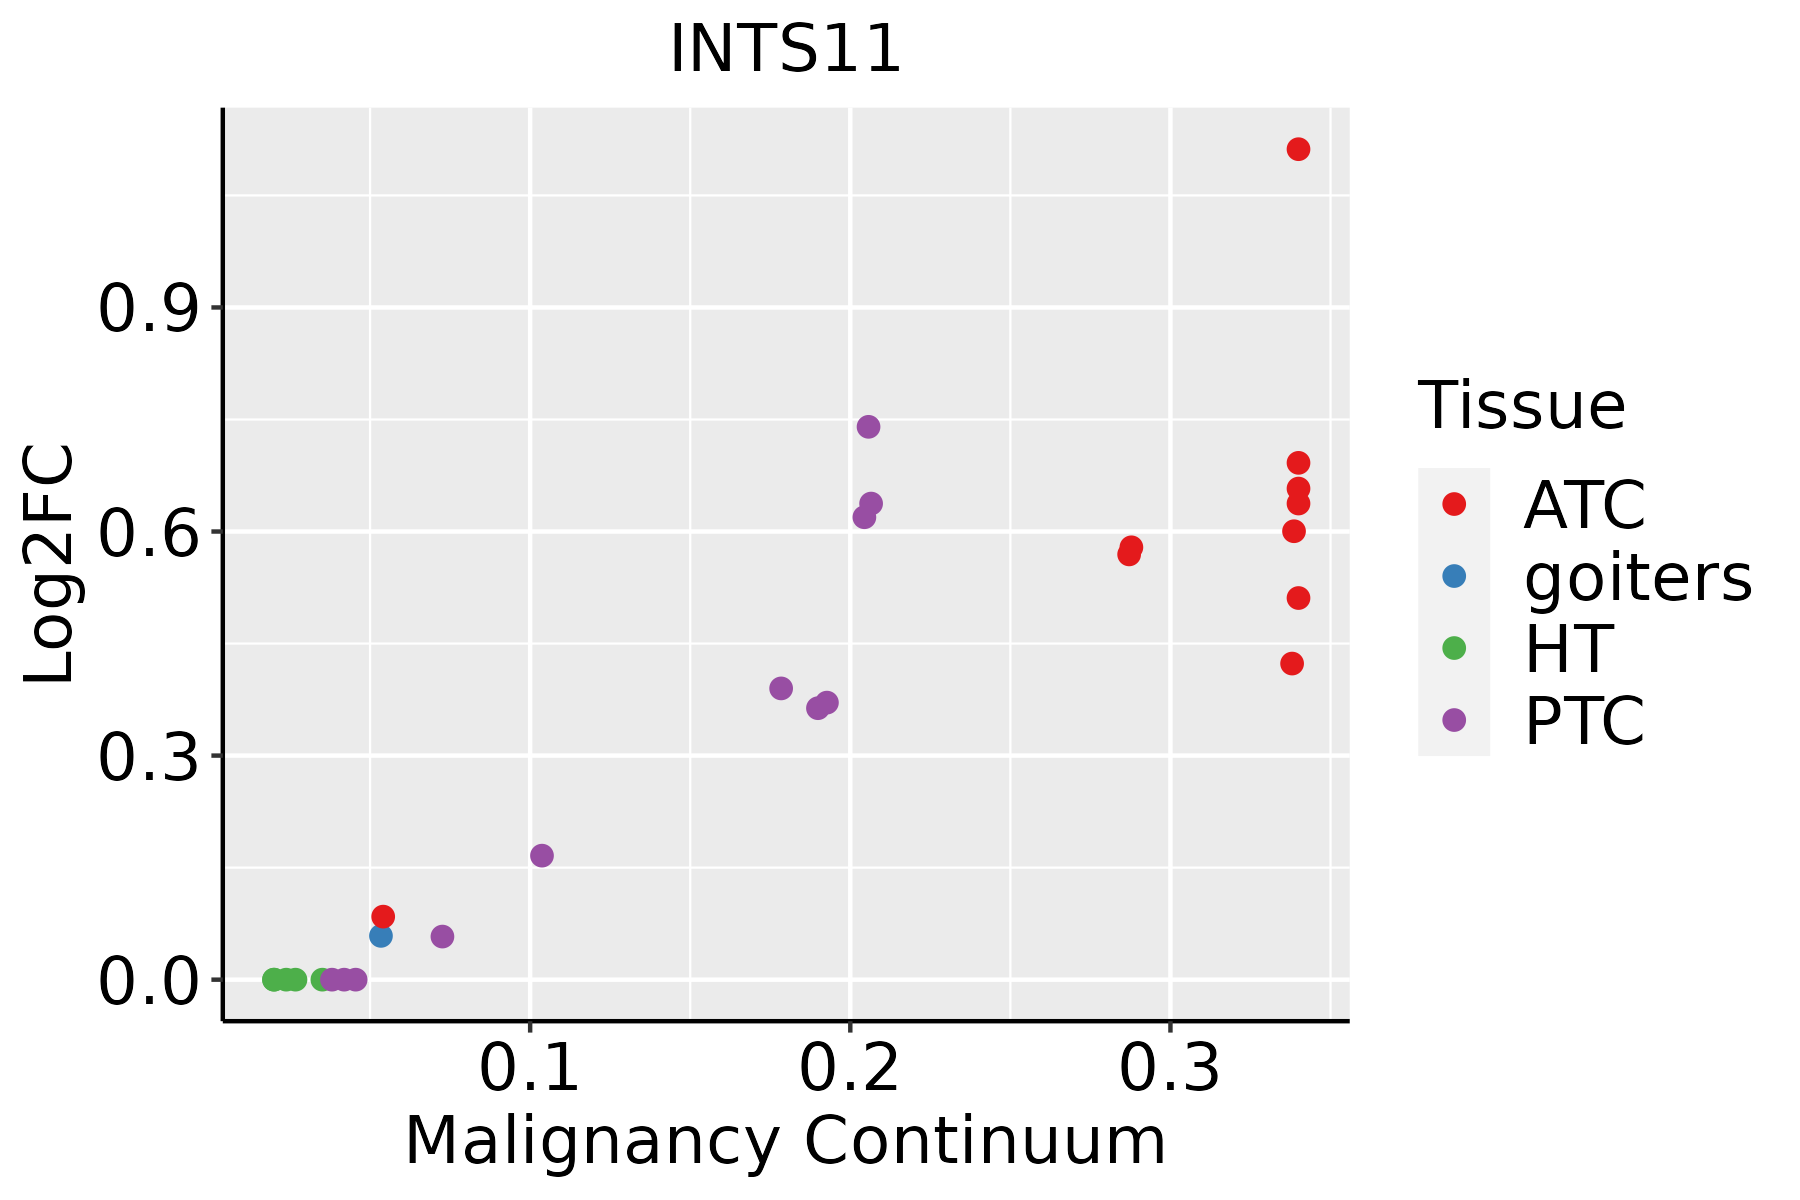 | ATC: Anaplastic thyroid cancer |
| HT: Hashimoto's thyroiditis | ||
| PTC: Papillary thyroid cancer |
| ∗log2FC in expression of this searched gene in stem-like cells from each diseased tissue sample relative to stem-like cells in normal samples in each tissue plotted against the malignancy continuum. Samples are colored based on if they are from different disease stage. |
Top |
Malignant transformation related pathway analysis |
| Find out the enriched GO biological processes and KEGG pathways involved in transition from healthy to precancer to cancer |
| Tissue | Disease Stage | Enriched GO biological Processes |
| Colorectum | AD |  |
| Colorectum | SER |  |
| Colorectum | MSS |  |
| Colorectum | MSI-H |  |
| Colorectum | FAP |  |
| ∗Top 15 enriched GO BP terms are showed in the bar plot of each disease state in each tissue. Each row represents a significant GO biological process which is colored according to the -log10(p.adjust). |
| Page: 1 2 3 4 5 6 7 8 9 |
| GO ID | Tissue | Disease Stage | Description | Gene Ratio | Bg Ratio | pvalue | p.adjust | Count |
| GO:003447010 | Esophagus | HGIN | ncRNA processing | 97/2587 | 395/18723 | 5.92e-09 | 3.90e-07 | 97 |
| GO:00346606 | Esophagus | HGIN | ncRNA metabolic process | 104/2587 | 485/18723 | 2.26e-06 | 8.23e-05 | 104 |
| GO:003447015 | Esophagus | ESCC | ncRNA processing | 300/8552 | 395/18723 | 3.09e-35 | 3.26e-32 | 300 |
| GO:003466012 | Esophagus | ESCC | ncRNA metabolic process | 346/8552 | 485/18723 | 4.35e-31 | 2.51e-28 | 346 |
| GO:00905013 | Esophagus | ESCC | RNA phosphodiester bond hydrolysis | 110/8552 | 152/18723 | 1.95e-11 | 6.81e-10 | 110 |
| GO:00903053 | Esophagus | ESCC | nucleic acid phosphodiester bond hydrolysis | 163/8552 | 261/18723 | 3.07e-08 | 5.73e-07 | 163 |
| GO:00905023 | Esophagus | ESCC | RNA phosphodiester bond hydrolysis, endonucleolytic | 55/8552 | 82/18723 | 7.34e-05 | 5.51e-04 | 55 |
| GO:00344702 | Liver | HCC | ncRNA processing | 293/7958 | 395/18723 | 4.26e-38 | 6.76e-35 | 293 |
| GO:00346601 | Liver | HCC | ncRNA metabolic process | 332/7958 | 485/18723 | 1.48e-31 | 7.80e-29 | 332 |
| GO:00905011 | Liver | HCC | RNA phosphodiester bond hydrolysis | 101/7958 | 152/18723 | 1.99e-09 | 5.63e-08 | 101 |
| GO:0090305 | Liver | HCC | nucleic acid phosphodiester bond hydrolysis | 152/7958 | 261/18723 | 1.90e-07 | 3.46e-06 | 152 |
| GO:0090502 | Liver | HCC | RNA phosphodiester bond hydrolysis, endonucleolytic | 52/7958 | 82/18723 | 1.06e-04 | 9.08e-04 | 52 |
| GO:003447018 | Thyroid | PTC | ncRNA processing | 215/5968 | 395/18723 | 7.14e-21 | 1.22e-18 | 215 |
| GO:00346608 | Thyroid | PTC | ncRNA metabolic process | 239/5968 | 485/18723 | 5.54e-16 | 4.26e-14 | 239 |
| GO:00905015 | Thyroid | PTC | RNA phosphodiester bond hydrolysis | 76/5968 | 152/18723 | 2.40e-06 | 3.17e-05 | 76 |
| GO:00903055 | Thyroid | PTC | nucleic acid phosphodiester bond hydrolysis | 105/5968 | 261/18723 | 2.53e-03 | 1.31e-02 | 105 |
| GO:003447021 | Thyroid | ATC | ncRNA processing | 216/6293 | 395/18723 | 3.14e-18 | 3.98e-16 | 216 |
| GO:003466021 | Thyroid | ATC | ncRNA metabolic process | 240/6293 | 485/18723 | 2.03e-13 | 9.91e-12 | 240 |
| GO:009050112 | Thyroid | ATC | RNA phosphodiester bond hydrolysis | 76/6293 | 152/18723 | 2.07e-05 | 1.86e-04 | 76 |
| GO:009030511 | Thyroid | ATC | nucleic acid phosphodiester bond hydrolysis | 107/6293 | 261/18723 | 7.21e-03 | 2.84e-02 | 107 |
| Page: 1 |
| Pathway ID | Tissue | Disease Stage | Description | Gene Ratio | Bg Ratio | pvalue | p.adjust | qvalue | Count |
| Page: 1 |
Top |
Cell-cell communication analysis |
| Identification of potential cell-cell interactions between two cell types and their ligand-receptor pairs for different disease states |
| Ligand | Receptor | LRpair | Pathway | Tissue | Disease Stage |
| Page: 1 |
Top |
Single-cell gene regulatory network inference analysis |
| Find out the significant the regulons (TFs) and the target genes of each regulon across cell types for different disease states |
| TF | Cell Type | Tissue | Disease Stage | Target Gene | RSS | Regulon Activity |
| ∗The dot plots of a searched regulon are shown for all cell subpopulations in each disease state of each tissue based on the regulon specific score inferred using pySCENIC and by calculating the average expression. |
| Page: 1 |
Top |
Somatic mutation of malignant transformation related genes |
| Annotation of somatic variants for genes involved in malignant transformation |
| Hugo Symbol | Variant Class | Variant Classification | dbSNP RS | HGVSc | HGVSp | HGVSp Short | SWISSPROT | BIOTYPE | SIFT | PolyPhen | Tumor Sample Barcode | Tissue | Histology | Sex | Age | Stage | Therapy Types | Drugs | Outcome |
| INTS11 | SNV | Missense_Mutation | c.625G>A | p.Glu209Lys | p.E209K | Q5TA45 | protein_coding | deleterious(0) | probably_damaging(1) | TCGA-C8-A26Y-01 | Breast | breast invasive carcinoma | Female | >=65 | I/II | Unknown | Unknown | SD | |
| INTS11 | SNV | Missense_Mutation | novel | c.83N>C | p.Val28Ala | p.V28A | Q5TA45 | protein_coding | tolerated(0.1) | possibly_damaging(0.668) | TCGA-D8-A1XK-01 | Breast | breast invasive carcinoma | Female | <65 | I/II | Chemotherapy | doxorubicine+cyclophosphamide | SD |
| INTS11 | SNV | Missense_Mutation | novel | c.568G>T | p.Asp190Tyr | p.D190Y | Q5TA45 | protein_coding | deleterious(0) | probably_damaging(0.985) | TCGA-2W-A8YY-01 | Cervix | cervical & endocervical cancer | Female | <65 | I/II | Chemotherapy | cisplatin | CR |
| INTS11 | SNV | Missense_Mutation | novel | c.1043N>A | p.Gly348Glu | p.G348E | Q5TA45 | protein_coding | tolerated(0.18) | benign(0.033) | TCGA-MA-AA41-01 | Cervix | cervical & endocervical cancer | Female | <65 | I/II | Unknown | Unknown | SD |
| INTS11 | SNV | Missense_Mutation | rs779574336 | c.181N>A | p.Gly61Ser | p.G61S | Q5TA45 | protein_coding | tolerated(0.1) | possibly_damaging(0.606) | TCGA-UC-A7PD-01 | Cervix | cervical & endocervical cancer | Female | <65 | I/II | Unknown | Unknown | PD |
| INTS11 | SNV | Missense_Mutation | novel | c.340C>T | p.Arg114Cys | p.R114C | Q5TA45 | protein_coding | tolerated(0.11) | benign(0.127) | TCGA-VS-A9U6-01 | Cervix | cervical & endocervical cancer | Female | <65 | I/II | Chemotherapy | cisplatin | PD |
| INTS11 | SNV | Missense_Mutation | rs375917361 | c.1702G>A | p.Ala568Thr | p.A568T | Q5TA45 | protein_coding | tolerated_low_confidence(0.44) | benign(0) | TCGA-A6-2686-01 | Colorectum | colon adenocarcinoma | Female | >=65 | I/II | Unknown | Unknown | SD |
| INTS11 | SNV | Missense_Mutation | rs752783300 | c.1246G>A | p.Val416Met | p.V416M | Q5TA45 | protein_coding | deleterious(0.02) | possibly_damaging(0.897) | TCGA-A6-2686-01 | Colorectum | colon adenocarcinoma | Female | >=65 | I/II | Unknown | Unknown | SD |
| INTS11 | SNV | Missense_Mutation | c.971C>T | p.Pro324Leu | p.P324L | Q5TA45 | protein_coding | deleterious(0) | probably_damaging(0.97) | TCGA-AD-6965-01 | Colorectum | colon adenocarcinoma | Male | <65 | III/IV | Chemotherapy | oxaliplatin | PD | |
| INTS11 | SNV | Missense_Mutation | novel | c.158A>G | p.Asp53Gly | p.D53G | Q5TA45 | protein_coding | deleterious(0) | possibly_damaging(0.897) | TCGA-AZ-6601-01 | Colorectum | colon adenocarcinoma | Male | >=65 | I/II | Unknown | Unknown | PD |
| Page: 1 2 3 4 5 6 |
Top |
Related drugs of malignant transformation related genes |
| Identification of chemicals and drugs interact with genes involved in malignant transfromation |
| (DGIdb 4.0) |
| Entrez ID | Symbol | Category | Interaction Types | Drug Claim Name | Drug Name | PMIDs |
| Page: 1 |

Copyright 2023-Present -The University of Texas Health Science Center at Houston |