
|
|||||
|
 | |
| |
| |
| |
| |
| |
|
Gene: INTS10 |
Gene summary for INTS10 |
| Gene information | Species | Human | Gene symbol | INTS10 | Gene ID | 55174 |
| Gene name | integrator complex subunit 10 | |
| Gene Alias | C8orf35 | |
| Cytomap | 8p21.3 | |
| Gene Type | protein-coding | GO ID | GO:0006139 | UniProtAcc | Q9NVR2 |
Top |
Malignant transformation analysis |
| Identification of the aberrant gene expression in precancerous and cancerous lesions by comparing the gene expression of stem-like cells in diseased tissues with normal stem cells |
| Entrez ID | Symbol | Replicates | Species | Organ | Tissue | Adj P-value | Log2FC | Malignancy |
| 55174 | INTS10 | LZE2T | Human | Esophagus | ESCC | 4.79e-02 | 4.80e-01 | 0.082 |
| 55174 | INTS10 | LZE3D | Human | Esophagus | HGIN | 2.17e-03 | 4.13e-01 | 0.0668 |
| 55174 | INTS10 | LZE4T | Human | Esophagus | ESCC | 1.16e-13 | 6.45e-01 | 0.0811 |
| 55174 | INTS10 | LZE7T | Human | Esophagus | ESCC | 3.64e-04 | 1.63e-01 | 0.0667 |
| 55174 | INTS10 | LZE20T | Human | Esophagus | ESCC | 1.62e-03 | 4.71e-02 | 0.0662 |
| 55174 | INTS10 | LZE22T | Human | Esophagus | ESCC | 8.45e-03 | 5.07e-02 | 0.068 |
| 55174 | INTS10 | LZE24T | Human | Esophagus | ESCC | 8.45e-19 | 4.05e-01 | 0.0596 |
| 55174 | INTS10 | LZE21T | Human | Esophagus | ESCC | 3.88e-05 | 4.50e-01 | 0.0655 |
| 55174 | INTS10 | P1T-E | Human | Esophagus | ESCC | 1.18e-05 | 4.70e-01 | 0.0875 |
| 55174 | INTS10 | P2T-E | Human | Esophagus | ESCC | 2.92e-42 | 7.24e-01 | 0.1177 |
| 55174 | INTS10 | P4T-E | Human | Esophagus | ESCC | 3.91e-35 | 8.73e-01 | 0.1323 |
| 55174 | INTS10 | P5T-E | Human | Esophagus | ESCC | 1.19e-10 | 2.18e-01 | 0.1327 |
| 55174 | INTS10 | P8T-E | Human | Esophagus | ESCC | 6.17e-24 | 4.44e-01 | 0.0889 |
| 55174 | INTS10 | P9T-E | Human | Esophagus | ESCC | 1.57e-17 | 3.55e-01 | 0.1131 |
| 55174 | INTS10 | P10T-E | Human | Esophagus | ESCC | 7.54e-40 | 7.26e-01 | 0.116 |
| 55174 | INTS10 | P11T-E | Human | Esophagus | ESCC | 1.58e-13 | 3.67e-01 | 0.1426 |
| 55174 | INTS10 | P12T-E | Human | Esophagus | ESCC | 1.69e-18 | 3.48e-01 | 0.1122 |
| 55174 | INTS10 | P15T-E | Human | Esophagus | ESCC | 2.33e-16 | 3.00e-01 | 0.1149 |
| 55174 | INTS10 | P16T-E | Human | Esophagus | ESCC | 2.20e-49 | 9.71e-01 | 0.1153 |
| 55174 | INTS10 | P17T-E | Human | Esophagus | ESCC | 2.07e-03 | 2.98e-01 | 0.1278 |
| Page: 1 2 3 4 5 |
| Tissue | Expression Dynamics | Abbreviation |
| Esophagus | 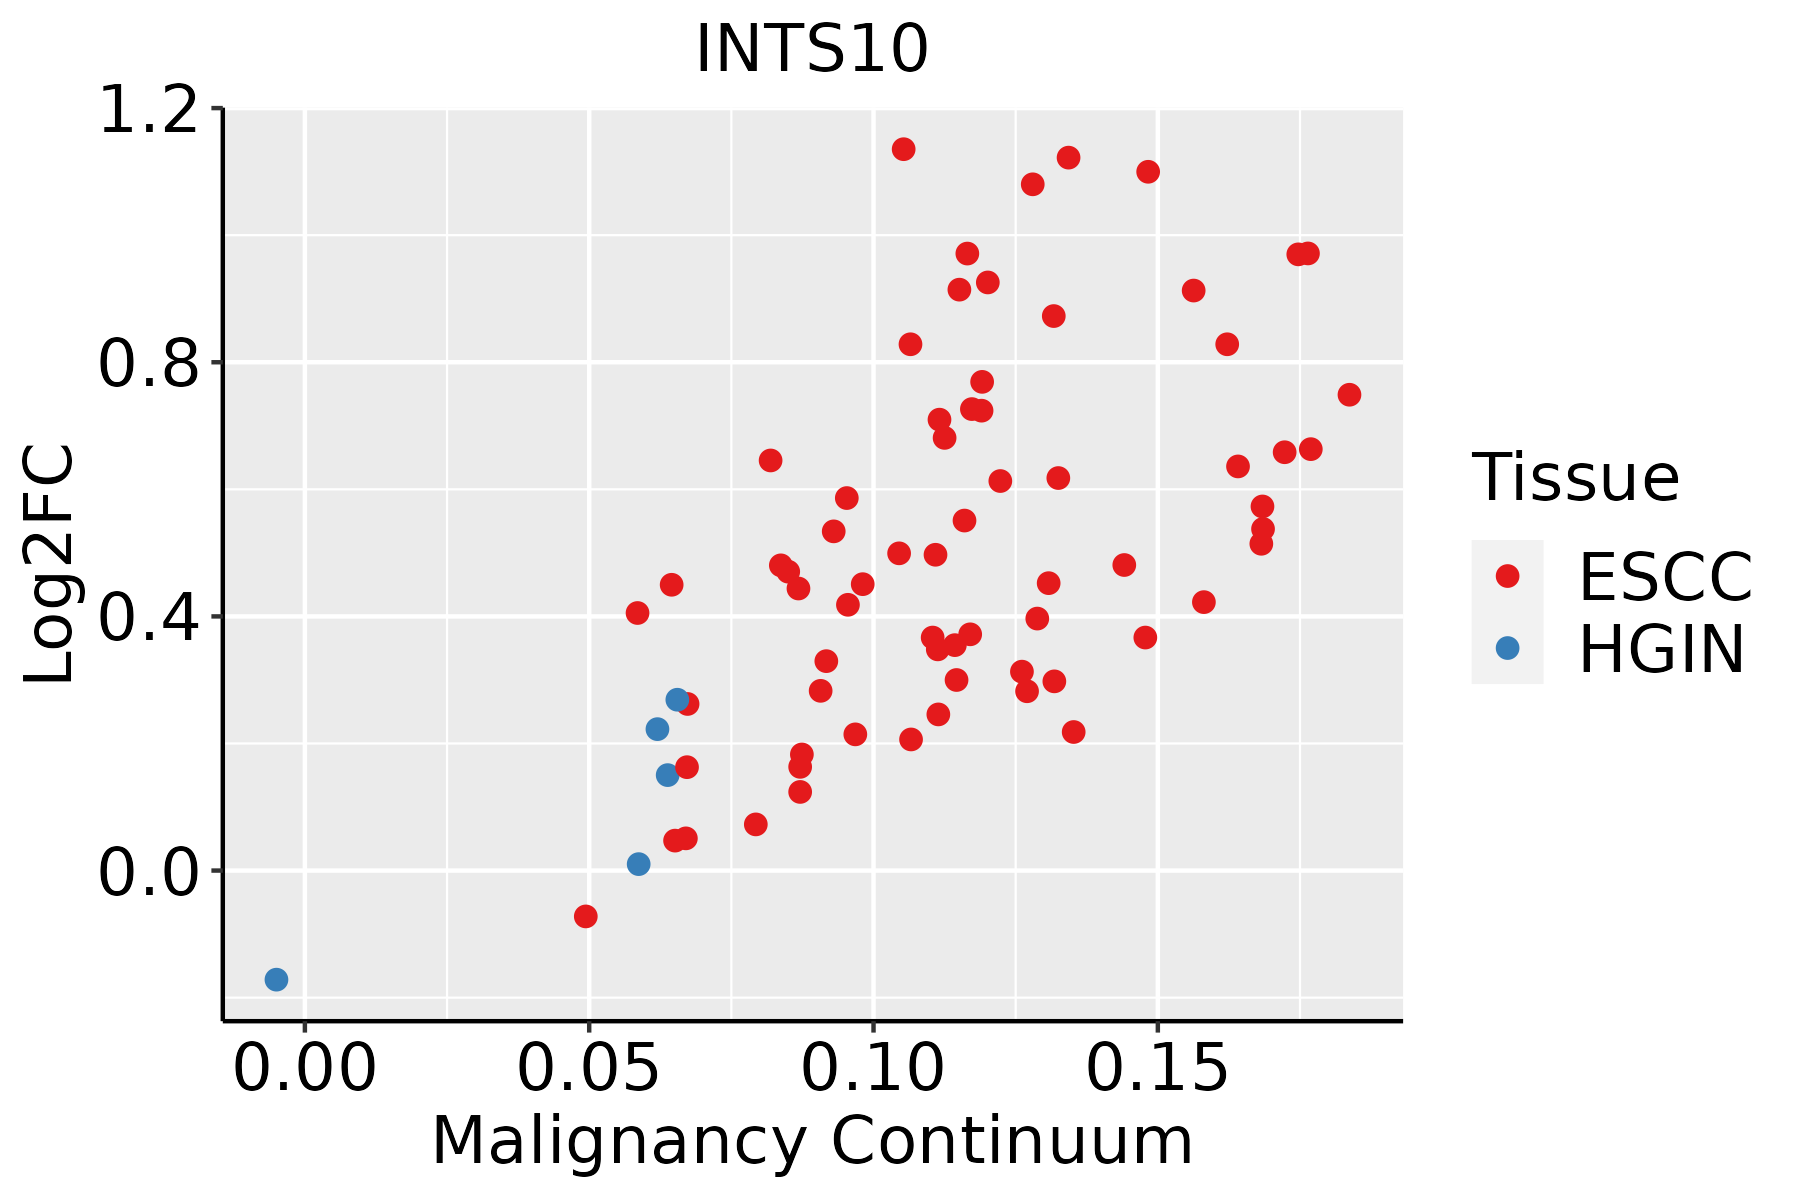 | ESCC: Esophageal squamous cell carcinoma |
| HGIN: High-grade intraepithelial neoplasias | ||
| LGIN: Low-grade intraepithelial neoplasias | ||
| Oral Cavity | 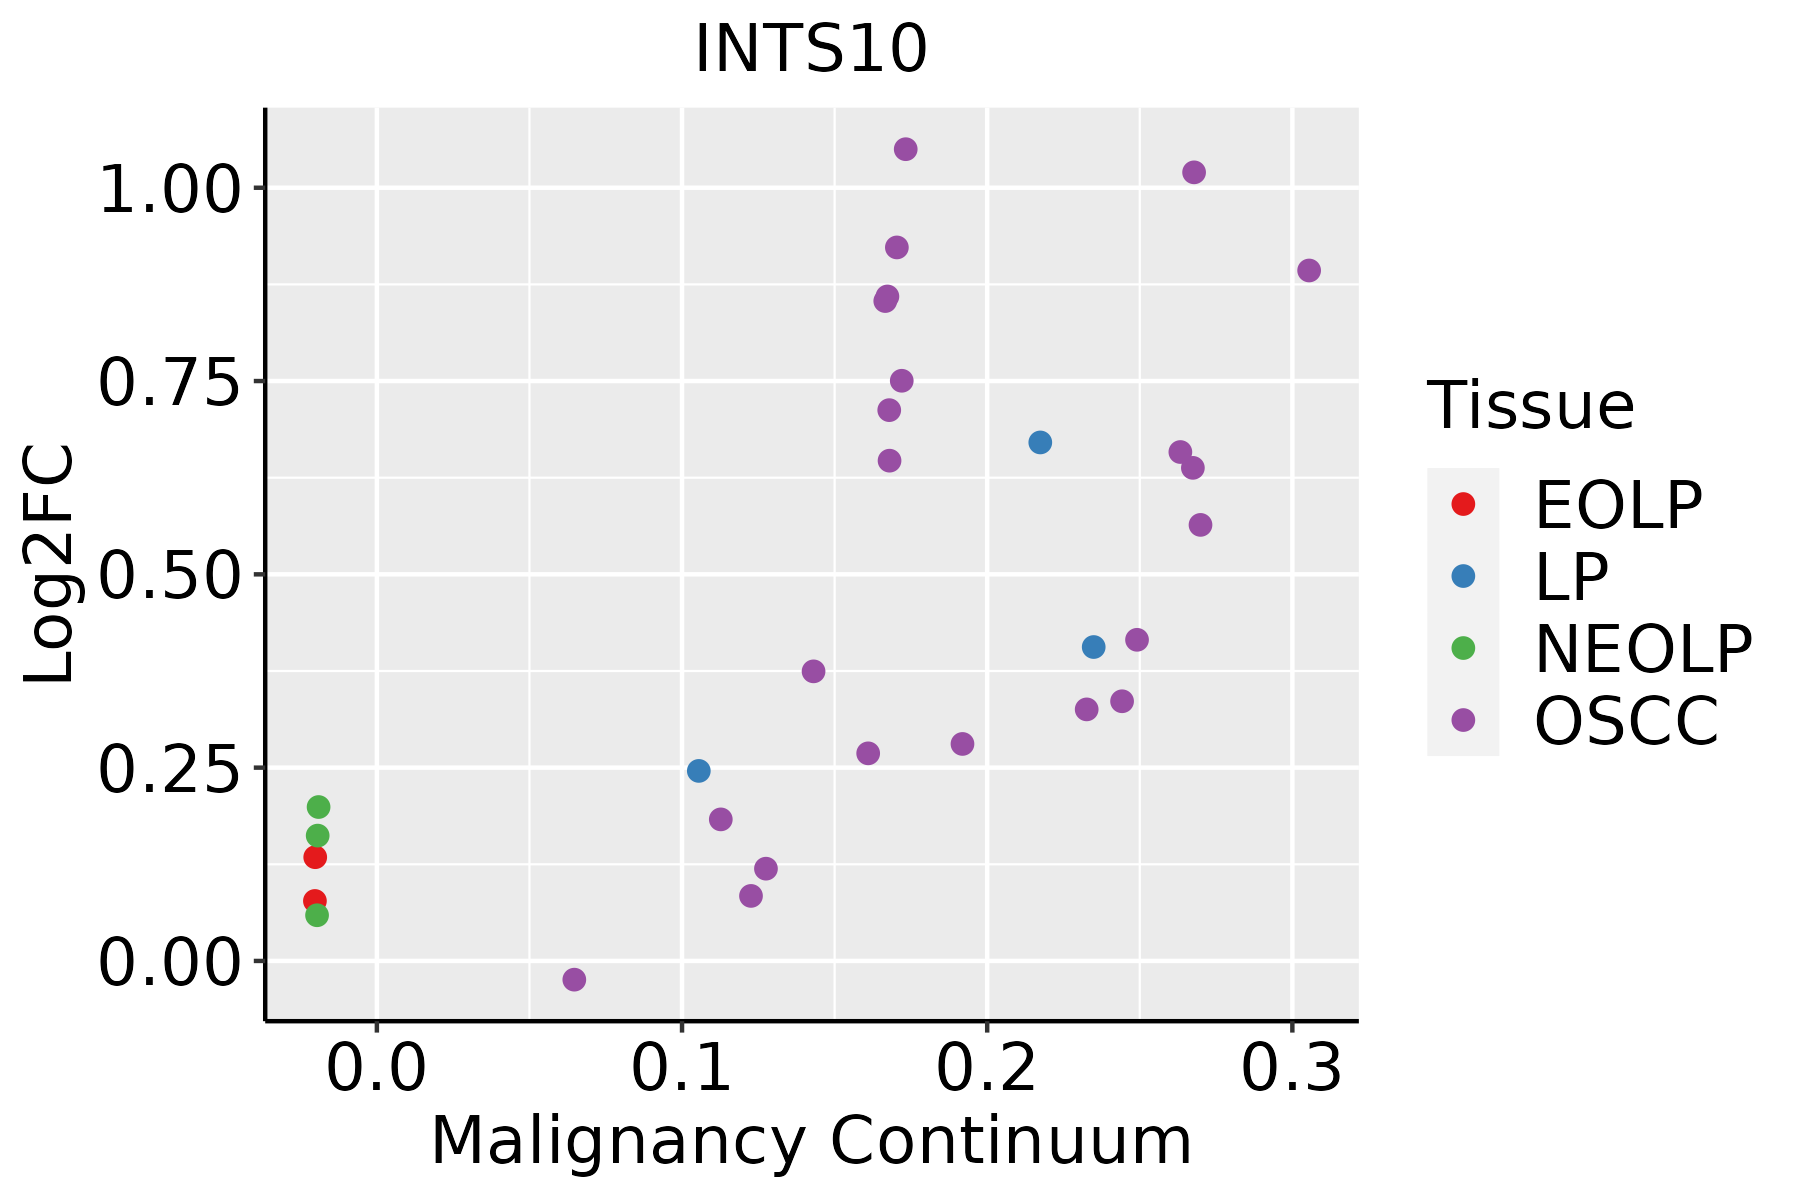 | EOLP: Erosive Oral lichen planus |
| LP: leukoplakia | ||
| NEOLP: Non-erosive oral lichen planus | ||
| OSCC: Oral squamous cell carcinoma | ||
| Skin | 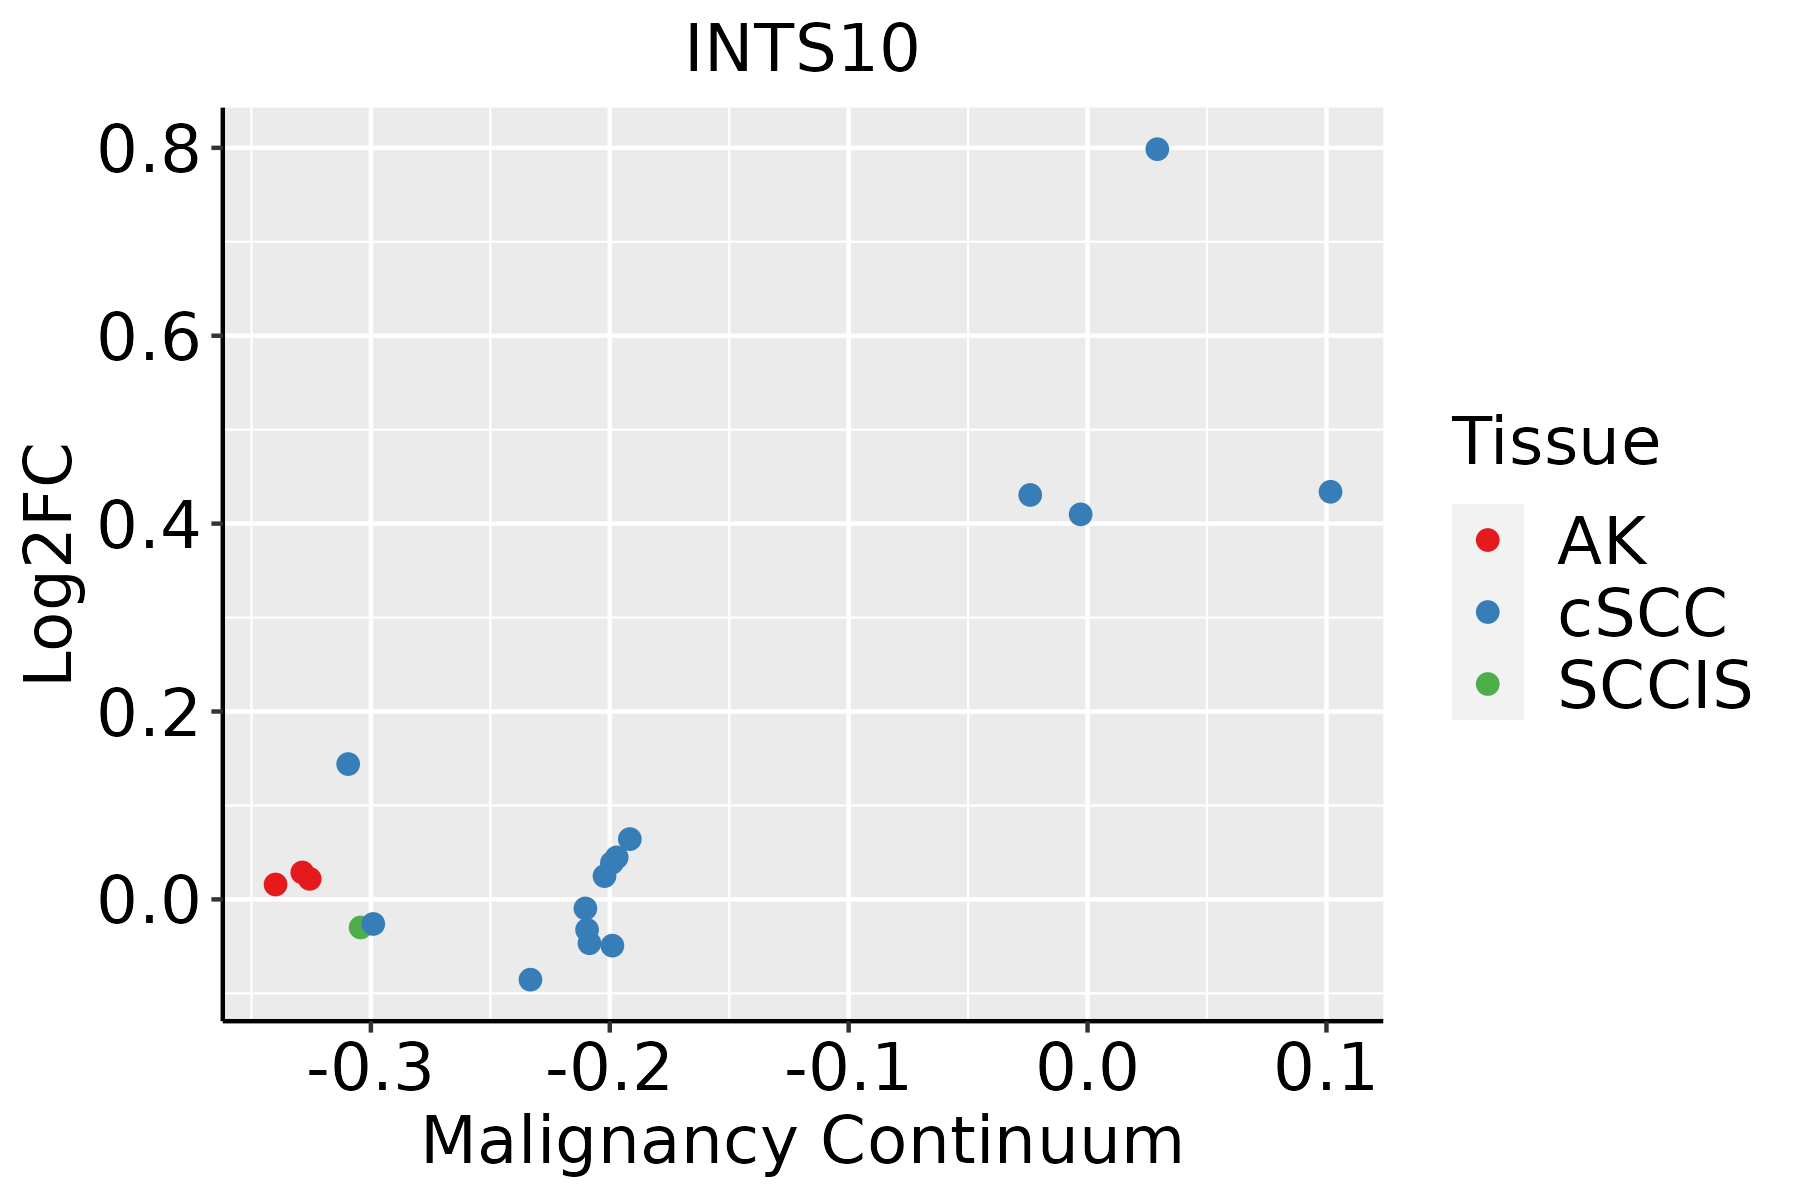 | AK: Actinic keratosis |
| cSCC: Cutaneous squamous cell carcinoma | ||
| SCCIS:squamous cell carcinoma in situ | ||
| Thyroid |  | ATC: Anaplastic thyroid cancer |
| HT: Hashimoto's thyroiditis | ||
| PTC: Papillary thyroid cancer |
| ∗log2FC in expression of this searched gene in stem-like cells from each diseased tissue sample relative to stem-like cells in normal samples in each tissue plotted against the malignancy continuum. Samples are colored based on if they are from different disease stage. |
Top |
Malignant transformation related pathway analysis |
| Find out the enriched GO biological processes and KEGG pathways involved in transition from healthy to precancer to cancer |
| Tissue | Disease Stage | Enriched GO biological Processes |
| Colorectum | AD |  |
| Colorectum | SER |  |
| Colorectum | MSS |  |
| Colorectum | MSI-H |  |
| Colorectum | FAP |  |
| ∗Top 15 enriched GO BP terms are showed in the bar plot of each disease state in each tissue. Each row represents a significant GO biological process which is colored according to the -log10(p.adjust). |
| Page: 1 2 3 4 5 6 7 8 9 |
| GO ID | Tissue | Disease Stage | Description | Gene Ratio | Bg Ratio | pvalue | p.adjust | Count |
| GO:003447015 | Esophagus | ESCC | ncRNA processing | 300/8552 | 395/18723 | 3.09e-35 | 3.26e-32 | 300 |
| GO:003466012 | Esophagus | ESCC | ncRNA metabolic process | 346/8552 | 485/18723 | 4.35e-31 | 2.51e-28 | 346 |
| GO:00344709 | Oral cavity | OSCC | ncRNA processing | 263/7305 | 395/18723 | 4.38e-29 | 2.78e-26 | 263 |
| GO:00346605 | Oral cavity | OSCC | ncRNA metabolic process | 296/7305 | 485/18723 | 2.94e-23 | 6.65e-21 | 296 |
| GO:003447017 | Skin | cSCC | ncRNA processing | 215/4864 | 395/18723 | 6.83e-34 | 4.28e-31 | 215 |
| GO:003466013 | Skin | cSCC | ncRNA metabolic process | 234/4864 | 485/18723 | 1.37e-26 | 4.77e-24 | 234 |
| GO:003447018 | Thyroid | PTC | ncRNA processing | 215/5968 | 395/18723 | 7.14e-21 | 1.22e-18 | 215 |
| GO:00346608 | Thyroid | PTC | ncRNA metabolic process | 239/5968 | 485/18723 | 5.54e-16 | 4.26e-14 | 239 |
| GO:003447021 | Thyroid | ATC | ncRNA processing | 216/6293 | 395/18723 | 3.14e-18 | 3.98e-16 | 216 |
| GO:003466021 | Thyroid | ATC | ncRNA metabolic process | 240/6293 | 485/18723 | 2.03e-13 | 9.91e-12 | 240 |
| Page: 1 |
| Pathway ID | Tissue | Disease Stage | Description | Gene Ratio | Bg Ratio | pvalue | p.adjust | qvalue | Count |
| Page: 1 |
Top |
Cell-cell communication analysis |
| Identification of potential cell-cell interactions between two cell types and their ligand-receptor pairs for different disease states |
| Ligand | Receptor | LRpair | Pathway | Tissue | Disease Stage |
| Page: 1 |
Top |
Single-cell gene regulatory network inference analysis |
| Find out the significant the regulons (TFs) and the target genes of each regulon across cell types for different disease states |
| TF | Cell Type | Tissue | Disease Stage | Target Gene | RSS | Regulon Activity |
| ∗The dot plots of a searched regulon are shown for all cell subpopulations in each disease state of each tissue based on the regulon specific score inferred using pySCENIC and by calculating the average expression. |
| Page: 1 |
Top |
Somatic mutation of malignant transformation related genes |
| Annotation of somatic variants for genes involved in malignant transformation |
| Hugo Symbol | Variant Class | Variant Classification | dbSNP RS | HGVSc | HGVSp | HGVSp Short | SWISSPROT | BIOTYPE | SIFT | PolyPhen | Tumor Sample Barcode | Tissue | Histology | Sex | Age | Stage | Therapy Types | Drugs | Outcome |
| INTS10 | SNV | Missense_Mutation | c.1118N>T | p.Ala373Val | p.A373V | Q9NVR2 | protein_coding | tolerated(0.11) | benign(0.164) | TCGA-A2-A0CX-01 | Breast | breast invasive carcinoma | Female | <65 | I/II | Chemotherapy | adriamycin | SD | |
| INTS10 | SNV | Missense_Mutation | novel | c.1961A>T | p.Gln654Leu | p.Q654L | Q9NVR2 | protein_coding | tolerated(0.07) | probably_damaging(0.969) | TCGA-AO-A0JD-01 | Breast | breast invasive carcinoma | Female | <65 | III/IV | Chemotherapy | cyclophosphamide | SD |
| INTS10 | SNV | Missense_Mutation | c.356N>G | p.Thr119Arg | p.T119R | Q9NVR2 | protein_coding | deleterious(0) | probably_damaging(0.998) | TCGA-BH-A1F6-01 | Breast | breast invasive carcinoma | Female | <65 | III/IV | Unknown | Unknown | SD | |
| INTS10 | SNV | Missense_Mutation | rs772409351 | c.215A>C | p.Asp72Ala | p.D72A | Q9NVR2 | protein_coding | deleterious(0.02) | benign(0.163) | TCGA-D8-A1JP-01 | Breast | breast invasive carcinoma | Female | >=65 | I/II | Hormone Therapy | tamoxiphen | SD |
| INTS10 | SNV | Missense_Mutation | rs772409351 | c.215N>C | p.Asp72Ala | p.D72A | Q9NVR2 | protein_coding | deleterious(0.02) | benign(0.163) | TCGA-D8-A1X7-01 | Breast | breast invasive carcinoma | Female | <65 | I/II | ChemotherapyHormone Therapy | doxorubicine+cyclophosphamide+tamoxifen | SD |
| INTS10 | SNV | Missense_Mutation | rs772409351 | c.215N>C | p.Asp72Ala | p.D72A | Q9NVR2 | protein_coding | deleterious(0.02) | benign(0.163) | TCGA-D8-A1XK-01 | Breast | breast invasive carcinoma | Female | <65 | I/II | Chemotherapy | doxorubicine+cyclophosphamide | SD |
| INTS10 | SNV | Missense_Mutation | c.1960N>G | p.Gln654Glu | p.Q654E | Q9NVR2 | protein_coding | tolerated(0.1) | probably_damaging(0.954) | TCGA-D8-A27G-01 | Breast | breast invasive carcinoma | Female | >=65 | I/II | Unknown | Unknown | SD | |
| INTS10 | insertion | Frame_Shift_Ins | novel | c.1962_1963insTACAGCATATTTTT | p.Gly655TyrfsTer8 | p.G655Yfs*8 | Q9NVR2 | protein_coding | TCGA-AO-A0JD-01 | Breast | breast invasive carcinoma | Female | <65 | III/IV | Chemotherapy | cyclophosphamide | SD | ||
| INTS10 | SNV | Missense_Mutation | c.682N>C | p.Asp228His | p.D228H | Q9NVR2 | protein_coding | tolerated(0.08) | possibly_damaging(0.46) | TCGA-MY-A5BD-01 | Cervix | cervical & endocervical cancer | Female | <65 | I/II | Chemotherapy | cisplatin | CR | |
| INTS10 | SNV | Missense_Mutation | c.1205N>G | p.Glu402Gly | p.E402G | Q9NVR2 | protein_coding | tolerated(0.13) | benign(0.244) | TCGA-A6-3809-01 | Colorectum | colon adenocarcinoma | Female | >=65 | I/II | Unknown | Unknown | SD |
| Page: 1 2 3 4 5 6 7 |
Top |
Related drugs of malignant transformation related genes |
| Identification of chemicals and drugs interact with genes involved in malignant transfromation |
| (DGIdb 4.0) |
| Entrez ID | Symbol | Category | Interaction Types | Drug Claim Name | Drug Name | PMIDs |
| Page: 1 |

Copyright 2023-Present -The University of Texas Health Science Center at Houston |