
|
|||||
|
 | |
| |
| |
| |
| |
| |
|
Gene: INTS1 |
Gene summary for INTS1 |
| Gene information | Species | Human | Gene symbol | INTS1 | Gene ID | 26173 |
| Gene name | integrator complex subunit 1 | |
| Gene Alias | INT1 | |
| Cytomap | 7p22.3 | |
| Gene Type | protein-coding | GO ID | GO:0006139 | UniProtAcc | Q8N201 |
Top |
Malignant transformation analysis |
| Identification of the aberrant gene expression in precancerous and cancerous lesions by comparing the gene expression of stem-like cells in diseased tissues with normal stem cells |
| Entrez ID | Symbol | Replicates | Species | Organ | Tissue | Adj P-value | Log2FC | Malignancy |
| 26173 | INTS1 | LZE4T | Human | Esophagus | ESCC | 1.14e-04 | 7.87e-02 | 0.0811 |
| 26173 | INTS1 | LZE7T | Human | Esophagus | ESCC | 1.51e-03 | 2.42e-01 | 0.0667 |
| 26173 | INTS1 | LZE8T | Human | Esophagus | ESCC | 1.70e-04 | 9.09e-02 | 0.067 |
| 26173 | INTS1 | LZE20T | Human | Esophagus | ESCC | 1.70e-02 | 8.87e-02 | 0.0662 |
| 26173 | INTS1 | LZE22T | Human | Esophagus | ESCC | 2.26e-02 | 2.10e-01 | 0.068 |
| 26173 | INTS1 | LZE24T | Human | Esophagus | ESCC | 7.58e-11 | 2.37e-01 | 0.0596 |
| 26173 | INTS1 | P1T-E | Human | Esophagus | ESCC | 7.72e-17 | 4.53e-01 | 0.0875 |
| 26173 | INTS1 | P2T-E | Human | Esophagus | ESCC | 1.15e-15 | 3.31e-01 | 0.1177 |
| 26173 | INTS1 | P4T-E | Human | Esophagus | ESCC | 8.16e-10 | 1.35e-01 | 0.1323 |
| 26173 | INTS1 | P5T-E | Human | Esophagus | ESCC | 1.28e-04 | 9.13e-02 | 0.1327 |
| 26173 | INTS1 | P8T-E | Human | Esophagus | ESCC | 3.92e-15 | 2.29e-01 | 0.0889 |
| 26173 | INTS1 | P9T-E | Human | Esophagus | ESCC | 2.03e-14 | 2.36e-01 | 0.1131 |
| 26173 | INTS1 | P10T-E | Human | Esophagus | ESCC | 6.37e-15 | 2.79e-01 | 0.116 |
| 26173 | INTS1 | P11T-E | Human | Esophagus | ESCC | 6.94e-05 | 2.38e-01 | 0.1426 |
| 26173 | INTS1 | P12T-E | Human | Esophagus | ESCC | 4.10e-15 | 2.21e-01 | 0.1122 |
| 26173 | INTS1 | P15T-E | Human | Esophagus | ESCC | 8.78e-10 | 1.83e-01 | 0.1149 |
| 26173 | INTS1 | P16T-E | Human | Esophagus | ESCC | 4.07e-18 | 2.26e-01 | 0.1153 |
| 26173 | INTS1 | P17T-E | Human | Esophagus | ESCC | 6.06e-15 | 5.43e-01 | 0.1278 |
| 26173 | INTS1 | P20T-E | Human | Esophagus | ESCC | 3.38e-08 | 1.36e-01 | 0.1124 |
| 26173 | INTS1 | P21T-E | Human | Esophagus | ESCC | 2.35e-15 | 2.46e-01 | 0.1617 |
| Page: 1 2 3 4 5 |
| Tissue | Expression Dynamics | Abbreviation |
| Esophagus | 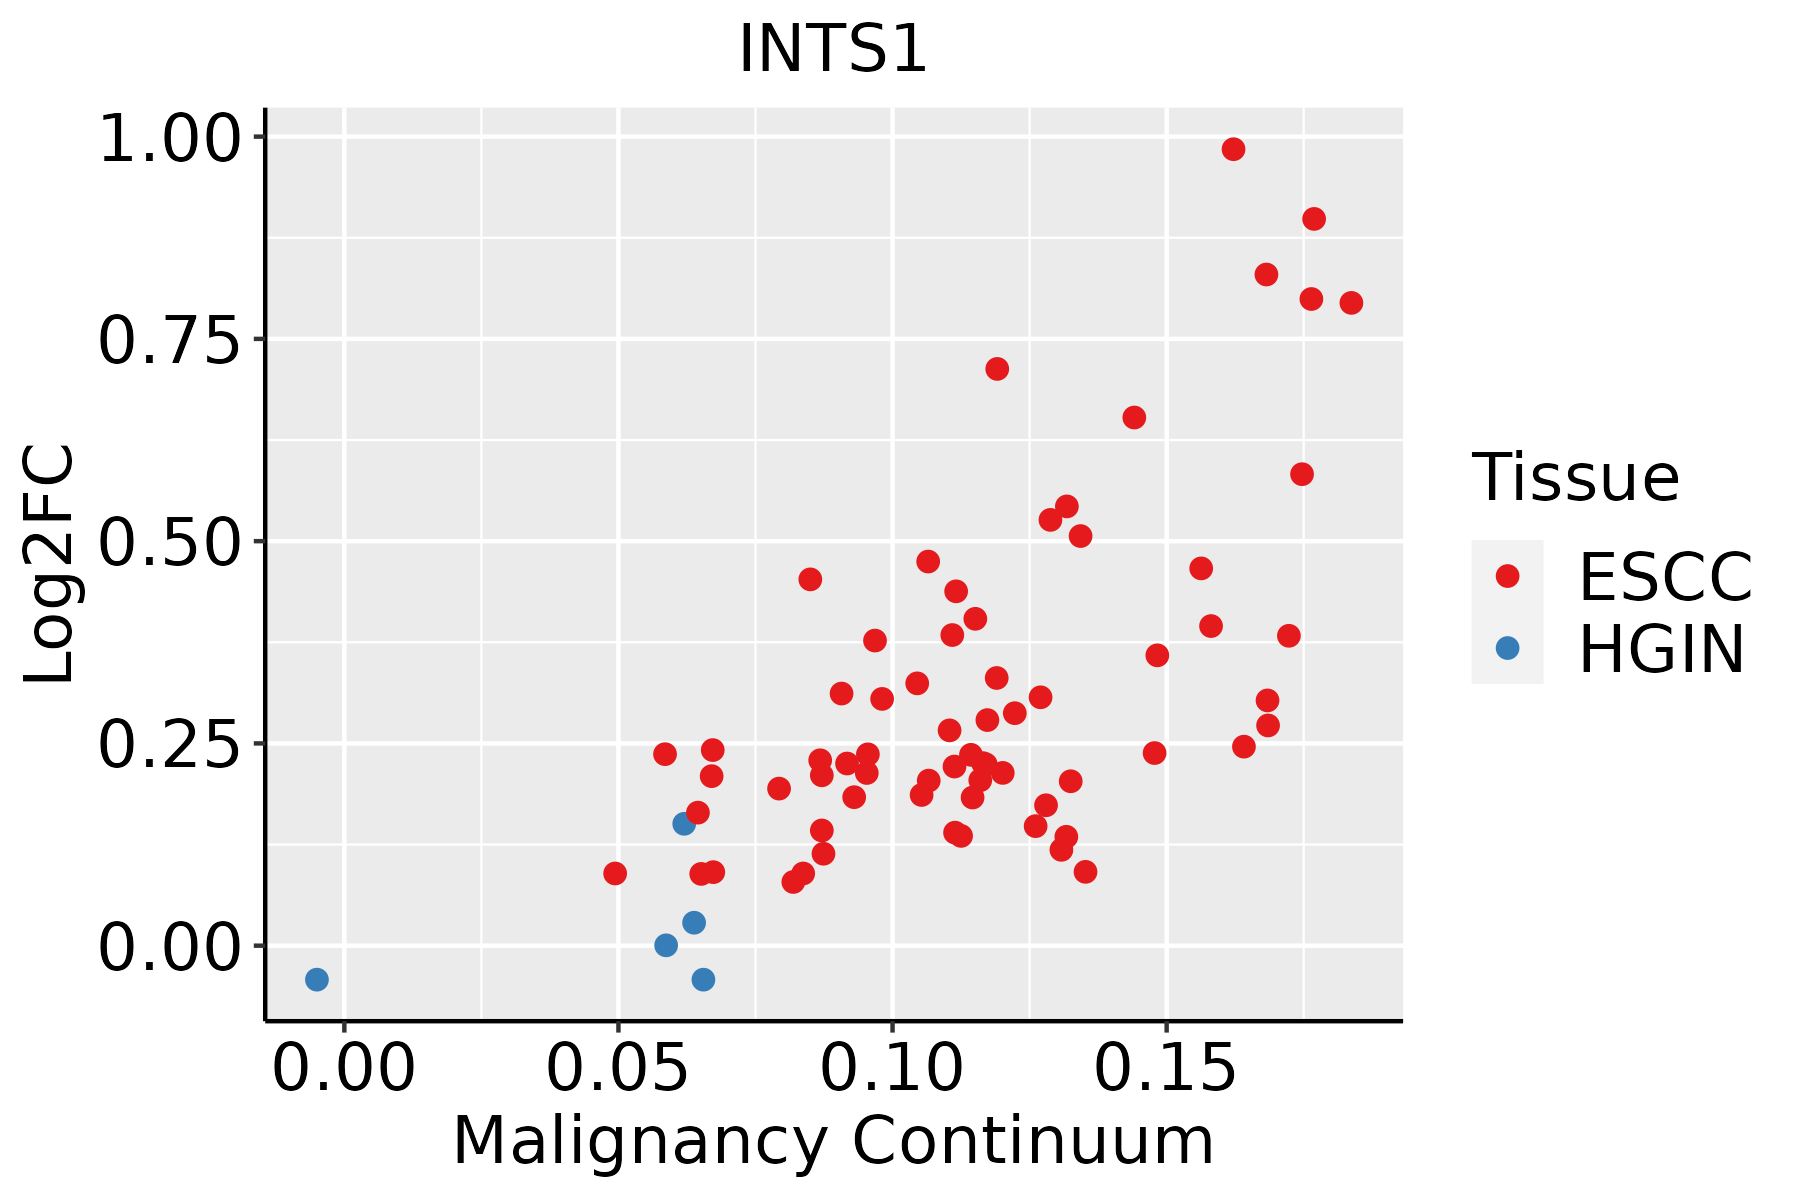 | ESCC: Esophageal squamous cell carcinoma |
| HGIN: High-grade intraepithelial neoplasias | ||
| LGIN: Low-grade intraepithelial neoplasias | ||
| Liver |  | HCC: Hepatocellular carcinoma |
| NAFLD: Non-alcoholic fatty liver disease | ||
| Oral Cavity |  | EOLP: Erosive Oral lichen planus |
| LP: leukoplakia | ||
| NEOLP: Non-erosive oral lichen planus | ||
| OSCC: Oral squamous cell carcinoma | ||
| Thyroid | 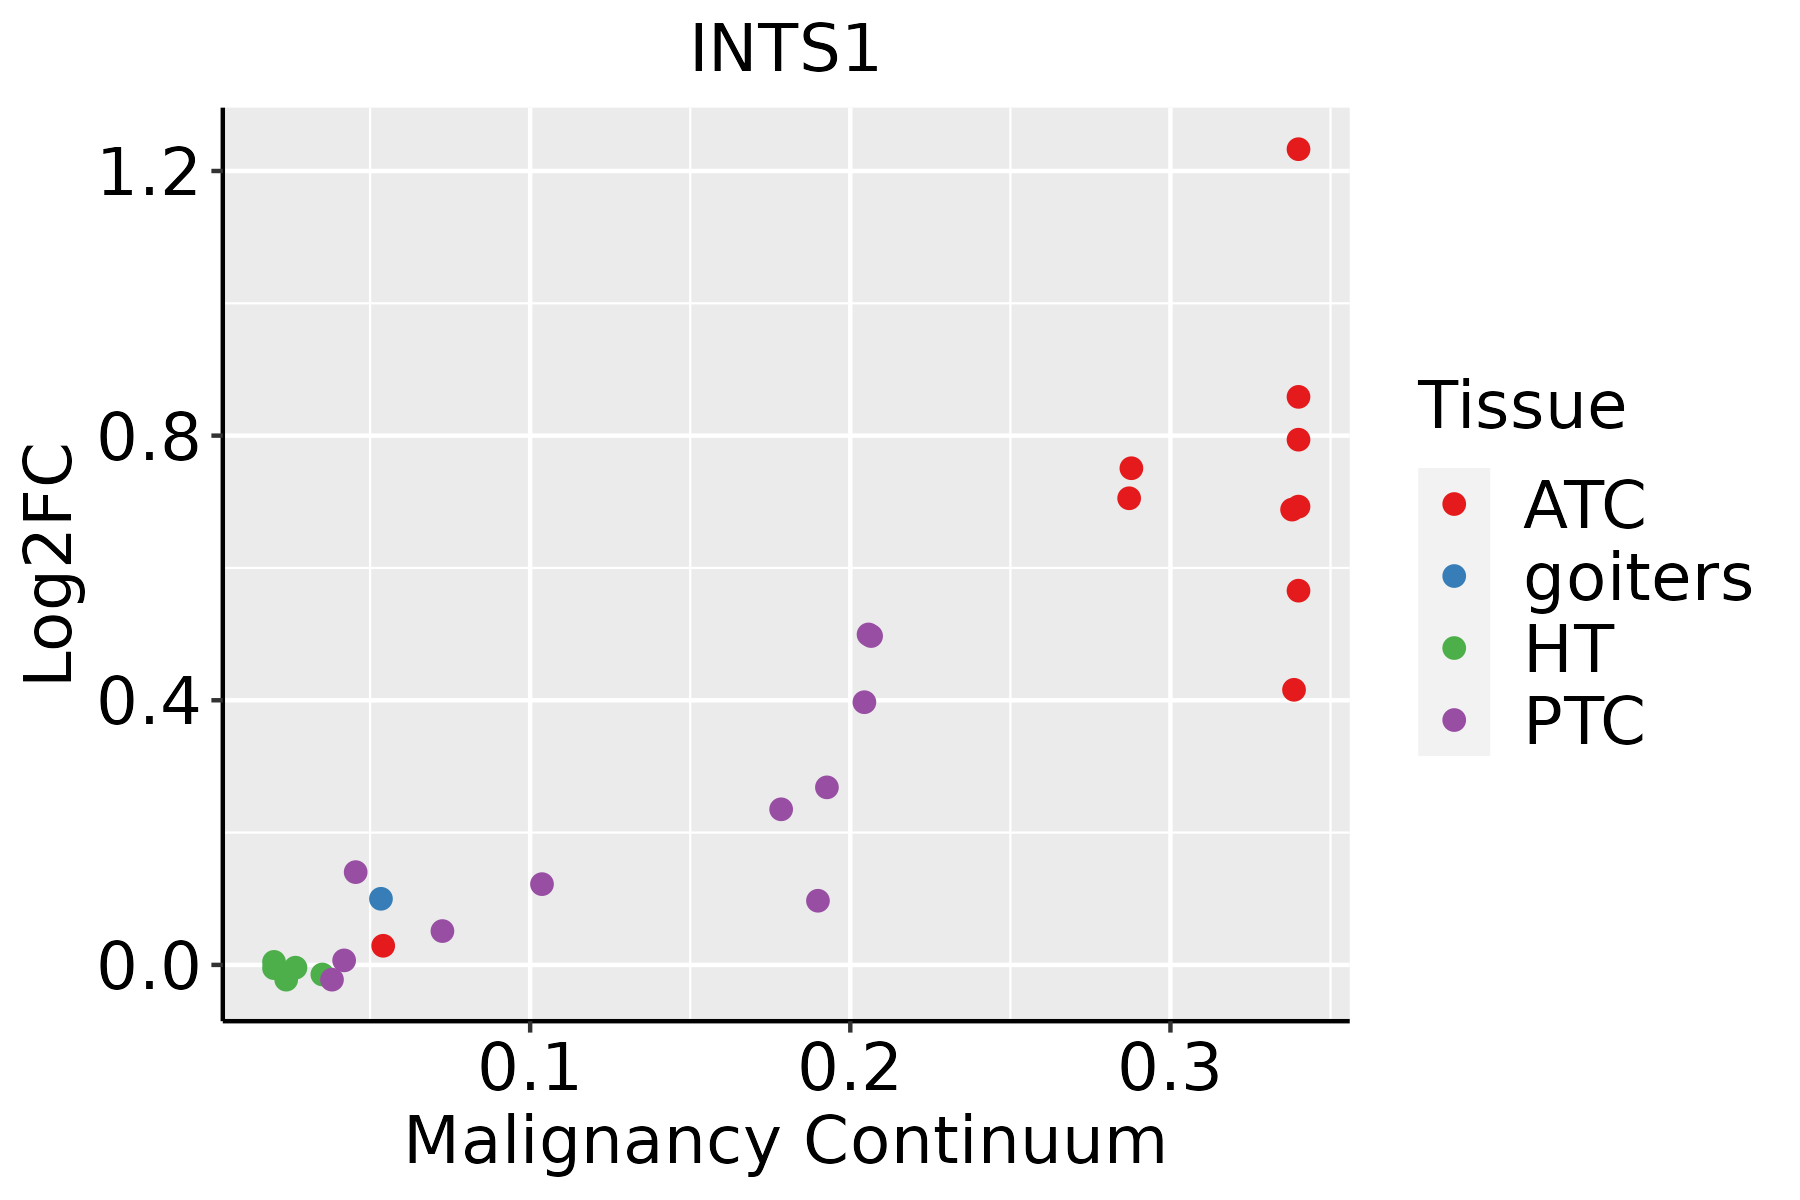 | ATC: Anaplastic thyroid cancer |
| HT: Hashimoto's thyroiditis | ||
| PTC: Papillary thyroid cancer |
| ∗log2FC in expression of this searched gene in stem-like cells from each diseased tissue sample relative to stem-like cells in normal samples in each tissue plotted against the malignancy continuum. Samples are colored based on if they are from different disease stage. |
Top |
Malignant transformation related pathway analysis |
| Find out the enriched GO biological processes and KEGG pathways involved in transition from healthy to precancer to cancer |
| Tissue | Disease Stage | Enriched GO biological Processes |
| Colorectum | AD |  |
| Colorectum | SER |  |
| Colorectum | MSS |  |
| Colorectum | MSI-H |  |
| Colorectum | FAP |  |
| ∗Top 15 enriched GO BP terms are showed in the bar plot of each disease state in each tissue. Each row represents a significant GO biological process which is colored according to the -log10(p.adjust). |
| Page: 1 2 3 4 5 6 7 8 9 |
| GO ID | Tissue | Disease Stage | Description | Gene Ratio | Bg Ratio | pvalue | p.adjust | Count |
| GO:003447010 | Esophagus | HGIN | ncRNA processing | 97/2587 | 395/18723 | 5.92e-09 | 3.90e-07 | 97 |
| GO:00346606 | Esophagus | HGIN | ncRNA metabolic process | 104/2587 | 485/18723 | 2.26e-06 | 8.23e-05 | 104 |
| GO:003447015 | Esophagus | ESCC | ncRNA processing | 300/8552 | 395/18723 | 3.09e-35 | 3.26e-32 | 300 |
| GO:003466012 | Esophagus | ESCC | ncRNA metabolic process | 346/8552 | 485/18723 | 4.35e-31 | 2.51e-28 | 346 |
| GO:00905013 | Esophagus | ESCC | RNA phosphodiester bond hydrolysis | 110/8552 | 152/18723 | 1.95e-11 | 6.81e-10 | 110 |
| GO:00903053 | Esophagus | ESCC | nucleic acid phosphodiester bond hydrolysis | 163/8552 | 261/18723 | 3.07e-08 | 5.73e-07 | 163 |
| GO:00311233 | Esophagus | ESCC | RNA 3'-end processing | 76/8552 | 116/18723 | 1.25e-05 | 1.15e-04 | 76 |
| GO:00905023 | Esophagus | ESCC | RNA phosphodiester bond hydrolysis, endonucleolytic | 55/8552 | 82/18723 | 7.34e-05 | 5.51e-04 | 55 |
| GO:00344702 | Liver | HCC | ncRNA processing | 293/7958 | 395/18723 | 4.26e-38 | 6.76e-35 | 293 |
| GO:00346601 | Liver | HCC | ncRNA metabolic process | 332/7958 | 485/18723 | 1.48e-31 | 7.80e-29 | 332 |
| GO:00905011 | Liver | HCC | RNA phosphodiester bond hydrolysis | 101/7958 | 152/18723 | 1.99e-09 | 5.63e-08 | 101 |
| GO:00311231 | Liver | HCC | RNA 3'-end processing | 81/7958 | 116/18723 | 2.27e-09 | 6.32e-08 | 81 |
| GO:0090305 | Liver | HCC | nucleic acid phosphodiester bond hydrolysis | 152/7958 | 261/18723 | 1.90e-07 | 3.46e-06 | 152 |
| GO:0090502 | Liver | HCC | RNA phosphodiester bond hydrolysis, endonucleolytic | 52/7958 | 82/18723 | 1.06e-04 | 9.08e-04 | 52 |
| GO:00344709 | Oral cavity | OSCC | ncRNA processing | 263/7305 | 395/18723 | 4.38e-29 | 2.78e-26 | 263 |
| GO:00346605 | Oral cavity | OSCC | ncRNA metabolic process | 296/7305 | 485/18723 | 2.94e-23 | 6.65e-21 | 296 |
| GO:00311232 | Oral cavity | OSCC | RNA 3'-end processing | 75/7305 | 116/18723 | 1.93e-08 | 3.79e-07 | 75 |
| GO:00344708 | Prostate | BPH | ncRNA processing | 84/3107 | 395/18723 | 8.44e-03 | 3.64e-02 | 84 |
| GO:003447013 | Prostate | Tumor | ncRNA processing | 94/3246 | 395/18723 | 6.02e-04 | 4.31e-03 | 94 |
| GO:003447017 | Skin | cSCC | ncRNA processing | 215/4864 | 395/18723 | 6.83e-34 | 4.28e-31 | 215 |
| Page: 1 2 |
| Pathway ID | Tissue | Disease Stage | Description | Gene Ratio | Bg Ratio | pvalue | p.adjust | qvalue | Count |
| Page: 1 |
Top |
Cell-cell communication analysis |
| Identification of potential cell-cell interactions between two cell types and their ligand-receptor pairs for different disease states |
| Ligand | Receptor | LRpair | Pathway | Tissue | Disease Stage |
| Page: 1 |
Top |
Single-cell gene regulatory network inference analysis |
| Find out the significant the regulons (TFs) and the target genes of each regulon across cell types for different disease states |
| TF | Cell Type | Tissue | Disease Stage | Target Gene | RSS | Regulon Activity |
| ∗The dot plots of a searched regulon are shown for all cell subpopulations in each disease state of each tissue based on the regulon specific score inferred using pySCENIC and by calculating the average expression. |
| Page: 1 |
Top |
Somatic mutation of malignant transformation related genes |
| Annotation of somatic variants for genes involved in malignant transformation |
| Hugo Symbol | Variant Class | Variant Classification | dbSNP RS | HGVSc | HGVSp | HGVSp Short | SWISSPROT | BIOTYPE | SIFT | PolyPhen | Tumor Sample Barcode | Tissue | Histology | Sex | Age | Stage | Therapy Types | Drugs | Outcome |
| INTS1 | SNV | Missense_Mutation | rs774102668 | c.1726N>T | p.Arg576Cys | p.R576C | Q8N201 | protein_coding | deleterious(0) | probably_damaging(0.925) | TCGA-A2-A04P-01 | Breast | breast invasive carcinoma | Female | <65 | III/IV | Chemotherapy | taxol | PD |
| INTS1 | SNV | Missense_Mutation | novel | c.169N>T | p.Arg57Cys | p.R57C | Q8N201 | protein_coding | deleterious(0) | probably_damaging(0.991) | TCGA-A2-A0CM-01 | Breast | breast invasive carcinoma | Female | <65 | I/II | Chemotherapy | adriamycin | PD |
| INTS1 | SNV | Missense_Mutation | c.1545N>A | p.Phe515Leu | p.F515L | Q8N201 | protein_coding | tolerated(0.19) | benign(0.015) | TCGA-AC-A23H-01 | Breast | breast invasive carcinoma | Female | >=65 | I/II | Unknown | Unknown | PD | |
| INTS1 | SNV | Missense_Mutation | c.442N>G | p.Gln148Glu | p.Q148E | Q8N201 | protein_coding | tolerated(0.17) | possibly_damaging(0.503) | TCGA-C8-A1HM-01 | Breast | breast invasive carcinoma | Female | >=65 | I/II | Chemotherapy | doxorubicin | CR | |
| INTS1 | SNV | Missense_Mutation | c.2951T>C | p.Val984Ala | p.V984A | Q8N201 | protein_coding | tolerated(0.4) | benign(0.076) | TCGA-D8-A1XK-01 | Breast | breast invasive carcinoma | Female | <65 | I/II | Chemotherapy | doxorubicine+cyclophosphamide | SD | |
| INTS1 | SNV | Missense_Mutation | novel | c.572N>G | p.Asp191Gly | p.D191G | Q8N201 | protein_coding | deleterious(0) | probably_damaging(0.982) | TCGA-E2-A15M-01 | Breast | breast invasive carcinoma | Female | >=65 | I/II | Hormone Therapy | arimidex | SD |
| INTS1 | SNV | Missense_Mutation | novel | c.3694N>C | p.Val1232Leu | p.V1232L | Q8N201 | protein_coding | deleterious(0.02) | possibly_damaging(0.845) | TCGA-LL-A441-01 | Breast | breast invasive carcinoma | Female | <65 | I/II | Chemotherapy | taxotere | CR |
| INTS1 | SNV | Missense_Mutation | novel | c.2734G>A | p.Glu912Lys | p.E912K | Q8N201 | protein_coding | deleterious(0) | probably_damaging(0.995) | TCGA-LL-A5YL-01 | Breast | breast invasive carcinoma | Female | <65 | I/II | Chemotherapy | adriamycin | SD |
| INTS1 | insertion | Frame_Shift_Ins | novel | c.2090_2091insCCTGGACA | p.Arg698LeufsTer7 | p.R698Lfs*7 | Q8N201 | protein_coding | TCGA-A2-A0D1-01 | Breast | breast invasive carcinoma | Female | >=65 | I/II | Chemotherapy | taxotere | SD | ||
| INTS1 | insertion | In_Frame_Ins | novel | c.177_178insCTCTGTGTA | p.Arg59_Asp60insLeuCysVal | p.R59_D60insLCV | Q8N201 | protein_coding | TCGA-AN-A03X-01 | Breast | breast invasive carcinoma | Female | >=65 | I/II | Unknown | Unknown | SD |
| Page: 1 2 3 4 5 6 7 8 9 10 11 12 13 14 15 16 17 18 |
Top |
Related drugs of malignant transformation related genes |
| Identification of chemicals and drugs interact with genes involved in malignant transfromation |
| (DGIdb 4.0) |
| Entrez ID | Symbol | Category | Interaction Types | Drug Claim Name | Drug Name | PMIDs |
| Page: 1 |

Copyright 2023-Present -The University of Texas Health Science Center at Houston |