
|
|||||
|
 | |
| |
| |
| |
| |
| |
|
Gene: INSR |
Gene summary for INSR |
| Gene information | Species | Human | Gene symbol | INSR | Gene ID | 3643 |
| Gene name | insulin receptor | |
| Gene Alias | CD220 | |
| Cytomap | 19p13.2 | |
| Gene Type | protein-coding | GO ID | GO:0000165 | UniProtAcc | P06213 |
Top |
Malignant transformation analysis |
| Identification of the aberrant gene expression in precancerous and cancerous lesions by comparing the gene expression of stem-like cells in diseased tissues with normal stem cells |
| Entrez ID | Symbol | Replicates | Species | Organ | Tissue | Adj P-value | Log2FC | Malignancy |
| 3643 | INSR | GSM4909290 | Human | Breast | IDC | 3.18e-03 | -2.91e-01 | 0.2096 |
| 3643 | INSR | GSM4909294 | Human | Breast | IDC | 7.57e-05 | -3.58e-01 | 0.2022 |
| 3643 | INSR | GSM4909296 | Human | Breast | IDC | 1.52e-12 | -3.88e-01 | 0.1524 |
| 3643 | INSR | GSM4909297 | Human | Breast | IDC | 2.60e-18 | 3.52e-01 | 0.1517 |
| 3643 | INSR | GSM4909311 | Human | Breast | IDC | 8.37e-17 | -2.98e-01 | 0.1534 |
| 3643 | INSR | GSM4909312 | Human | Breast | IDC | 8.89e-07 | -2.98e-01 | 0.1552 |
| 3643 | INSR | GSM4909315 | Human | Breast | IDC | 6.10e-07 | -3.56e-01 | 0.21 |
| 3643 | INSR | GSM4909316 | Human | Breast | IDC | 2.76e-02 | -3.85e-01 | 0.21 |
| 3643 | INSR | GSM4909319 | Human | Breast | IDC | 6.58e-19 | -4.33e-01 | 0.1563 |
| 3643 | INSR | GSM4909320 | Human | Breast | IDC | 2.21e-28 | 1.05e+00 | 0.1575 |
| 3643 | INSR | GSM4909321 | Human | Breast | IDC | 1.59e-143 | 1.77e+00 | 0.1559 |
| 3643 | INSR | brca10 | Human | Breast | Precancer | 2.86e-02 | -2.69e-01 | -0.0029 |
| 3643 | INSR | NCCBC14 | Human | Breast | DCIS | 1.31e-12 | -3.86e-01 | 0.2021 |
| 3643 | INSR | NCCBC5 | Human | Breast | DCIS | 3.41e-13 | -3.79e-01 | 0.2046 |
| 3643 | INSR | P1 | Human | Breast | IDC | 4.96e-09 | -1.30e-01 | 0.1527 |
| 3643 | INSR | P2 | Human | Breast | IDC | 8.00e-09 | -4.14e-01 | 0.21 |
| 3643 | INSR | DCIS2 | Human | Breast | DCIS | 1.39e-40 | 2.40e-02 | 0.0085 |
| 3643 | INSR | HTA11_2487_2000001011 | Human | Colorectum | SER | 1.51e-04 | 5.32e-01 | -0.1808 |
| 3643 | INSR | HTA11_1938_2000001011 | Human | Colorectum | AD | 2.06e-03 | 4.48e-01 | -0.0811 |
| 3643 | INSR | HTA11_347_2000001011 | Human | Colorectum | AD | 8.45e-22 | 9.71e-01 | -0.1954 |
| Page: 1 2 3 4 5 6 7 |
| Tissue | Expression Dynamics | Abbreviation |
| Breast | 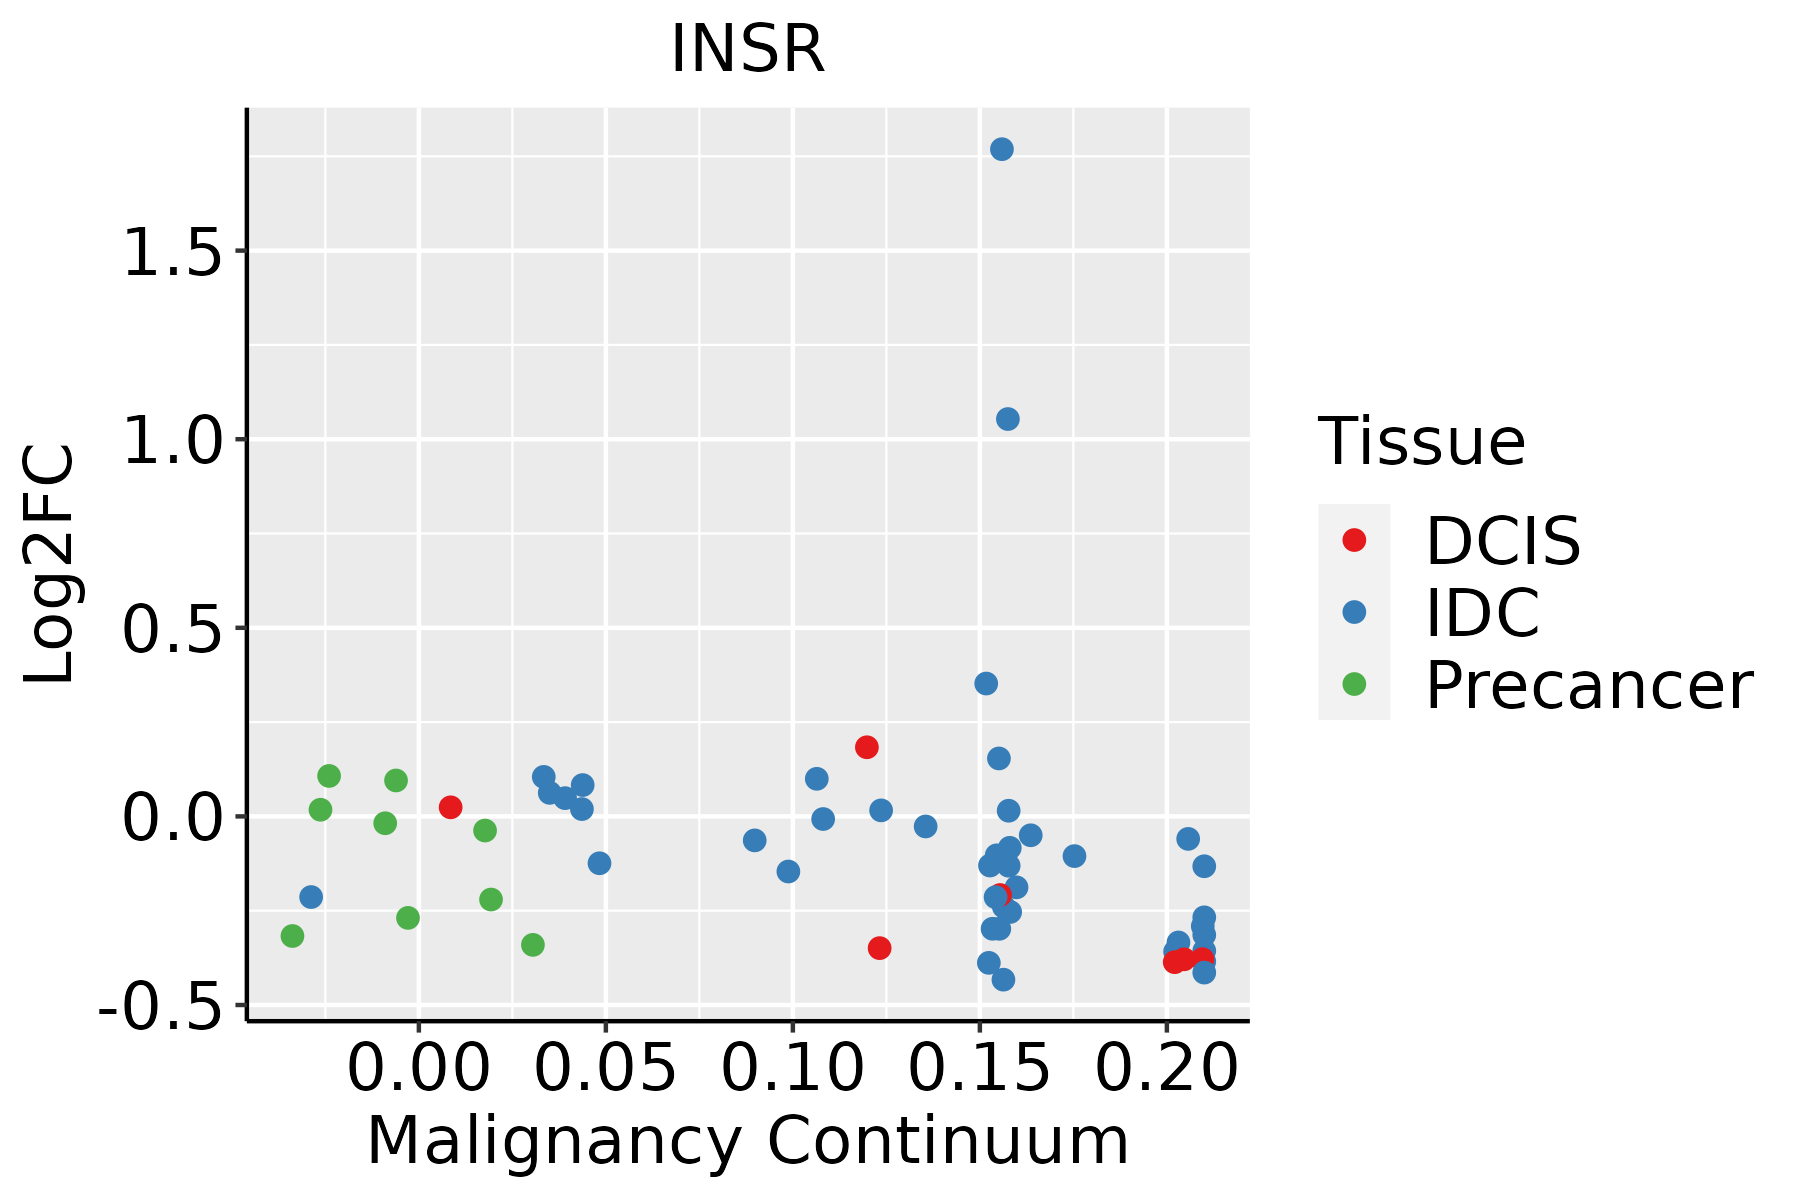 | IDC: Invasive ductal carcinoma |
| DCIS: Ductal carcinoma in situ | ||
| Precancer(BRCA1-mut): Precancerous lesion from BRCA1 mutation carriers | ||
| Colorectum (GSE201348) |  | FAP: Familial adenomatous polyposis |
| CRC: Colorectal cancer | ||
| Colorectum (HTA11) |  | AD: Adenomas |
| SER: Sessile serrated lesions | ||
| MSI-H: Microsatellite-high colorectal cancer | ||
| MSS: Microsatellite stable colorectal cancer | ||
| Endometrium | 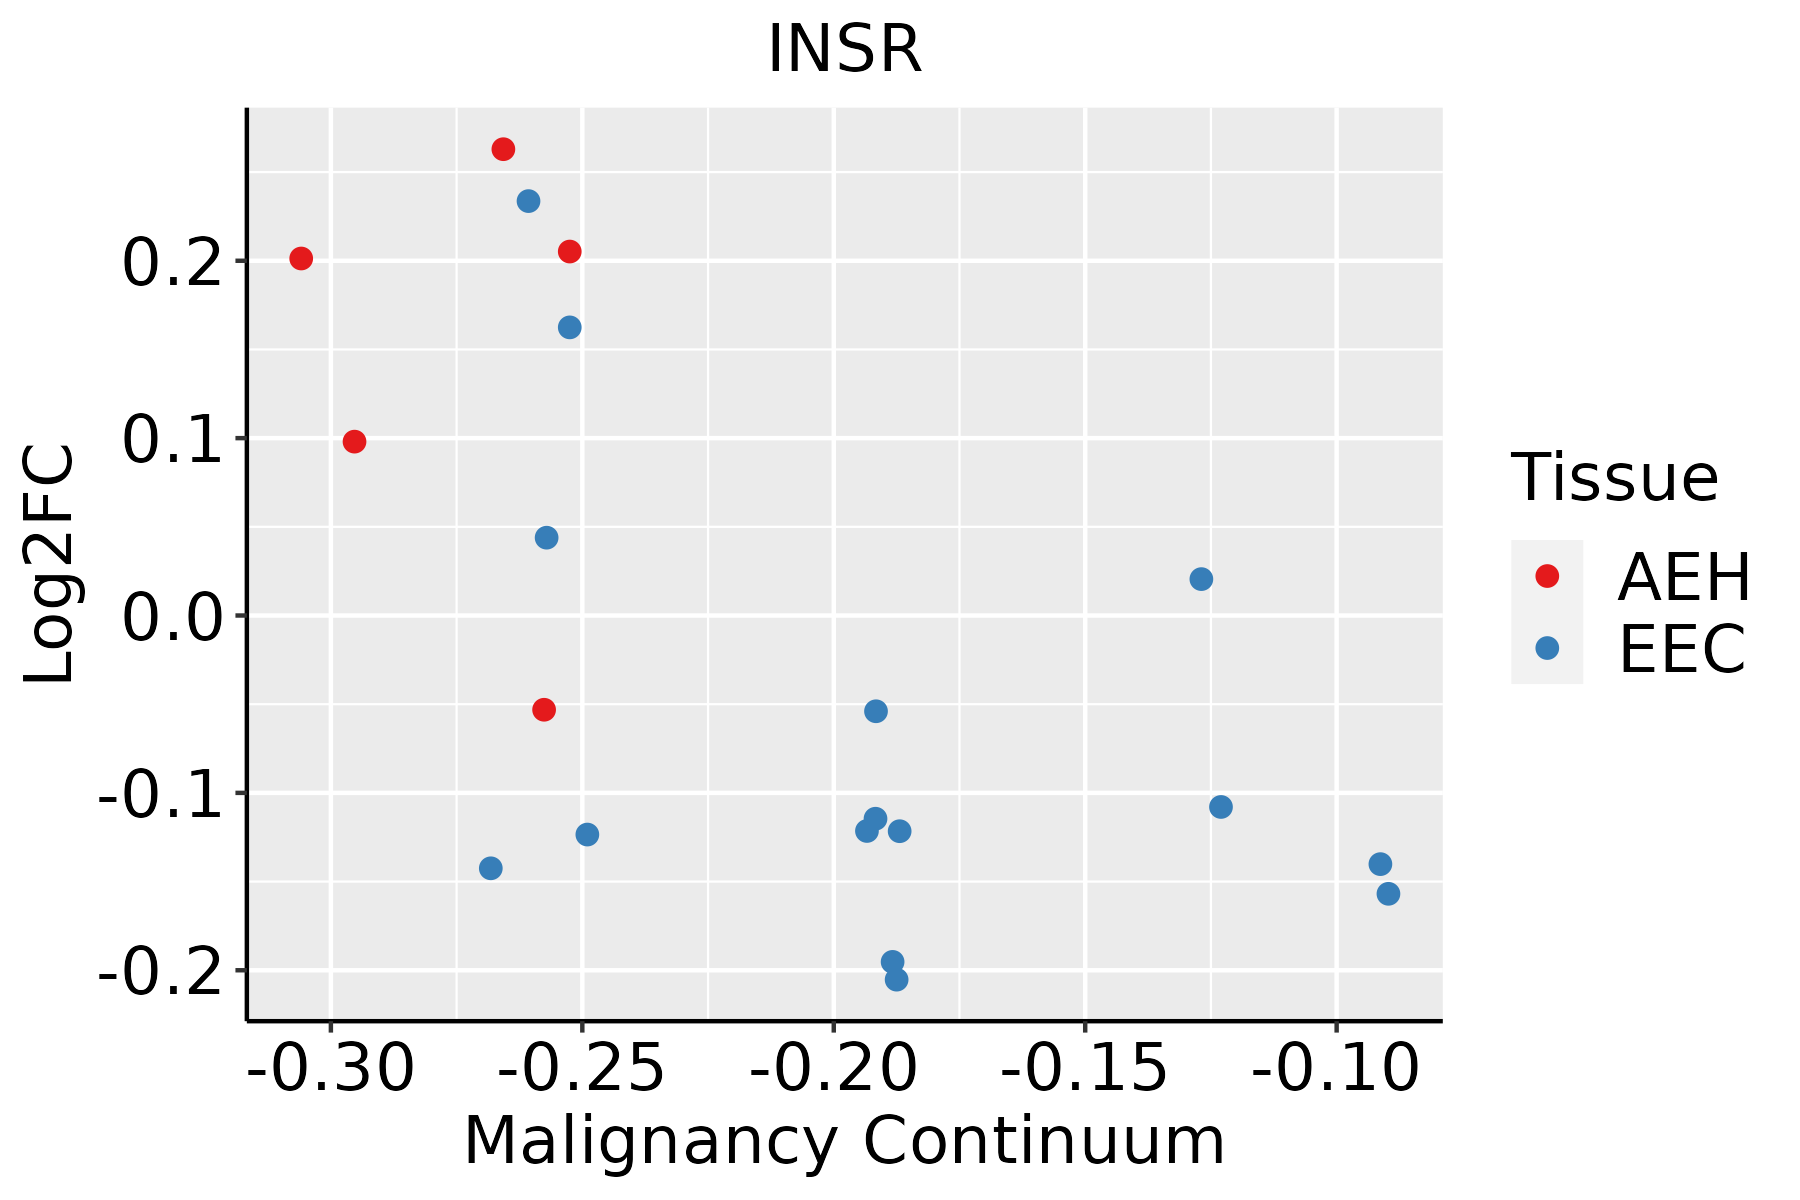 | AEH: Atypical endometrial hyperplasia |
| EEC: Endometrioid Cancer | ||
| GC |  | CAG: Chronic atrophic gastritis |
| CAG with IM: Chronic atrophic gastritis with intestinal metaplasia | ||
| CSG: Chronic superficial gastritis | ||
| GC: Gastric cancer | ||
| SIM: Severe intestinal metaplasia | ||
| WIM: Wild intestinal metaplasia | ||
| Liver |  | HCC: Hepatocellular carcinoma |
| NAFLD: Non-alcoholic fatty liver disease | ||
| Oral Cavity | 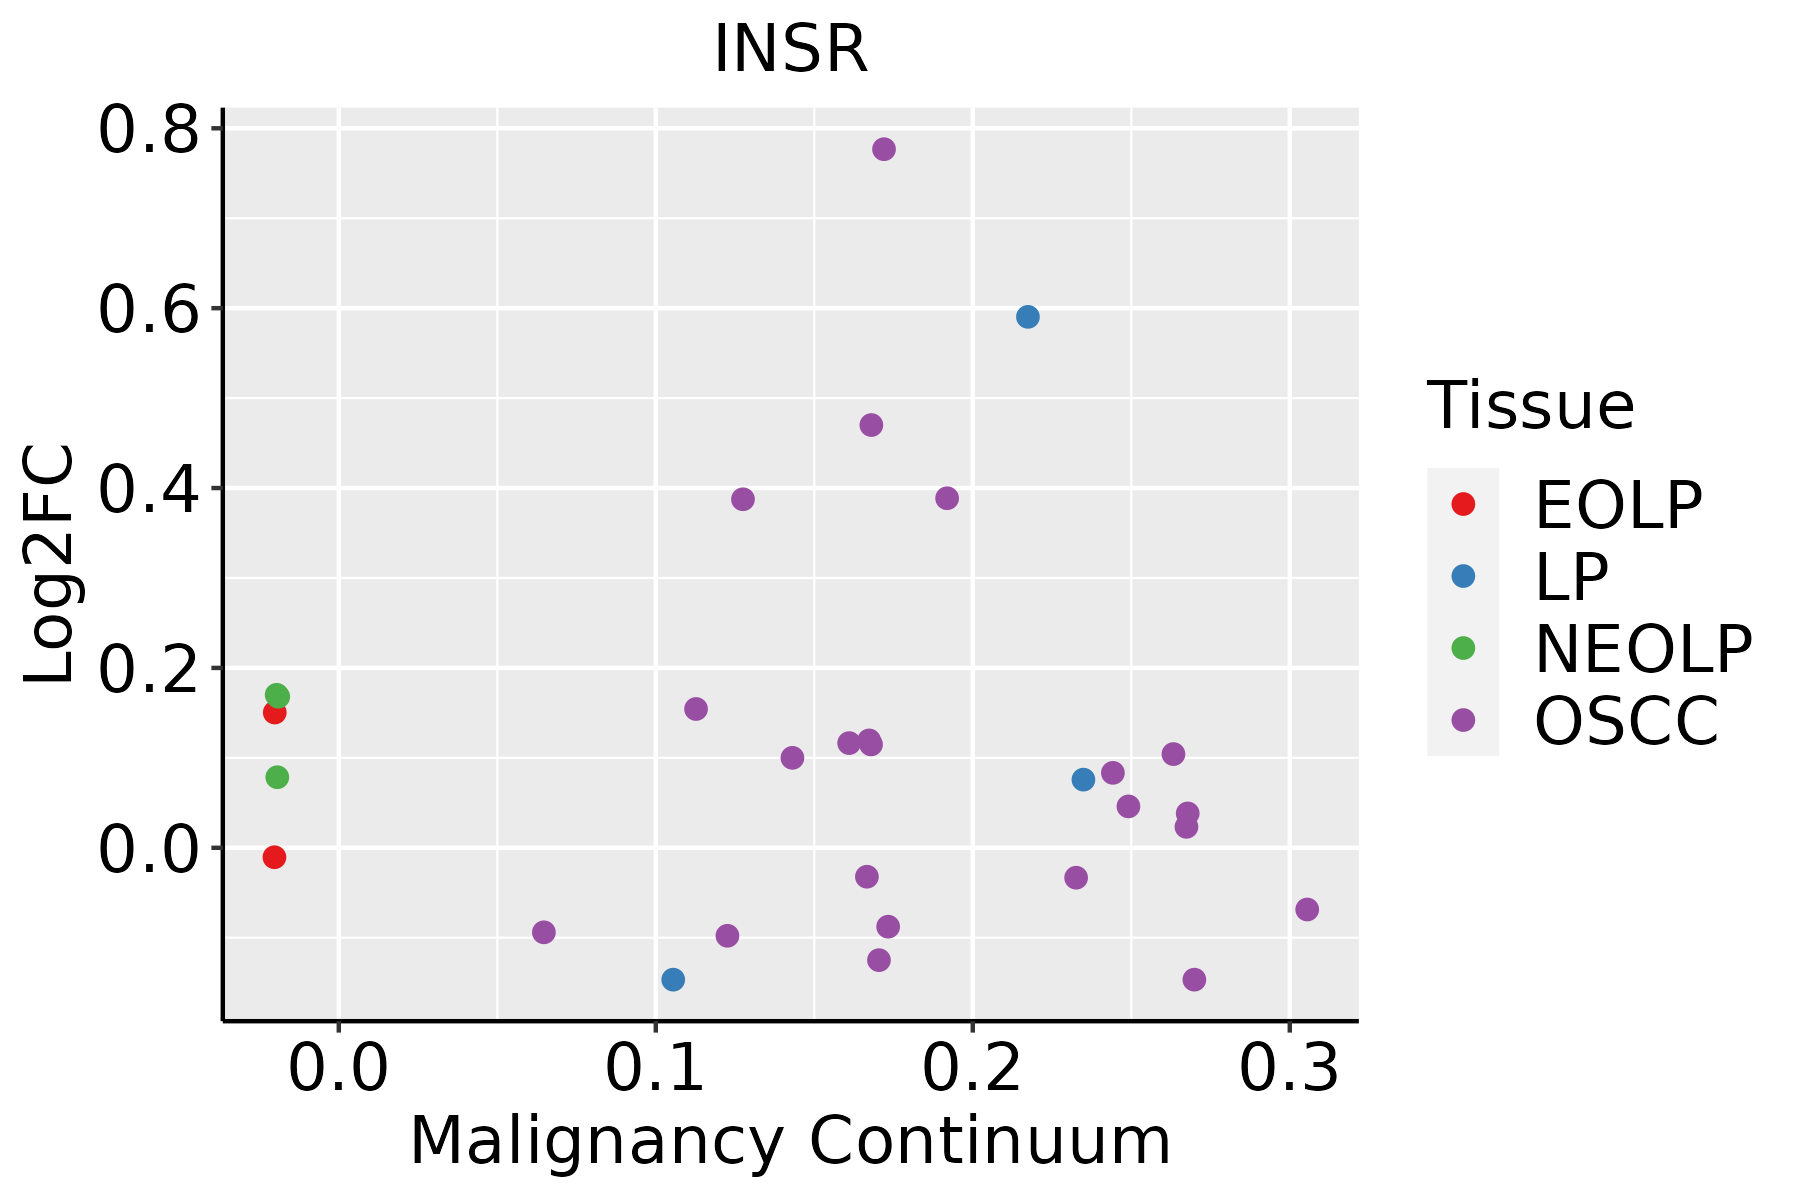 | EOLP: Erosive Oral lichen planus |
| LP: leukoplakia | ||
| NEOLP: Non-erosive oral lichen planus | ||
| OSCC: Oral squamous cell carcinoma | ||
| Thyroid |  | ATC: Anaplastic thyroid cancer |
| HT: Hashimoto's thyroiditis | ||
| PTC: Papillary thyroid cancer |
| ∗log2FC in expression of this searched gene in stem-like cells from each diseased tissue sample relative to stem-like cells in normal samples in each tissue plotted against the malignancy continuum. Samples are colored based on if they are from different disease stage. |
Top |
Malignant transformation related pathway analysis |
| Find out the enriched GO biological processes and KEGG pathways involved in transition from healthy to precancer to cancer |
| Tissue | Disease Stage | Enriched GO biological Processes |
| Colorectum | AD |  |
| Colorectum | SER |  |
| Colorectum | MSS |  |
| Colorectum | MSI-H |  |
| Colorectum | FAP |  |
| ∗Top 15 enriched GO BP terms are showed in the bar plot of each disease state in each tissue. Each row represents a significant GO biological process which is colored according to the -log10(p.adjust). |
| Page: 1 2 3 4 5 6 7 8 9 |
| GO ID | Tissue | Disease Stage | Description | Gene Ratio | Bg Ratio | pvalue | p.adjust | Count |
| GO:00460349 | Breast | Precancer | ATP metabolic process | 82/1080 | 277/18723 | 1.94e-36 | 5.19e-33 | 82 |
| GO:00060918 | Breast | Precancer | generation of precursor metabolites and energy | 94/1080 | 490/18723 | 1.54e-25 | 1.64e-22 | 94 |
| GO:00159808 | Breast | Precancer | energy derivation by oxidation of organic compounds | 70/1080 | 318/18723 | 8.33e-23 | 6.37e-20 | 70 |
| GO:00160329 | Breast | Precancer | viral process | 58/1080 | 415/18723 | 3.42e-10 | 3.16e-08 | 58 |
| GO:00444039 | Breast | Precancer | biological process involved in symbiotic interaction | 42/1080 | 290/18723 | 3.40e-08 | 2.11e-06 | 42 |
| GO:00196938 | Breast | Precancer | ribose phosphate metabolic process | 49/1080 | 396/18723 | 3.81e-07 | 1.78e-05 | 49 |
| GO:00091509 | Breast | Precancer | purine ribonucleotide metabolic process | 46/1080 | 368/18723 | 6.47e-07 | 2.71e-05 | 46 |
| GO:00517019 | Breast | Precancer | biological process involved in interaction with host | 31/1080 | 203/18723 | 6.52e-07 | 2.71e-05 | 31 |
| GO:00091179 | Breast | Precancer | nucleotide metabolic process | 56/1080 | 489/18723 | 7.40e-07 | 3.00e-05 | 56 |
| GO:00092598 | Breast | Precancer | ribonucleotide metabolic process | 47/1080 | 385/18723 | 9.69e-07 | 3.84e-05 | 47 |
| GO:00469398 | Breast | Precancer | nucleotide phosphorylation | 20/1080 | 101/18723 | 1.07e-06 | 4.18e-05 | 20 |
| GO:00067539 | Breast | Precancer | nucleoside phosphate metabolic process | 56/1080 | 497/18723 | 1.24e-06 | 4.70e-05 | 56 |
| GO:00061639 | Breast | Precancer | purine nucleotide metabolic process | 47/1080 | 396/18723 | 2.14e-06 | 7.50e-05 | 47 |
| GO:00091858 | Breast | Precancer | ribonucleoside diphosphate metabolic process | 20/1080 | 106/18723 | 2.37e-06 | 8.17e-05 | 20 |
| GO:00060968 | Breast | Precancer | glycolytic process | 17/1080 | 81/18723 | 2.94e-06 | 9.73e-05 | 17 |
| GO:00061658 | Breast | Precancer | nucleoside diphosphate phosphorylation | 19/1080 | 99/18723 | 3.23e-06 | 1.05e-04 | 19 |
| GO:00067578 | Breast | Precancer | ATP generation from ADP | 17/1080 | 82/18723 | 3.52e-06 | 1.13e-04 | 17 |
| GO:00434677 | Breast | Precancer | regulation of generation of precursor metabolites and energy | 22/1080 | 130/18723 | 4.95e-06 | 1.51e-04 | 22 |
| GO:00091328 | Breast | Precancer | nucleoside diphosphate metabolic process | 21/1080 | 124/18723 | 7.98e-06 | 2.17e-04 | 21 |
| GO:00725219 | Breast | Precancer | purine-containing compound metabolic process | 47/1080 | 416/18723 | 8.19e-06 | 2.20e-04 | 47 |
| Page: 1 2 3 4 5 6 7 8 9 10 11 12 13 14 15 16 17 18 19 20 21 22 23 24 25 26 27 28 29 30 31 32 33 34 35 36 37 38 39 40 41 42 43 44 45 46 47 48 49 50 51 52 53 54 55 56 57 58 59 60 61 62 63 64 65 66 67 68 69 70 71 72 73 74 75 |
| Pathway ID | Tissue | Disease Stage | Description | Gene Ratio | Bg Ratio | pvalue | p.adjust | qvalue | Count |
| hsa0501016 | Breast | Precancer | Alzheimer disease | 103/684 | 384/8465 | 1.03e-29 | 4.66e-28 | 3.57e-28 | 103 |
| hsa0541518 | Breast | Precancer | Diabetic cardiomyopathy | 63/684 | 203/8465 | 5.63e-22 | 1.48e-20 | 1.14e-20 | 63 |
| hsa0493216 | Breast | Precancer | Non-alcoholic fatty liver disease | 48/684 | 155/8465 | 6.16e-17 | 1.50e-15 | 1.15e-15 | 48 |
| hsa0406616 | Breast | Precancer | HIF-1 signaling pathway | 23/684 | 109/8465 | 1.51e-05 | 1.59e-04 | 1.22e-04 | 23 |
| hsa0501017 | Breast | Precancer | Alzheimer disease | 103/684 | 384/8465 | 1.03e-29 | 4.66e-28 | 3.57e-28 | 103 |
| hsa0541519 | Breast | Precancer | Diabetic cardiomyopathy | 63/684 | 203/8465 | 5.63e-22 | 1.48e-20 | 1.14e-20 | 63 |
| hsa0493217 | Breast | Precancer | Non-alcoholic fatty liver disease | 48/684 | 155/8465 | 6.16e-17 | 1.50e-15 | 1.15e-15 | 48 |
| hsa0406617 | Breast | Precancer | HIF-1 signaling pathway | 23/684 | 109/8465 | 1.51e-05 | 1.59e-04 | 1.22e-04 | 23 |
| hsa0501023 | Breast | IDC | Alzheimer disease | 107/867 | 384/8465 | 1.70e-23 | 7.88e-22 | 5.90e-22 | 107 |
| hsa0541523 | Breast | IDC | Diabetic cardiomyopathy | 67/867 | 203/8465 | 3.17e-19 | 8.59e-18 | 6.43e-18 | 67 |
| hsa0493223 | Breast | IDC | Non-alcoholic fatty liver disease | 50/867 | 155/8465 | 3.48e-14 | 8.08e-13 | 6.05e-13 | 50 |
| hsa0406623 | Breast | IDC | HIF-1 signaling pathway | 22/867 | 109/8465 | 1.36e-03 | 1.00e-02 | 7.50e-03 | 22 |
| hsa0501033 | Breast | IDC | Alzheimer disease | 107/867 | 384/8465 | 1.70e-23 | 7.88e-22 | 5.90e-22 | 107 |
| hsa0541533 | Breast | IDC | Diabetic cardiomyopathy | 67/867 | 203/8465 | 3.17e-19 | 8.59e-18 | 6.43e-18 | 67 |
| hsa0493233 | Breast | IDC | Non-alcoholic fatty liver disease | 50/867 | 155/8465 | 3.48e-14 | 8.08e-13 | 6.05e-13 | 50 |
| hsa0406633 | Breast | IDC | HIF-1 signaling pathway | 22/867 | 109/8465 | 1.36e-03 | 1.00e-02 | 7.50e-03 | 22 |
| hsa0501043 | Breast | DCIS | Alzheimer disease | 105/846 | 384/8465 | 3.23e-23 | 1.49e-21 | 1.10e-21 | 105 |
| hsa0541543 | Breast | DCIS | Diabetic cardiomyopathy | 65/846 | 203/8465 | 1.81e-18 | 4.87e-17 | 3.59e-17 | 65 |
| hsa0493243 | Breast | DCIS | Non-alcoholic fatty liver disease | 49/846 | 155/8465 | 5.87e-14 | 1.35e-12 | 9.97e-13 | 49 |
| hsa0406642 | Breast | DCIS | HIF-1 signaling pathway | 22/846 | 109/8465 | 9.83e-04 | 7.05e-03 | 5.20e-03 | 22 |
| Page: 1 2 3 4 5 6 7 8 9 10 11 12 13 14 15 16 |
Top |
Cell-cell communication analysis |
| Identification of potential cell-cell interactions between two cell types and their ligand-receptor pairs for different disease states |
| Ligand | Receptor | LRpair | Pathway | Tissue | Disease Stage |
| NAMPT | INSR | NAMPT_INSR | VISFATIN | Breast | ADJ |
| NAMPT | INSR | NAMPT_INSR | VISFATIN | Breast | Healthy |
| NAMPT | INSR | NAMPT_INSR | VISFATIN | Breast | IDC |
| NAMPT | INSR | NAMPT_INSR | VISFATIN | Breast | Precancer |
| NAMPT | INSR | NAMPT_INSR | VISFATIN | Cervix | ADJ |
| NAMPT | INSR | NAMPT_INSR | VISFATIN | Cervix | Healthy |
| NAMPT | INSR | NAMPT_INSR | VISFATIN | Cervix | Precancer |
| NAMPT | INSR | NAMPT_INSR | VISFATIN | CRC | ADJ |
| NAMPT | INSR | NAMPT_INSR | VISFATIN | CRC | CRC |
| NAMPT | INSR | NAMPT_INSR | VISFATIN | CRC | FAP |
| NAMPT | INSR | NAMPT_INSR | VISFATIN | CRC | Healthy |
| NAMPT | INSR | NAMPT_INSR | VISFATIN | CRC | MSI-H |
| NAMPT | INSR | NAMPT_INSR | VISFATIN | CRC | MSS |
| NAMPT | INSR | NAMPT_INSR | VISFATIN | Endometrium | ADJ |
| NAMPT | INSR | NAMPT_INSR | VISFATIN | Endometrium | AEH |
| NAMPT | INSR | NAMPT_INSR | VISFATIN | Endometrium | EEC |
| NAMPT | INSR | NAMPT_INSR | VISFATIN | Endometrium | Healthy |
| NAMPT | INSR | NAMPT_INSR | VISFATIN | Esophagus | ESCC |
| NAMPT | INSR | NAMPT_INSR | VISFATIN | GC | ADJ |
| NAMPT | INSR | NAMPT_INSR | VISFATIN | GC | GC |
| Page: 1 |
Top |
Single-cell gene regulatory network inference analysis |
| Find out the significant the regulons (TFs) and the target genes of each regulon across cell types for different disease states |
| TF | Cell Type | Tissue | Disease Stage | Target Gene | RSS | Regulon Activity |
| ∗The dot plots of a searched regulon are shown for all cell subpopulations in each disease state of each tissue based on the regulon specific score inferred using pySCENIC and by calculating the average expression. |
| Page: 1 |
Top |
Somatic mutation of malignant transformation related genes |
| Annotation of somatic variants for genes involved in malignant transformation |
| Hugo Symbol | Variant Class | Variant Classification | dbSNP RS | HGVSc | HGVSp | HGVSp Short | SWISSPROT | BIOTYPE | SIFT | PolyPhen | Tumor Sample Barcode | Tissue | Histology | Sex | Age | Stage | Therapy Types | Drugs | Outcome |
| INSR | SNV | Missense_Mutation | c.3652N>C | p.Asp1218His | p.D1218H | P06213 | protein_coding | deleterious(0) | probably_damaging(1) | TCGA-AC-A23H-01 | Breast | breast invasive carcinoma | Female | >=65 | I/II | Unknown | Unknown | PD | |
| INSR | SNV | Missense_Mutation | c.3556N>C | p.Glu1186Gln | p.E1186Q | P06213 | protein_coding | deleterious(0) | probably_damaging(0.985) | TCGA-AC-A23H-01 | Breast | breast invasive carcinoma | Female | >=65 | I/II | Unknown | Unknown | PD | |
| INSR | SNV | Missense_Mutation | c.2585N>C | p.Phe862Ser | p.F862S | P06213 | protein_coding | tolerated(0.88) | benign(0) | TCGA-AN-A0AK-01 | Breast | breast invasive carcinoma | Female | >=65 | I/II | Unknown | Unknown | SD | |
| INSR | SNV | Missense_Mutation | c.1889N>T | p.Ser630Leu | p.S630L | P06213 | protein_coding | deleterious(0.01) | possibly_damaging(0.459) | TCGA-AN-A0XW-01 | Breast | breast invasive carcinoma | Female | <65 | III/IV | Unknown | Unknown | SD | |
| INSR | SNV | Missense_Mutation | c.487N>G | p.Ile163Val | p.I163V | P06213 | protein_coding | tolerated(0.06) | benign(0.123) | TCGA-D8-A13Z-01 | Breast | breast invasive carcinoma | Female | <65 | I/II | Chemotherapy | doxorubicine | SD | |
| INSR | SNV | Missense_Mutation | c.2072C>G | p.Ser691Cys | p.S691C | P06213 | protein_coding | tolerated(0.06) | benign(0.005) | TCGA-GM-A2D9-01 | Breast | breast invasive carcinoma | Female | >=65 | I/II | Hormone Therapy | arimidex | SD | |
| INSR | insertion | In_Frame_Ins | novel | c.2752_2753insTGGCACAATCTCAGCTCACTGTAGCCTCCGCCTCCCGGGTTCAAG | p.Pro918delinsLeuAlaGlnSerGlnLeuThrValAlaSerAlaSerArgValGlnAla | p.P918delinsLAQSQLTVASASRVQA | P06213 | protein_coding | TCGA-A8-A08H-01 | Breast | breast invasive carcinoma | Female | >=65 | I/II | Unknown | Unknown | SD | ||
| INSR | insertion | Frame_Shift_Ins | novel | c.1227_1228insAGAAAATGTATTGA | p.Leu412CysfsTer8 | p.L412Cfs*8 | P06213 | protein_coding | TCGA-AN-A0FS-01 | Breast | breast invasive carcinoma | Female | <65 | I/II | Unknown | Unknown | SD | ||
| INSR | insertion | Frame_Shift_Ins | novel | c.1226_1227insGGGAAGTGACTGCCAAGTTGAAGTTAGGAGTG | p.Phe409LeufsTer17 | p.F409Lfs*17 | P06213 | protein_coding | TCGA-AN-A0FS-01 | Breast | breast invasive carcinoma | Female | <65 | I/II | Unknown | Unknown | SD | ||
| INSR | deletion | Frame_Shift_Del | novel | c.2222delN | p.Phe741SerfsTer30 | p.F741Sfs*30 | P06213 | protein_coding | TCGA-AR-A251-01 | Breast | breast invasive carcinoma | Female | <65 | III/IV | Chemotherapy | doxorubicin | SD |
| Page: 1 2 3 4 5 6 7 8 9 10 11 12 13 14 15 16 |
Top |
Related drugs of malignant transformation related genes |
| Identification of chemicals and drugs interact with genes involved in malignant transfromation |
| (DGIdb 4.0) |
| Entrez ID | Symbol | Category | Interaction Types | Drug Claim Name | Drug Name | PMIDs |
| 3643 | INSR | CLINICALLY ACTIONABLE, TYROSINE KINASE, EXTERNAL SIDE OF PLASMA MEMBRANE, TRANSPORTER, TRANSCRIPTION FACTOR, KINASE, ENZYME, DRUGGABLE GENOME | Metformin glycinate | 22974412 | ||
| 3643 | INSR | CLINICALLY ACTIONABLE, TYROSINE KINASE, EXTERNAL SIDE OF PLASMA MEMBRANE, TRANSPORTER, TRANSCRIPTION FACTOR, KINASE, ENZYME, DRUGGABLE GENOME | agonist | CHEMBL1201644 | INSULIN ZINC SUSP RECOMBINANT HUMAN | |
| 3643 | INSR | CLINICALLY ACTIONABLE, TYROSINE KINASE, EXTERNAL SIDE OF PLASMA MEMBRANE, TRANSPORTER, TRANSCRIPTION FACTOR, KINASE, ENZYME, DRUGGABLE GENOME | agonist | CHEMBL1201638 | INSULIN SUSP PROTAMINE ZINC PURIFIED PORK | |
| 3643 | INSR | CLINICALLY ACTIONABLE, TYROSINE KINASE, EXTERNAL SIDE OF PLASMA MEMBRANE, TRANSPORTER, TRANSCRIPTION FACTOR, KINASE, ENZYME, DRUGGABLE GENOME | ILORASERTIB | ILORASERTIB | ||
| 3643 | INSR | CLINICALLY ACTIONABLE, TYROSINE KINASE, EXTERNAL SIDE OF PLASMA MEMBRANE, TRANSPORTER, TRANSCRIPTION FACTOR, KINASE, ENZYME, DRUGGABLE GENOME | agonist | CHEMBL1201639 | INSULIN ZINC SUSP BEEF | |
| 3643 | INSR | CLINICALLY ACTIONABLE, TYROSINE KINASE, EXTERNAL SIDE OF PLASMA MEMBRANE, TRANSPORTER, TRANSCRIPTION FACTOR, KINASE, ENZYME, DRUGGABLE GENOME | agonist | CHEMBL1201496 | INSULIN ASPART | |
| 3643 | INSR | CLINICALLY ACTIONABLE, TYROSINE KINASE, EXTERNAL SIDE OF PLASMA MEMBRANE, TRANSPORTER, TRANSCRIPTION FACTOR, KINASE, ENZYME, DRUGGABLE GENOME | inhibitor | BMS-754807 | BMS-754807 | |
| 3643 | INSR | CLINICALLY ACTIONABLE, TYROSINE KINASE, EXTERNAL SIDE OF PLASMA MEMBRANE, TRANSPORTER, TRANSCRIPTION FACTOR, KINASE, ENZYME, DRUGGABLE GENOME | CENISERTIB | CENISERTIB | ||
| 3643 | INSR | CLINICALLY ACTIONABLE, TYROSINE KINASE, EXTERNAL SIDE OF PLASMA MEMBRANE, TRANSPORTER, TRANSCRIPTION FACTOR, KINASE, ENZYME, DRUGGABLE GENOME | Insulin-lispro | |||
| 3643 | INSR | CLINICALLY ACTIONABLE, TYROSINE KINASE, EXTERNAL SIDE OF PLASMA MEMBRANE, TRANSPORTER, TRANSCRIPTION FACTOR, KINASE, ENZYME, DRUGGABLE GENOME | AEW-541 | AEW-541 |
| Page: 1 2 3 4 5 6 7 8 9 10 11 |

Copyright 2023-Present -The University of Texas Health Science Center at Houston |