
|
|||||
|
 | |
| |
| |
| |
| |
| |
|
Gene: INSIG2 |
Gene summary for INSIG2 |
| Gene information | Species | Human | Gene symbol | INSIG2 | Gene ID | 51141 |
| Gene name | insulin induced gene 2 | |
| Gene Alias | INSIG-2 | |
| Cytomap | 2q14.1-q14.2 | |
| Gene Type | protein-coding | GO ID | GO:0001501 | UniProtAcc | A0A024RAI2 |
Top |
Malignant transformation analysis |
| Identification of the aberrant gene expression in precancerous and cancerous lesions by comparing the gene expression of stem-like cells in diseased tissues with normal stem cells |
| Entrez ID | Symbol | Replicates | Species | Organ | Tissue | Adj P-value | Log2FC | Malignancy |
| 51141 | INSIG2 | GSM4909296 | Human | Breast | IDC | 6.97e-03 | -1.15e-01 | 0.1524 |
| 51141 | INSIG2 | GSM4909301 | Human | Breast | IDC | 7.26e-03 | -1.21e-01 | 0.1577 |
| 51141 | INSIG2 | GSM4909302 | Human | Breast | IDC | 6.39e-05 | -1.47e-01 | 0.1545 |
| 51141 | INSIG2 | GSM4909311 | Human | Breast | IDC | 2.13e-09 | -1.07e-01 | 0.1534 |
| 51141 | INSIG2 | GSM4909319 | Human | Breast | IDC | 1.78e-08 | -1.51e-01 | 0.1563 |
| 51141 | INSIG2 | GSM4909321 | Human | Breast | IDC | 1.41e-05 | -1.38e-01 | 0.1559 |
| 51141 | INSIG2 | ctrl6 | Human | Breast | Precancer | 3.36e-08 | 5.47e-01 | -0.0061 |
| 51141 | INSIG2 | brca1 | Human | Breast | Precancer | 1.20e-02 | 3.17e-01 | -0.0338 |
| 51141 | INSIG2 | brca3 | Human | Breast | Precancer | 1.88e-11 | 4.68e-01 | -0.0263 |
| 51141 | INSIG2 | brca10 | Human | Breast | Precancer | 1.38e-06 | 4.19e-01 | -0.0029 |
| 51141 | INSIG2 | NCCBC14 | Human | Breast | DCIS | 3.06e-02 | 8.68e-02 | 0.2021 |
| 51141 | INSIG2 | NCCBC3 | Human | Breast | DCIS | 4.70e-03 | -1.23e-02 | 0.1198 |
| 51141 | INSIG2 | NCCBC5 | Human | Breast | DCIS | 3.38e-02 | -8.35e-02 | 0.2046 |
| 51141 | INSIG2 | P1 | Human | Breast | IDC | 8.85e-05 | -8.61e-02 | 0.1527 |
| 51141 | INSIG2 | DCIS2 | Human | Breast | DCIS | 7.27e-34 | 1.51e-02 | 0.0085 |
| 51141 | INSIG2 | LZE4T | Human | Esophagus | ESCC | 7.12e-07 | 3.24e-01 | 0.0811 |
| 51141 | INSIG2 | LZE7T | Human | Esophagus | ESCC | 1.09e-05 | 2.54e-01 | 0.0667 |
| 51141 | INSIG2 | LZE8T | Human | Esophagus | ESCC | 1.96e-07 | 1.54e-01 | 0.067 |
| 51141 | INSIG2 | LZE24T | Human | Esophagus | ESCC | 3.39e-15 | 1.86e-01 | 0.0596 |
| 51141 | INSIG2 | LZE6T | Human | Esophagus | ESCC | 5.56e-03 | 1.73e-01 | 0.0845 |
| Page: 1 2 3 4 5 6 |
| Tissue | Expression Dynamics | Abbreviation |
| Breast |  | IDC: Invasive ductal carcinoma |
| DCIS: Ductal carcinoma in situ | ||
| Precancer(BRCA1-mut): Precancerous lesion from BRCA1 mutation carriers | ||
| Esophagus |  | ESCC: Esophageal squamous cell carcinoma |
| HGIN: High-grade intraepithelial neoplasias | ||
| LGIN: Low-grade intraepithelial neoplasias | ||
| Liver |  | HCC: Hepatocellular carcinoma |
| NAFLD: Non-alcoholic fatty liver disease | ||
| Oral Cavity | 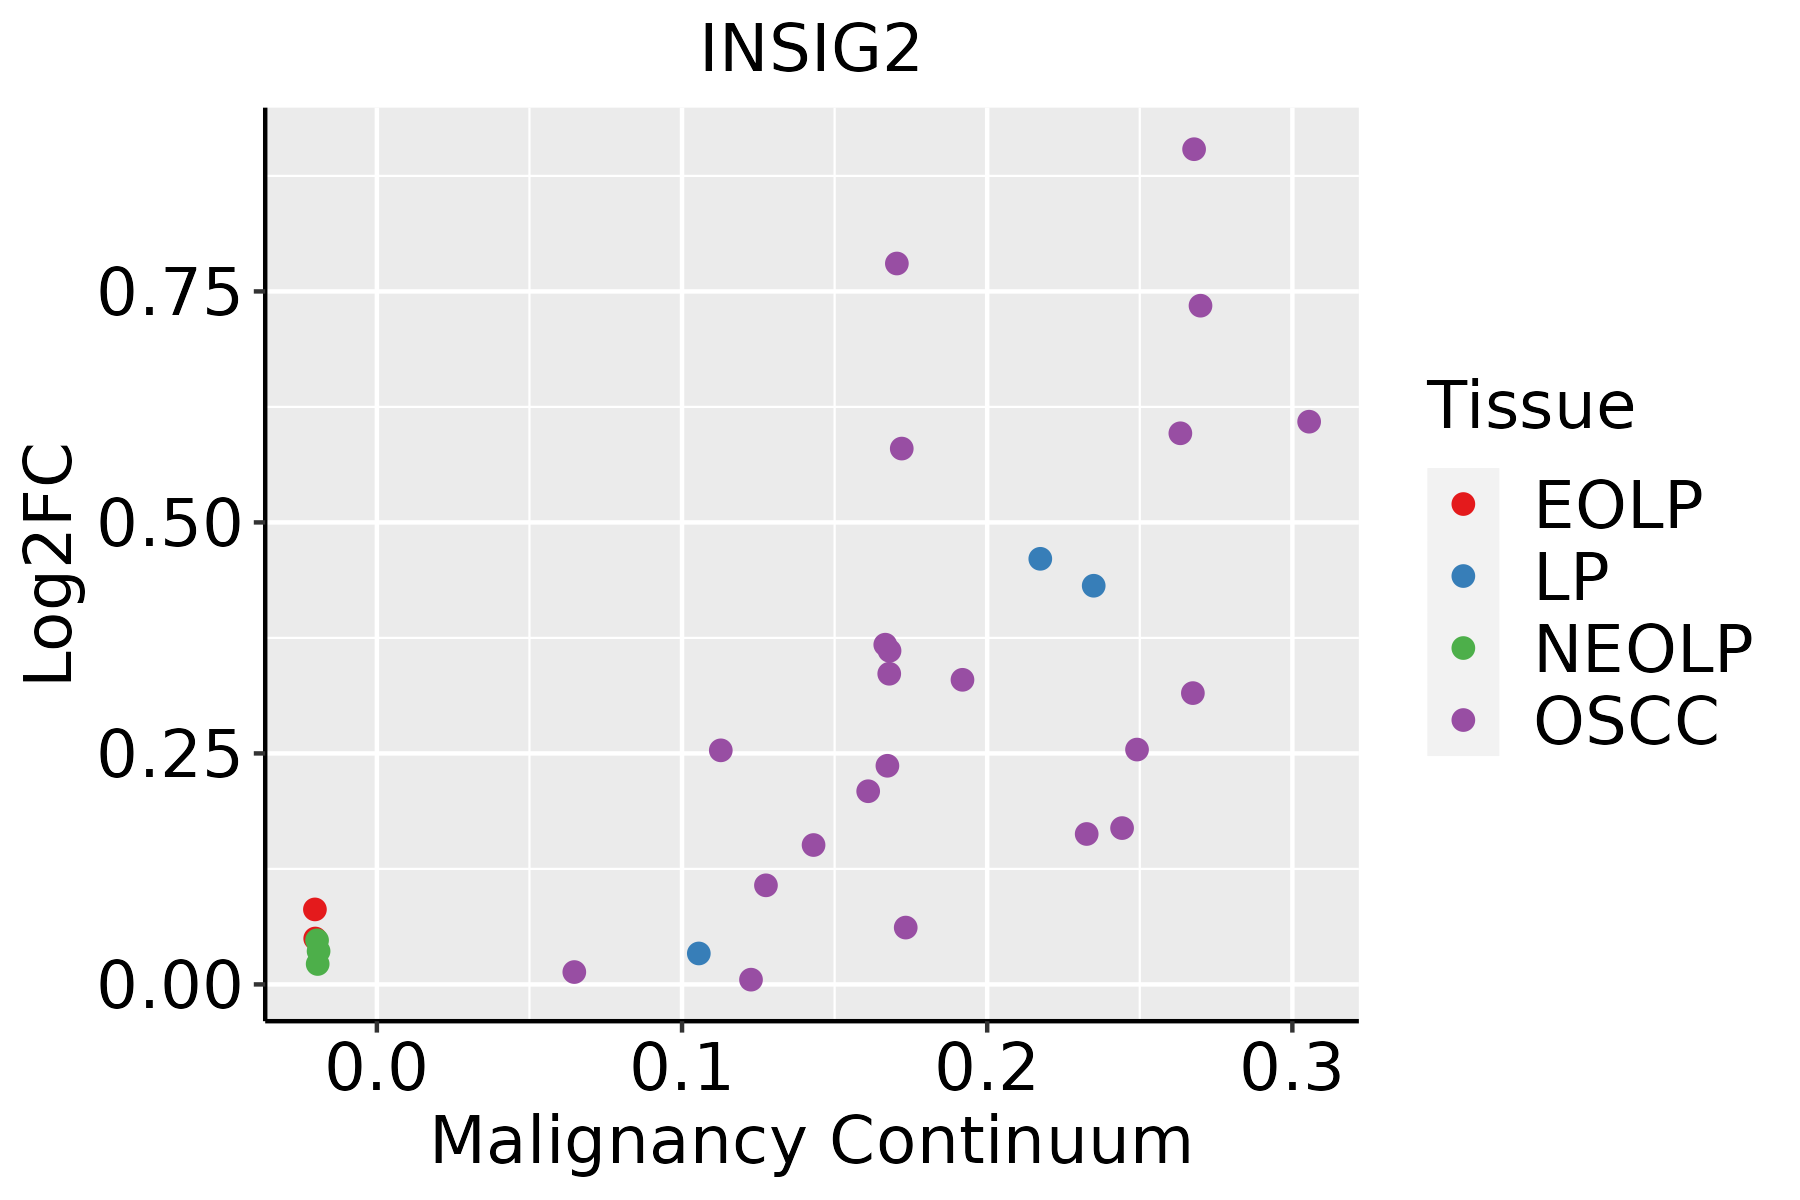 | EOLP: Erosive Oral lichen planus |
| LP: leukoplakia | ||
| NEOLP: Non-erosive oral lichen planus | ||
| OSCC: Oral squamous cell carcinoma | ||
| Thyroid |  | ATC: Anaplastic thyroid cancer |
| HT: Hashimoto's thyroiditis | ||
| PTC: Papillary thyroid cancer |
| ∗log2FC in expression of this searched gene in stem-like cells from each diseased tissue sample relative to stem-like cells in normal samples in each tissue plotted against the malignancy continuum. Samples are colored based on if they are from different disease stage. |
Top |
Malignant transformation related pathway analysis |
| Find out the enriched GO biological processes and KEGG pathways involved in transition from healthy to precancer to cancer |
| Tissue | Disease Stage | Enriched GO biological Processes |
| Colorectum | AD |  |
| Colorectum | SER |  |
| Colorectum | MSS |  |
| Colorectum | MSI-H |  |
| Colorectum | FAP |  |
| ∗Top 15 enriched GO BP terms are showed in the bar plot of each disease state in each tissue. Each row represents a significant GO biological process which is colored according to the -log10(p.adjust). |
| Page: 1 2 3 4 5 6 7 8 9 |
| GO ID | Tissue | Disease Stage | Description | Gene Ratio | Bg Ratio | pvalue | p.adjust | Count |
| GO:00451859 | Breast | Precancer | maintenance of protein location | 19/1080 | 94/18723 | 1.43e-06 | 5.35e-05 | 19 |
| GO:00512358 | Breast | Precancer | maintenance of location | 40/1080 | 327/18723 | 5.85e-06 | 1.71e-04 | 40 |
| GO:00516519 | Breast | Precancer | maintenance of location in cell | 30/1080 | 214/18723 | 5.91e-06 | 1.71e-04 | 30 |
| GO:00325076 | Breast | Precancer | maintenance of protein location in cell | 14/1080 | 65/18723 | 1.59e-05 | 3.89e-04 | 14 |
| GO:00709725 | Breast | Precancer | protein localization to endoplasmic reticulum | 15/1080 | 74/18723 | 1.74e-05 | 4.17e-04 | 15 |
| GO:00725954 | Breast | Precancer | maintenance of protein localization in organelle | 10/1080 | 42/18723 | 1.06e-04 | 1.93e-03 | 10 |
| GO:00192164 | Breast | Precancer | regulation of lipid metabolic process | 34/1080 | 331/18723 | 8.14e-04 | 9.55e-03 | 34 |
| GO:00463946 | Breast | Precancer | carboxylic acid biosynthetic process | 32/1080 | 314/18723 | 1.30e-03 | 1.38e-02 | 32 |
| GO:00723304 | Breast | Precancer | monocarboxylic acid biosynthetic process | 24/1080 | 214/18723 | 1.41e-03 | 1.48e-02 | 24 |
| GO:00160536 | Breast | Precancer | organic acid biosynthetic process | 32/1080 | 316/18723 | 1.44e-03 | 1.50e-02 | 32 |
| GO:00066335 | Breast | Precancer | fatty acid biosynthetic process | 19/1080 | 163/18723 | 2.74e-03 | 2.42e-02 | 19 |
| GO:00620126 | Breast | Precancer | regulation of small molecule metabolic process | 32/1080 | 334/18723 | 3.45e-03 | 2.87e-02 | 32 |
| GO:00069845 | Breast | Precancer | ER-nucleus signaling pathway | 8/1080 | 46/18723 | 4.40e-03 | 3.43e-02 | 8 |
| GO:00423044 | Breast | Precancer | regulation of fatty acid biosynthetic process | 8/1080 | 49/18723 | 6.53e-03 | 4.51e-02 | 8 |
| GO:00354373 | Breast | Precancer | maintenance of protein localization in endoplasmic reticulum | 4/1080 | 14/18723 | 6.92e-03 | 4.67e-02 | 4 |
| GO:005165114 | Breast | IDC | maintenance of location in cell | 37/1434 | 214/18723 | 2.39e-06 | 9.35e-05 | 37 |
| GO:004518514 | Breast | IDC | maintenance of protein location | 21/1434 | 94/18723 | 6.69e-06 | 2.05e-04 | 21 |
| GO:007097213 | Breast | IDC | protein localization to endoplasmic reticulum | 18/1434 | 74/18723 | 8.58e-06 | 2.47e-04 | 18 |
| GO:005123513 | Breast | IDC | maintenance of location | 48/1434 | 327/18723 | 9.90e-06 | 2.77e-04 | 48 |
| GO:003250714 | Breast | IDC | maintenance of protein location in cell | 16/1434 | 65/18723 | 2.29e-05 | 5.51e-04 | 16 |
| Page: 1 2 3 4 5 6 7 8 9 10 11 12 13 14 15 |
| Pathway ID | Tissue | Disease Stage | Description | Gene Ratio | Bg Ratio | pvalue | p.adjust | qvalue | Count |
| Page: 1 |
Top |
Cell-cell communication analysis |
| Identification of potential cell-cell interactions between two cell types and their ligand-receptor pairs for different disease states |
| Ligand | Receptor | LRpair | Pathway | Tissue | Disease Stage |
| Page: 1 |
Top |
Single-cell gene regulatory network inference analysis |
| Find out the significant the regulons (TFs) and the target genes of each regulon across cell types for different disease states |
| TF | Cell Type | Tissue | Disease Stage | Target Gene | RSS | Regulon Activity |
| ∗The dot plots of a searched regulon are shown for all cell subpopulations in each disease state of each tissue based on the regulon specific score inferred using pySCENIC and by calculating the average expression. |
| Page: 1 |
Top |
Somatic mutation of malignant transformation related genes |
| Annotation of somatic variants for genes involved in malignant transformation |
| Hugo Symbol | Variant Class | Variant Classification | dbSNP RS | HGVSc | HGVSp | HGVSp Short | SWISSPROT | BIOTYPE | SIFT | PolyPhen | Tumor Sample Barcode | Tissue | Histology | Sex | Age | Stage | Therapy Types | Drugs | Outcome |
| INSIG2 | SNV | Missense_Mutation | novel | c.439N>G | p.Thr147Ala | p.T147A | Q9Y5U4 | protein_coding | tolerated(0.54) | probably_damaging(0.983) | TCGA-A2-A0T1-01 | Breast | breast invasive carcinoma | Female | <65 | III/IV | Targeted Molecular therapy | herceptin | SD |
| INSIG2 | SNV | Missense_Mutation | rs758358013 | c.382N>A | p.Asp128Asn | p.D128N | Q9Y5U4 | protein_coding | deleterious(0.04) | benign(0.083) | TCGA-AN-A0FX-01 | Breast | breast invasive carcinoma | Female | <65 | I/II | Unknown | Unknown | SD |
| INSIG2 | SNV | Missense_Mutation | c.565N>T | p.Arg189Cys | p.R189C | Q9Y5U4 | protein_coding | deleterious(0) | benign(0.007) | TCGA-D8-A1JA-01 | Breast | breast invasive carcinoma | Female | <65 | III/IV | Chemotherapy | adriamycin | PD | |
| INSIG2 | SNV | Missense_Mutation | c.365G>A | p.Ser122Asn | p.S122N | Q9Y5U4 | protein_coding | tolerated(0.07) | benign(0.095) | TCGA-E2-A15J-01 | Breast | breast invasive carcinoma | Female | <65 | I/II | Chemotherapy | docetaxel | SD | |
| INSIG2 | SNV | Missense_Mutation | novel | c.362C>T | p.Ala121Val | p.A121V | Q9Y5U4 | protein_coding | deleterious(0) | benign(0.183) | TCGA-2W-A8YY-01 | Cervix | cervical & endocervical cancer | Female | <65 | I/II | Chemotherapy | cisplatin | CR |
| INSIG2 | SNV | Missense_Mutation | c.623G>A | p.Arg208Gln | p.R208Q | Q9Y5U4 | protein_coding | deleterious(0) | probably_damaging(0.988) | TCGA-2W-A8YY-01 | Cervix | cervical & endocervical cancer | Female | <65 | I/II | Chemotherapy | cisplatin | CR | |
| INSIG2 | SNV | Missense_Mutation | novel | c.44G>A | p.Gly15Asp | p.G15D | Q9Y5U4 | protein_coding | deleterious_low_confidence(0.01) | benign(0.133) | TCGA-AA-3949-01 | Colorectum | colon adenocarcinoma | Female | >=65 | III/IV | Unknown | Unknown | SD |
| INSIG2 | SNV | Missense_Mutation | rs758358013 | c.382N>A | p.Asp128Asn | p.D128N | Q9Y5U4 | protein_coding | deleterious(0.04) | benign(0.083) | TCGA-CK-4951-01 | Colorectum | colon adenocarcinoma | Female | >=65 | I/II | Unknown | Unknown | PD |
| INSIG2 | SNV | Missense_Mutation | c.565N>T | p.Arg189Cys | p.R189C | Q9Y5U4 | protein_coding | deleterious(0) | benign(0.007) | TCGA-F5-6814-01 | Colorectum | rectum adenocarcinoma | Male | <65 | I/II | Unknown | Unknown | SD | |
| INSIG2 | insertion | Frame_Shift_Ins | novel | c.585_586insT | p.Ala198CysfsTer19 | p.A198Cfs*19 | Q9Y5U4 | protein_coding | TCGA-G4-6628-01 | Colorectum | colon adenocarcinoma | Male | >=65 | I/II | Unknown | Unknown | SD |
| Page: 1 2 3 4 5 |
Top |
Related drugs of malignant transformation related genes |
| Identification of chemicals and drugs interact with genes involved in malignant transfromation |
| (DGIdb 4.0) |
| Entrez ID | Symbol | Category | Interaction Types | Drug Claim Name | Drug Name | PMIDs |
| 51141 | INSIG2 | NA | antipsychotics | 20877301,18195716,20373477 |
| Page: 1 |

Copyright 2023-Present -The University of Texas Health Science Center at Houston |