
|
|||||
|
 | |
| |
| |
| |
| |
| |
|
Gene: INPP4B |
Gene summary for INPP4B |
| Gene information | Species | Human | Gene symbol | INPP4B | Gene ID | 8821 |
| Gene name | inositol polyphosphate-4-phosphatase type II B | |
| Gene Alias | INPP4B | |
| Cytomap | 4q31.21 | |
| Gene Type | protein-coding | GO ID | GO:0005975 | UniProtAcc | O15327 |
Top |
Malignant transformation analysis |
| Identification of the aberrant gene expression in precancerous and cancerous lesions by comparing the gene expression of stem-like cells in diseased tissues with normal stem cells |
| Entrez ID | Symbol | Replicates | Species | Organ | Tissue | Adj P-value | Log2FC | Malignancy |
| 8821 | INPP4B | CCI_1 | Human | Cervix | CC | 5.72e-13 | 2.19e+00 | 0.528 |
| 8821 | INPP4B | CCI_3 | Human | Cervix | CC | 4.74e-14 | 1.37e+00 | 0.516 |
| 8821 | INPP4B | HTA11_7696_3000711011 | Human | Colorectum | AD | 1.64e-06 | -3.56e-01 | 0.0674 |
| 8821 | INPP4B | HTA11_99999974143_84620 | Human | Colorectum | MSS | 7.99e-06 | -3.38e-01 | 0.3005 |
| 8821 | INPP4B | A002-C-010 | Human | Colorectum | FAP | 1.19e-03 | 3.26e-01 | 0.242 |
| 8821 | INPP4B | A015-C-203 | Human | Colorectum | FAP | 7.00e-17 | -3.29e-01 | -0.1294 |
| 8821 | INPP4B | A015-C-204 | Human | Colorectum | FAP | 4.76e-02 | -1.42e-01 | -0.0228 |
| 8821 | INPP4B | A002-C-201 | Human | Colorectum | FAP | 7.85e-05 | -7.63e-02 | 0.0324 |
| 8821 | INPP4B | A002-C-203 | Human | Colorectum | FAP | 6.76e-03 | 4.10e-01 | 0.2786 |
| 8821 | INPP4B | A001-C-119 | Human | Colorectum | FAP | 7.92e-05 | -3.38e-01 | -0.1557 |
| 8821 | INPP4B | A001-C-108 | Human | Colorectum | FAP | 2.68e-10 | -2.33e-01 | -0.0272 |
| 8821 | INPP4B | A002-C-205 | Human | Colorectum | FAP | 9.42e-14 | -3.42e-01 | -0.1236 |
| 8821 | INPP4B | A015-C-006 | Human | Colorectum | FAP | 4.91e-09 | -3.48e-01 | -0.0994 |
| 8821 | INPP4B | A015-C-106 | Human | Colorectum | FAP | 2.95e-03 | -1.72e-01 | -0.0511 |
| 8821 | INPP4B | A002-C-114 | Human | Colorectum | FAP | 2.75e-10 | -3.40e-01 | -0.1561 |
| 8821 | INPP4B | A015-C-104 | Human | Colorectum | FAP | 6.63e-20 | -4.43e-01 | -0.1899 |
| 8821 | INPP4B | A001-C-014 | Human | Colorectum | FAP | 1.10e-09 | -2.26e-01 | 0.0135 |
| 8821 | INPP4B | A002-C-016 | Human | Colorectum | FAP | 2.72e-11 | -1.08e-01 | 0.0521 |
| 8821 | INPP4B | A015-C-002 | Human | Colorectum | FAP | 1.09e-05 | -2.14e-01 | -0.0763 |
| 8821 | INPP4B | A001-C-203 | Human | Colorectum | FAP | 1.22e-04 | -1.93e-01 | -0.0481 |
| Page: 1 2 3 4 5 6 |
| Tissue | Expression Dynamics | Abbreviation |
| Cervix | 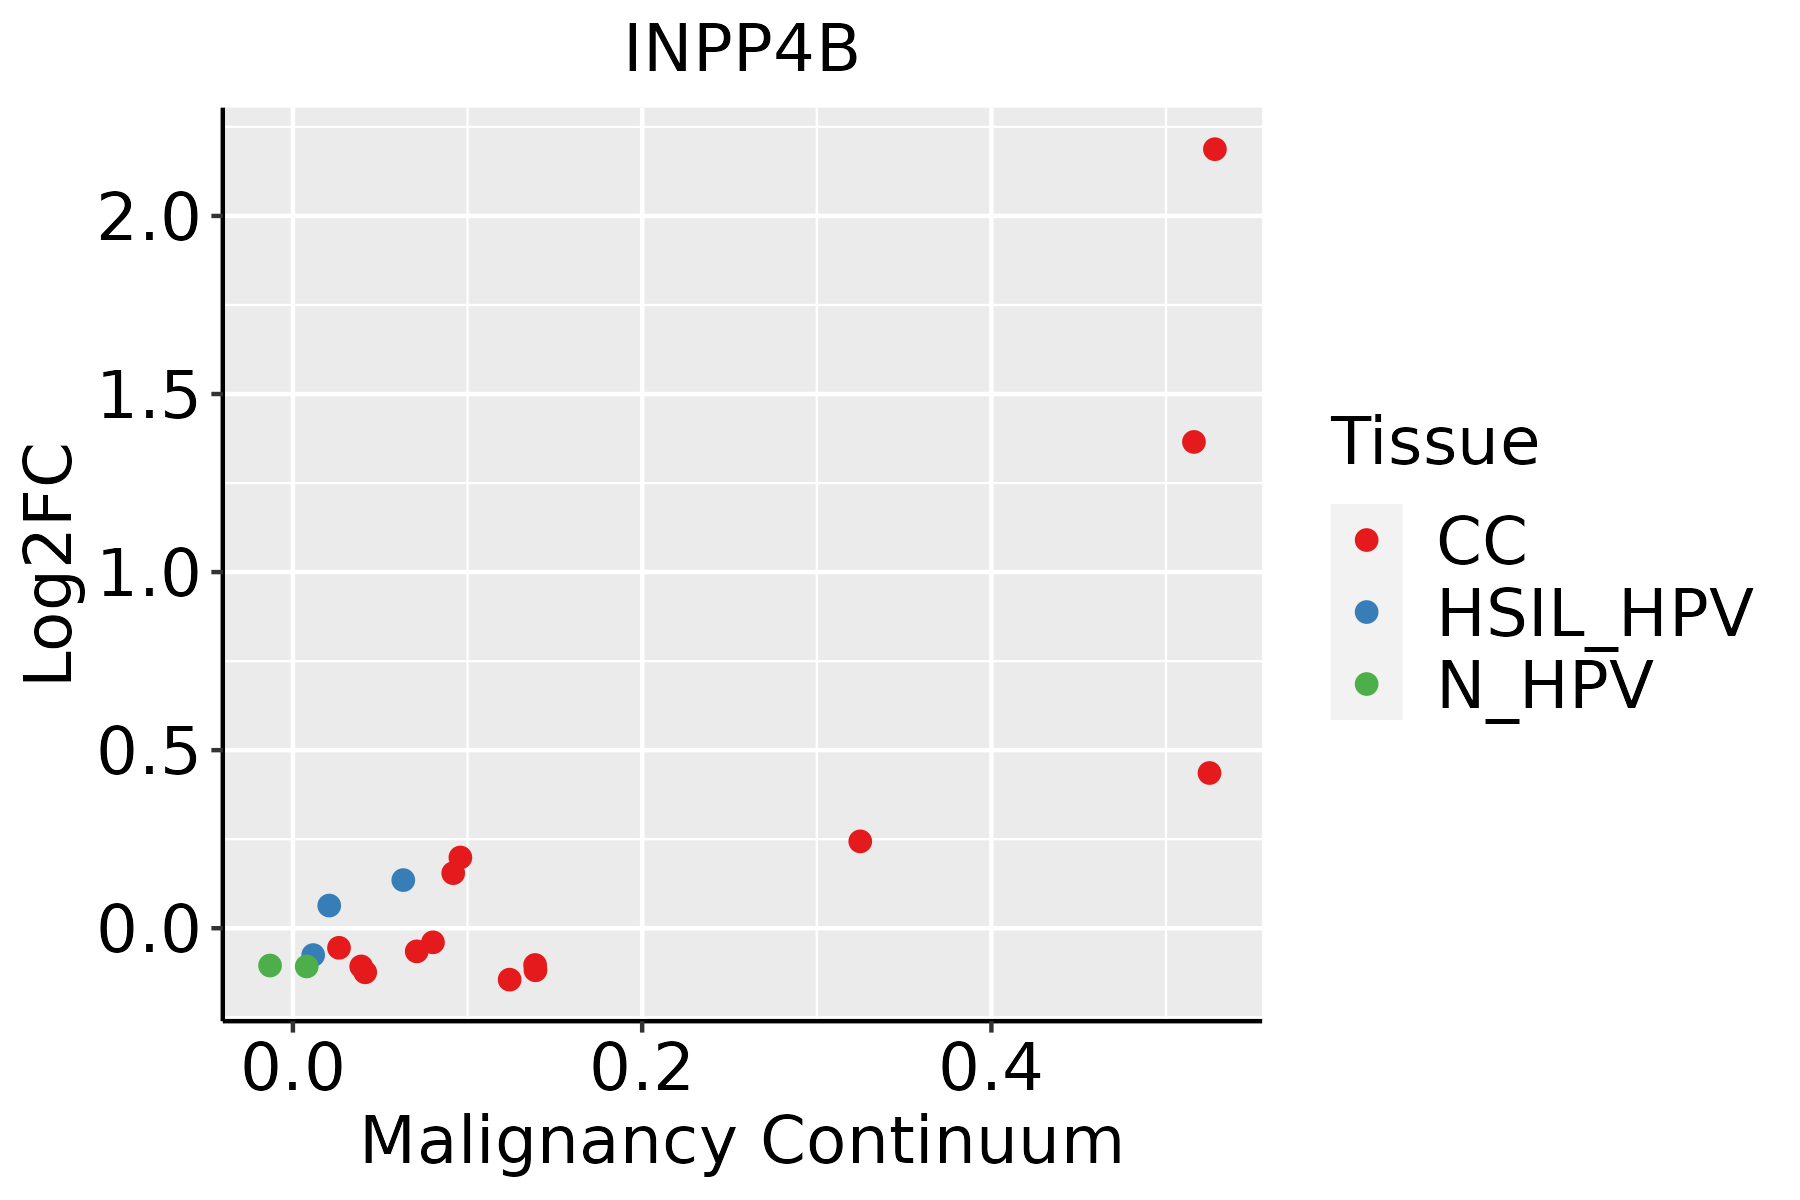 | CC: Cervix cancer |
| HSIL_HPV: HPV-infected high-grade squamous intraepithelial lesions | ||
| N_HPV: HPV-infected normal cervix | ||
| Colorectum (GSE201348) |  | FAP: Familial adenomatous polyposis |
| CRC: Colorectal cancer | ||
| Colorectum (HTA11) |  | AD: Adenomas |
| SER: Sessile serrated lesions | ||
| MSI-H: Microsatellite-high colorectal cancer | ||
| MSS: Microsatellite stable colorectal cancer | ||
| Endometrium |  | AEH: Atypical endometrial hyperplasia |
| EEC: Endometrioid Cancer | ||
| Esophagus | 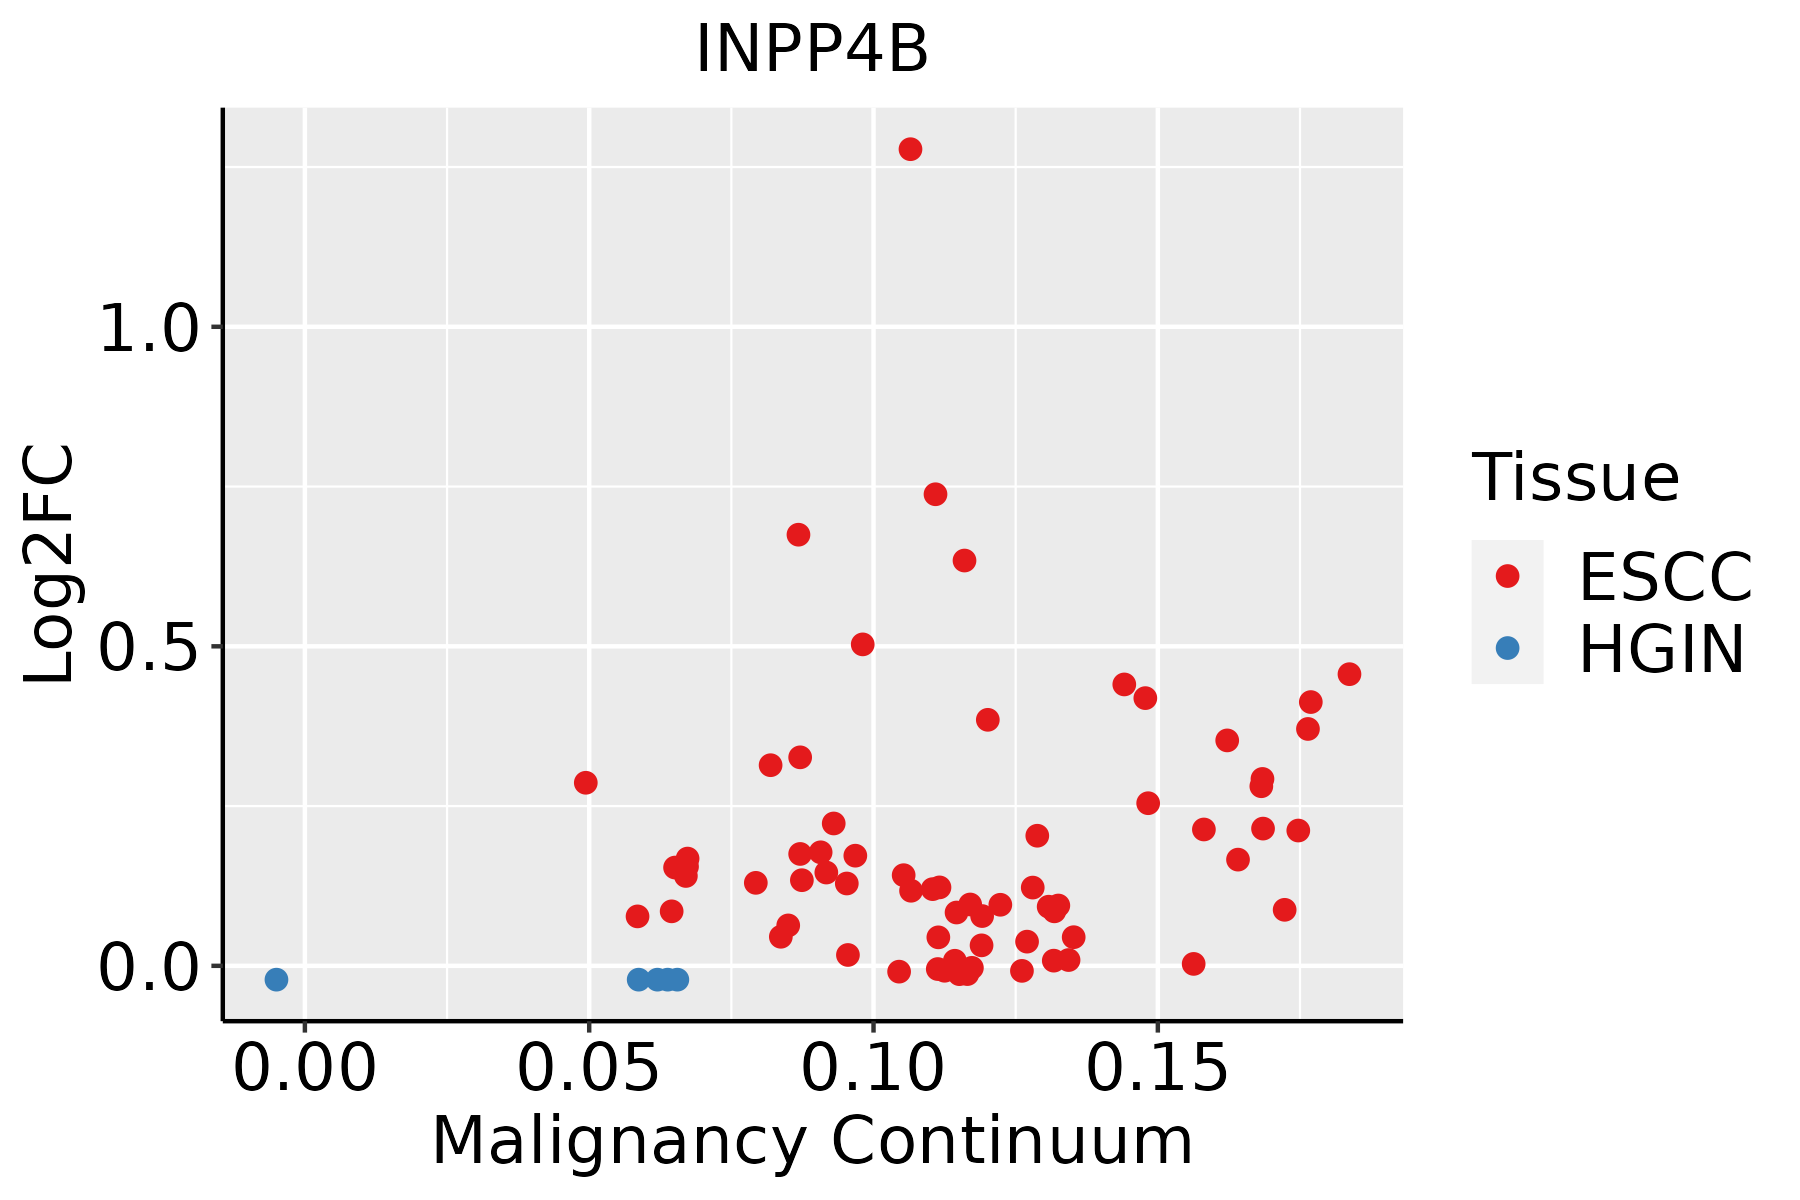 | ESCC: Esophageal squamous cell carcinoma |
| HGIN: High-grade intraepithelial neoplasias | ||
| LGIN: Low-grade intraepithelial neoplasias | ||
| Liver | 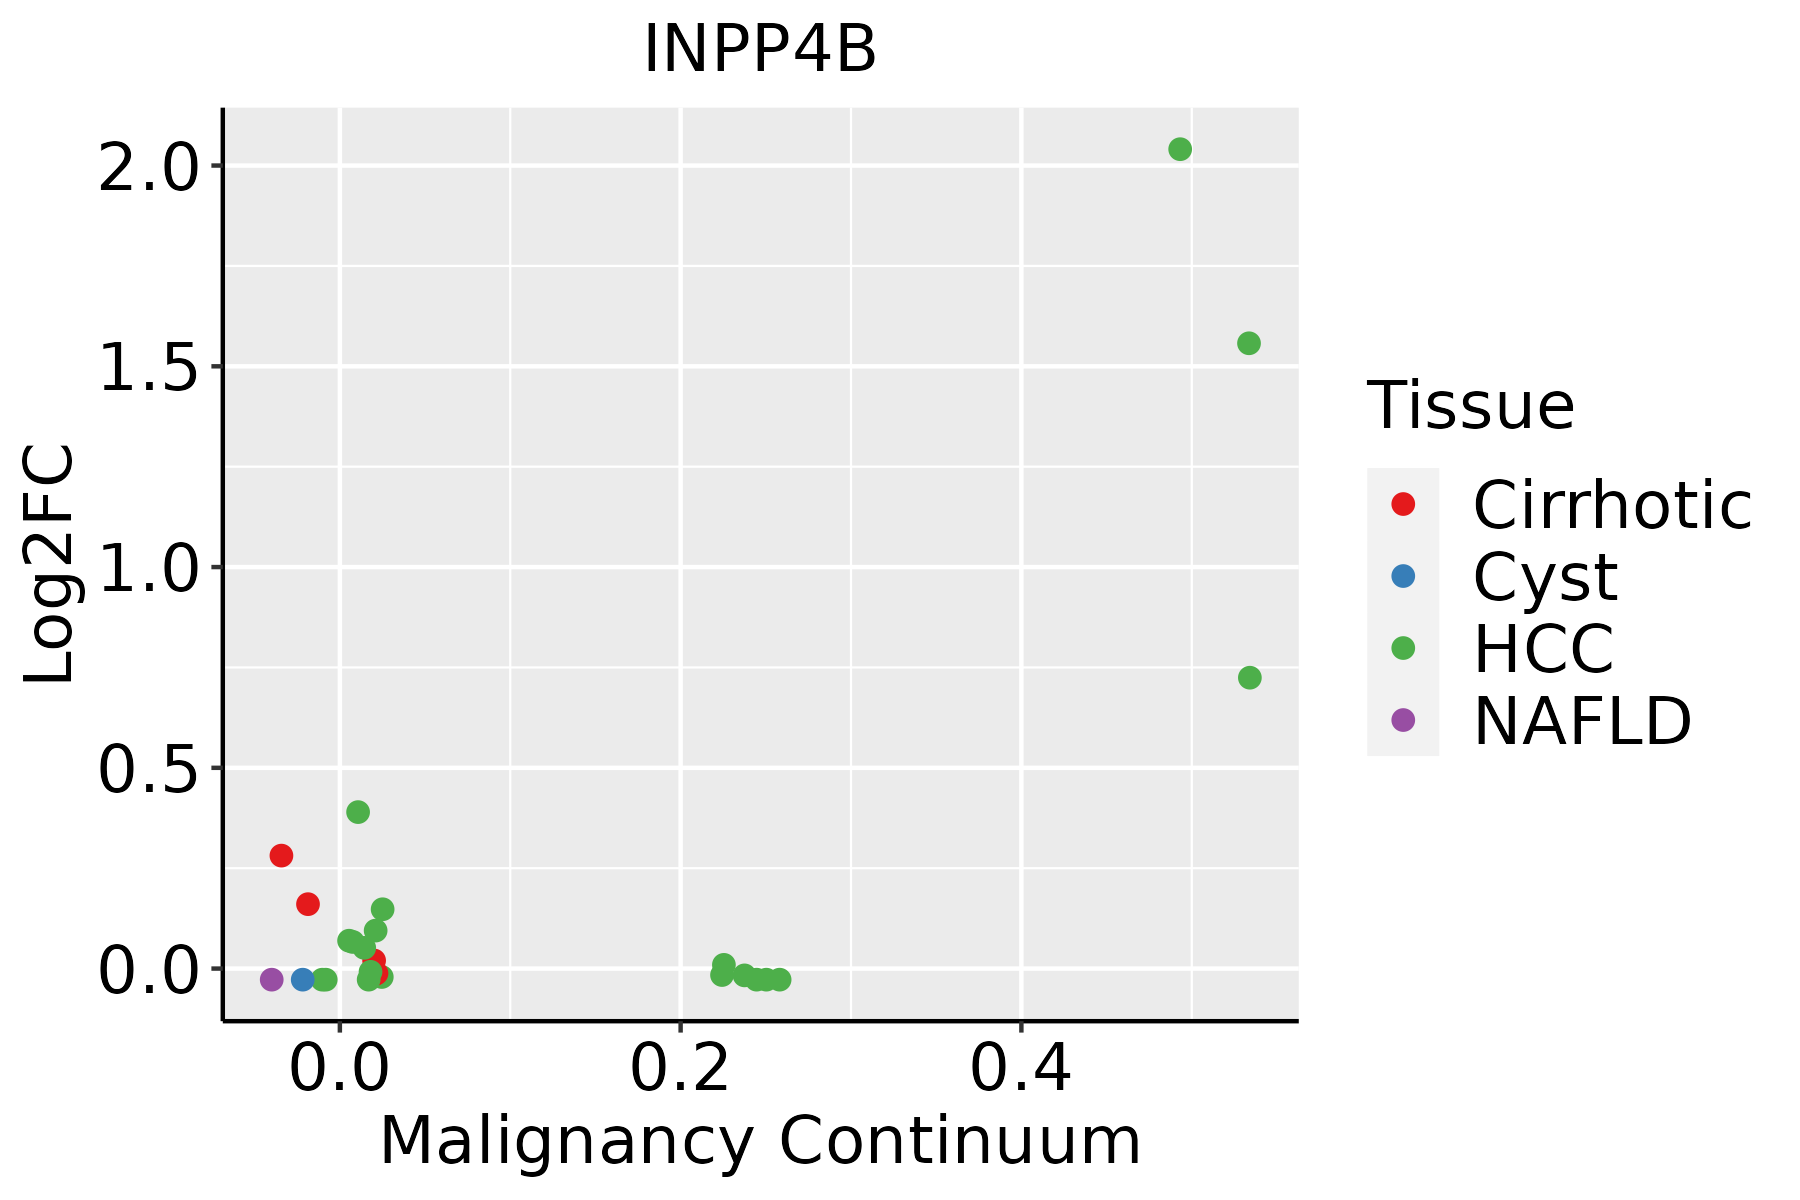 | HCC: Hepatocellular carcinoma |
| NAFLD: Non-alcoholic fatty liver disease | ||
| Lung |  | AAH: Atypical adenomatous hyperplasia |
| AIS: Adenocarcinoma in situ | ||
| IAC: Invasive lung adenocarcinoma | ||
| MIA: Minimally invasive adenocarcinoma | ||
| Oral Cavity |  | EOLP: Erosive Oral lichen planus |
| LP: leukoplakia | ||
| NEOLP: Non-erosive oral lichen planus | ||
| OSCC: Oral squamous cell carcinoma | ||
| Prostate |  | BPH: Benign Prostatic Hyperplasia |
| ∗log2FC in expression of this searched gene in stem-like cells from each diseased tissue sample relative to stem-like cells in normal samples in each tissue plotted against the malignancy continuum. Samples are colored based on if they are from different disease stage. |
Top |
Malignant transformation related pathway analysis |
| Find out the enriched GO biological processes and KEGG pathways involved in transition from healthy to precancer to cancer |
| Tissue | Disease Stage | Enriched GO biological Processes |
| Colorectum | AD |  |
| Colorectum | SER |  |
| Colorectum | MSS |  |
| Colorectum | MSI-H |  |
| Colorectum | FAP |  |
| ∗Top 15 enriched GO BP terms are showed in the bar plot of each disease state in each tissue. Each row represents a significant GO biological process which is colored according to the -log10(p.adjust). |
| Page: 1 2 3 4 5 6 7 8 9 |
| GO ID | Tissue | Disease Stage | Description | Gene Ratio | Bg Ratio | pvalue | p.adjust | Count |
| GO:00163117 | Cervix | CC | dephosphorylation | 73/2311 | 417/18723 | 1.23e-03 | 9.87e-03 | 73 |
| GO:0044282 | Colorectum | AD | small molecule catabolic process | 118/3918 | 376/18723 | 1.05e-06 | 3.55e-05 | 118 |
| GO:0016311 | Colorectum | AD | dephosphorylation | 123/3918 | 417/18723 | 1.84e-05 | 3.82e-04 | 123 |
| GO:0006066 | Colorectum | AD | alcohol metabolic process | 106/3918 | 353/18723 | 3.02e-05 | 5.57e-04 | 106 |
| GO:0044262 | Colorectum | AD | cellular carbohydrate metabolic process | 87/3918 | 283/18723 | 6.00e-05 | 1.01e-03 | 87 |
| GO:0030258 | Colorectum | AD | lipid modification | 67/3918 | 212/18723 | 1.66e-04 | 2.27e-03 | 67 |
| GO:0006650 | Colorectum | AD | glycerophospholipid metabolic process | 83/3918 | 306/18723 | 5.40e-03 | 3.55e-02 | 83 |
| GO:0006644 | Colorectum | AD | phospholipid metabolic process | 101/3918 | 383/18723 | 5.80e-03 | 3.67e-02 | 101 |
| GO:0046164 | Colorectum | AD | alcohol catabolic process | 20/3918 | 55/18723 | 6.03e-03 | 3.78e-02 | 20 |
| GO:0045017 | Colorectum | AD | glycerolipid biosynthetic process | 69/3918 | 252/18723 | 8.33e-03 | 4.88e-02 | 69 |
| GO:00060662 | Colorectum | MSS | alcohol metabolic process | 92/3467 | 353/18723 | 2.57e-04 | 3.46e-03 | 92 |
| GO:00442822 | Colorectum | MSS | small molecule catabolic process | 94/3467 | 376/18723 | 9.85e-04 | 9.86e-03 | 94 |
| GO:00302582 | Colorectum | MSS | lipid modification | 57/3467 | 212/18723 | 1.64e-03 | 1.49e-02 | 57 |
| GO:00163112 | Colorectum | MSS | dephosphorylation | 101/3467 | 417/18723 | 1.98e-03 | 1.70e-02 | 101 |
| GO:00163113 | Colorectum | FAP | dephosphorylation | 95/2622 | 417/18723 | 7.07e-07 | 3.32e-05 | 95 |
| GO:00442621 | Colorectum | FAP | cellular carbohydrate metabolic process | 66/2622 | 283/18723 | 1.53e-05 | 4.01e-04 | 66 |
| GO:00302583 | Colorectum | FAP | lipid modification | 52/2622 | 212/18723 | 2.84e-05 | 6.49e-04 | 52 |
| GO:00442823 | Colorectum | FAP | small molecule catabolic process | 77/2622 | 376/18723 | 3.25e-04 | 4.16e-03 | 77 |
| GO:0008654 | Colorectum | FAP | phospholipid biosynthetic process | 54/2622 | 253/18723 | 8.88e-04 | 9.08e-03 | 54 |
| GO:00066502 | Colorectum | FAP | glycerophospholipid metabolic process | 62/2622 | 306/18723 | 1.54e-03 | 1.38e-02 | 62 |
| Page: 1 2 3 4 |
| Pathway ID | Tissue | Disease Stage | Description | Gene Ratio | Bg Ratio | pvalue | p.adjust | qvalue | Count |
| hsa04070 | Colorectum | CRC | Phosphatidylinositol signaling system | 25/1091 | 97/8465 | 4.27e-04 | 4.60e-03 | 3.12e-03 | 25 |
| hsa00562 | Colorectum | CRC | Inositol phosphate metabolism | 18/1091 | 73/8465 | 4.38e-03 | 2.52e-02 | 1.71e-02 | 18 |
| hsa040701 | Colorectum | CRC | Phosphatidylinositol signaling system | 25/1091 | 97/8465 | 4.27e-04 | 4.60e-03 | 3.12e-03 | 25 |
| hsa005621 | Colorectum | CRC | Inositol phosphate metabolism | 18/1091 | 73/8465 | 4.38e-03 | 2.52e-02 | 1.71e-02 | 18 |
| Page: 1 |
Top |
Cell-cell communication analysis |
| Identification of potential cell-cell interactions between two cell types and their ligand-receptor pairs for different disease states |
| Ligand | Receptor | LRpair | Pathway | Tissue | Disease Stage |
| Page: 1 |
Top |
Single-cell gene regulatory network inference analysis |
| Find out the significant the regulons (TFs) and the target genes of each regulon across cell types for different disease states |
| TF | Cell Type | Tissue | Disease Stage | Target Gene | RSS | Regulon Activity |
| ∗The dot plots of a searched regulon are shown for all cell subpopulations in each disease state of each tissue based on the regulon specific score inferred using pySCENIC and by calculating the average expression. |
| Page: 1 |
Top |
Somatic mutation of malignant transformation related genes |
| Annotation of somatic variants for genes involved in malignant transformation |
| Hugo Symbol | Variant Class | Variant Classification | dbSNP RS | HGVSc | HGVSp | HGVSp Short | SWISSPROT | BIOTYPE | SIFT | PolyPhen | Tumor Sample Barcode | Tissue | Histology | Sex | Age | Stage | Therapy Types | Drugs | Outcome |
| INPP4B | SNV | Missense_Mutation | c.1039C>G | p.Gln347Glu | p.Q347E | protein_coding | deleterious(0) | probably_damaging(0.968) | TCGA-A2-A0D2-01 | Breast | breast invasive carcinoma | Female | <65 | I/II | Chemotherapy | adriamycin | SD | ||
| INPP4B | SNV | Missense_Mutation | c.1270N>C | p.Ile424Leu | p.I424L | protein_coding | tolerated(0.09) | benign(0.051) | TCGA-A2-A0YT-01 | Breast | breast invasive carcinoma | Female | <65 | III/IV | Hormone Therapy | arimidex | SD | ||
| INPP4B | SNV | Missense_Mutation | c.377G>A | p.Arg126Gln | p.R126Q | protein_coding | tolerated(0.19) | benign(0.007) | TCGA-AN-A046-01 | Breast | breast invasive carcinoma | Female | >=65 | I/II | Unknown | Unknown | SD | ||
| INPP4B | SNV | Missense_Mutation | rs377427325 | c.658N>A | p.Gly220Arg | p.G220R | protein_coding | tolerated(0.57) | benign(0.003) | TCGA-AO-A03O-01 | Breast | breast invasive carcinoma | Female | >=65 | I/II | Chemotherapy | doxorubicin | SD | |
| INPP4B | SNV | Missense_Mutation | novel | c.620N>T | p.Ala207Val | p.A207V | protein_coding | tolerated(0.55) | benign(0.225) | TCGA-AO-A128-01 | Breast | breast invasive carcinoma | Female | <65 | I/II | Chemotherapy | doxorubicin | SD | |
| INPP4B | SNV | Missense_Mutation | novel | c.2391G>T | p.Gln797His | p.Q797H | protein_coding | tolerated(0.16) | possibly_damaging(0.904) | TCGA-AR-A0U0-01 | Breast | breast invasive carcinoma | Female | >=65 | I/II | Unknown | Unknown | SD | |
| INPP4B | SNV | Missense_Mutation | c.1661N>A | p.Gly554Asp | p.G554D | protein_coding | tolerated(0.54) | benign(0.036) | TCGA-BH-A0DQ-01 | Breast | breast invasive carcinoma | Female | <65 | I/II | Chemotherapy | doxorubicin | SD | ||
| INPP4B | SNV | Missense_Mutation | novel | c.2457G>C | p.Lys819Asn | p.K819N | protein_coding | deleterious(0) | probably_damaging(0.997) | TCGA-EW-A3U0-01 | Breast | breast invasive carcinoma | Female | <65 | III/IV | Chemotherapy | cisplatin | CR | |
| INPP4B | insertion | Frame_Shift_Ins | novel | c.2447_2448insGGCAGAGGAAAGCTTCTTTAGTTTCCCTTCCTGCCTTCTT | p.Lys817AlafsTer40 | p.K817Afs*40 | protein_coding | TCGA-AN-A04D-01 | Breast | breast invasive carcinoma | Female | <65 | I/II | Unknown | Unknown | SD | |||
| INPP4B | insertion | Nonsense_Mutation | novel | c.2391_2392insTAACT | p.Glu798Ter | p.E798* | protein_coding | TCGA-AR-A0U0-01 | Breast | breast invasive carcinoma | Female | >=65 | I/II | Unknown | Unknown | SD |
| Page: 1 2 3 4 5 6 7 8 9 10 11 12 |
Top |
Related drugs of malignant transformation related genes |
| Identification of chemicals and drugs interact with genes involved in malignant transfromation |
| (DGIdb 4.0) |
| Entrez ID | Symbol | Category | Interaction Types | Drug Claim Name | Drug Name | PMIDs |
| Page: 1 |

Copyright 2023-Present -The University of Texas Health Science Center at Houston |