
|
|||||
|
 | |
| |
| |
| |
| |
| |
|
Gene: INPP1 |
Gene summary for INPP1 |
| Gene information | Species | Human | Gene symbol | INPP1 | Gene ID | 3628 |
| Gene name | inositol polyphosphate-1-phosphatase | |
| Gene Alias | INPP1 | |
| Cytomap | 2q32.2 | |
| Gene Type | protein-coding | GO ID | GO:0005975 | UniProtAcc | P49441 |
Top |
Malignant transformation analysis |
| Identification of the aberrant gene expression in precancerous and cancerous lesions by comparing the gene expression of stem-like cells in diseased tissues with normal stem cells |
| Entrez ID | Symbol | Replicates | Species | Organ | Tissue | Adj P-value | Log2FC | Malignancy |
| 3628 | INPP1 | CCI_2 | Human | Cervix | CC | 1.00e-07 | 9.06e-01 | 0.5249 |
| 3628 | INPP1 | CCI_3 | Human | Cervix | CC | 3.43e-10 | 7.90e-01 | 0.516 |
| 3628 | INPP1 | Tumor | Human | Cervix | CC | 1.42e-22 | 5.29e-01 | 0.1241 |
| 3628 | INPP1 | sample1 | Human | Cervix | CC | 2.11e-03 | 3.54e-01 | 0.0959 |
| 3628 | INPP1 | sample3 | Human | Cervix | CC | 2.11e-20 | 5.04e-01 | 0.1387 |
| 3628 | INPP1 | T1 | Human | Cervix | CC | 8.73e-06 | 3.01e-01 | 0.0918 |
| 3628 | INPP1 | T3 | Human | Cervix | CC | 1.41e-23 | 5.50e-01 | 0.1389 |
| 3628 | INPP1 | LZE8T | Human | Esophagus | ESCC | 2.28e-08 | 3.36e-01 | 0.067 |
| 3628 | INPP1 | LZE20T | Human | Esophagus | ESCC | 2.99e-03 | 2.16e-01 | 0.0662 |
| 3628 | INPP1 | LZE24T | Human | Esophagus | ESCC | 5.98e-05 | 1.69e-01 | 0.0596 |
| 3628 | INPP1 | P1T-E | Human | Esophagus | ESCC | 1.24e-04 | 4.54e-01 | 0.0875 |
| 3628 | INPP1 | P2T-E | Human | Esophagus | ESCC | 3.89e-34 | 6.07e-01 | 0.1177 |
| 3628 | INPP1 | P4T-E | Human | Esophagus | ESCC | 1.28e-11 | 4.49e-01 | 0.1323 |
| 3628 | INPP1 | P5T-E | Human | Esophagus | ESCC | 4.39e-16 | 2.57e-01 | 0.1327 |
| 3628 | INPP1 | P8T-E | Human | Esophagus | ESCC | 5.49e-37 | 6.92e-01 | 0.0889 |
| 3628 | INPP1 | P9T-E | Human | Esophagus | ESCC | 7.39e-13 | 2.97e-01 | 0.1131 |
| 3628 | INPP1 | P10T-E | Human | Esophagus | ESCC | 1.38e-02 | 9.63e-02 | 0.116 |
| 3628 | INPP1 | P11T-E | Human | Esophagus | ESCC | 2.24e-22 | 1.08e+00 | 0.1426 |
| 3628 | INPP1 | P12T-E | Human | Esophagus | ESCC | 2.19e-21 | 3.48e-01 | 0.1122 |
| 3628 | INPP1 | P16T-E | Human | Esophagus | ESCC | 6.11e-09 | 1.08e-01 | 0.1153 |
| Page: 1 2 3 4 5 6 |
| Tissue | Expression Dynamics | Abbreviation |
| Cervix |  | CC: Cervix cancer |
| HSIL_HPV: HPV-infected high-grade squamous intraepithelial lesions | ||
| N_HPV: HPV-infected normal cervix | ||
| Esophagus | 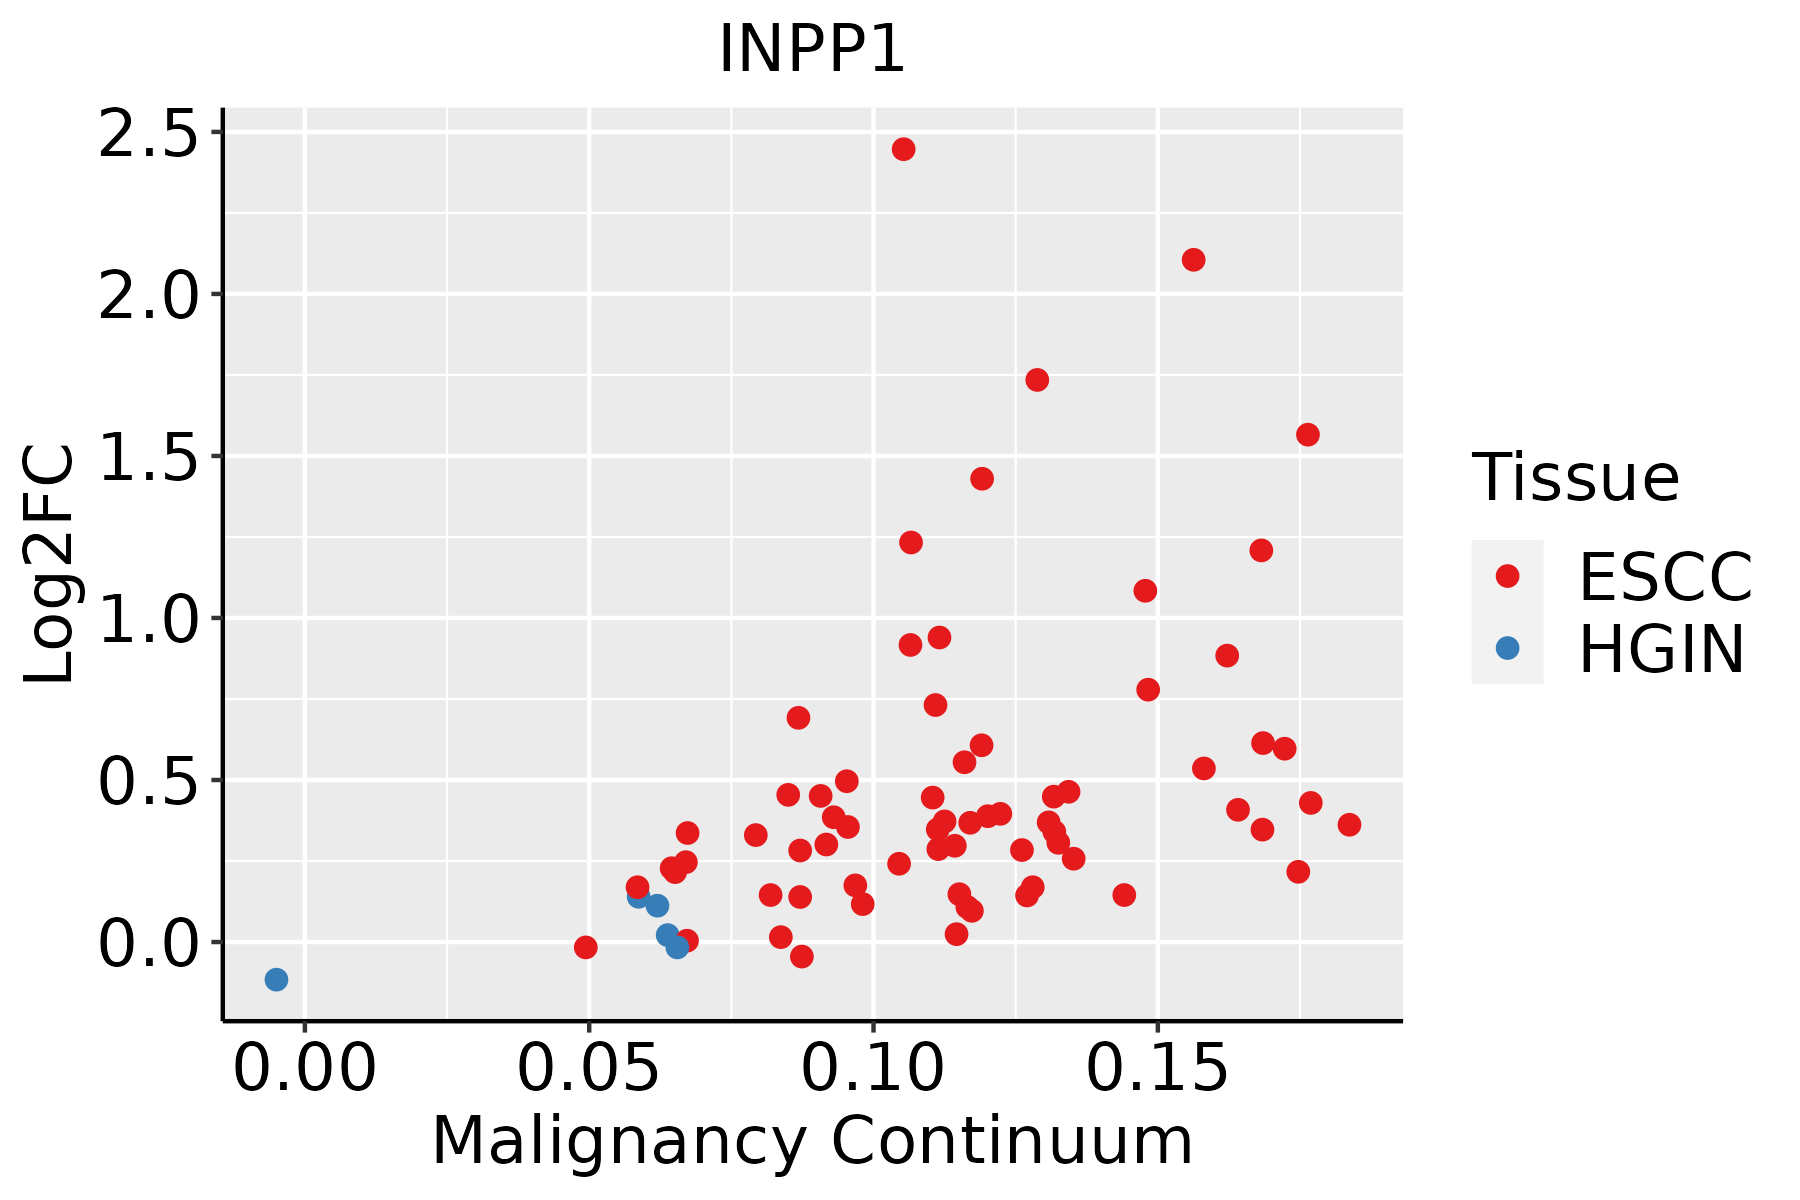 | ESCC: Esophageal squamous cell carcinoma |
| HGIN: High-grade intraepithelial neoplasias | ||
| LGIN: Low-grade intraepithelial neoplasias | ||
| Liver | 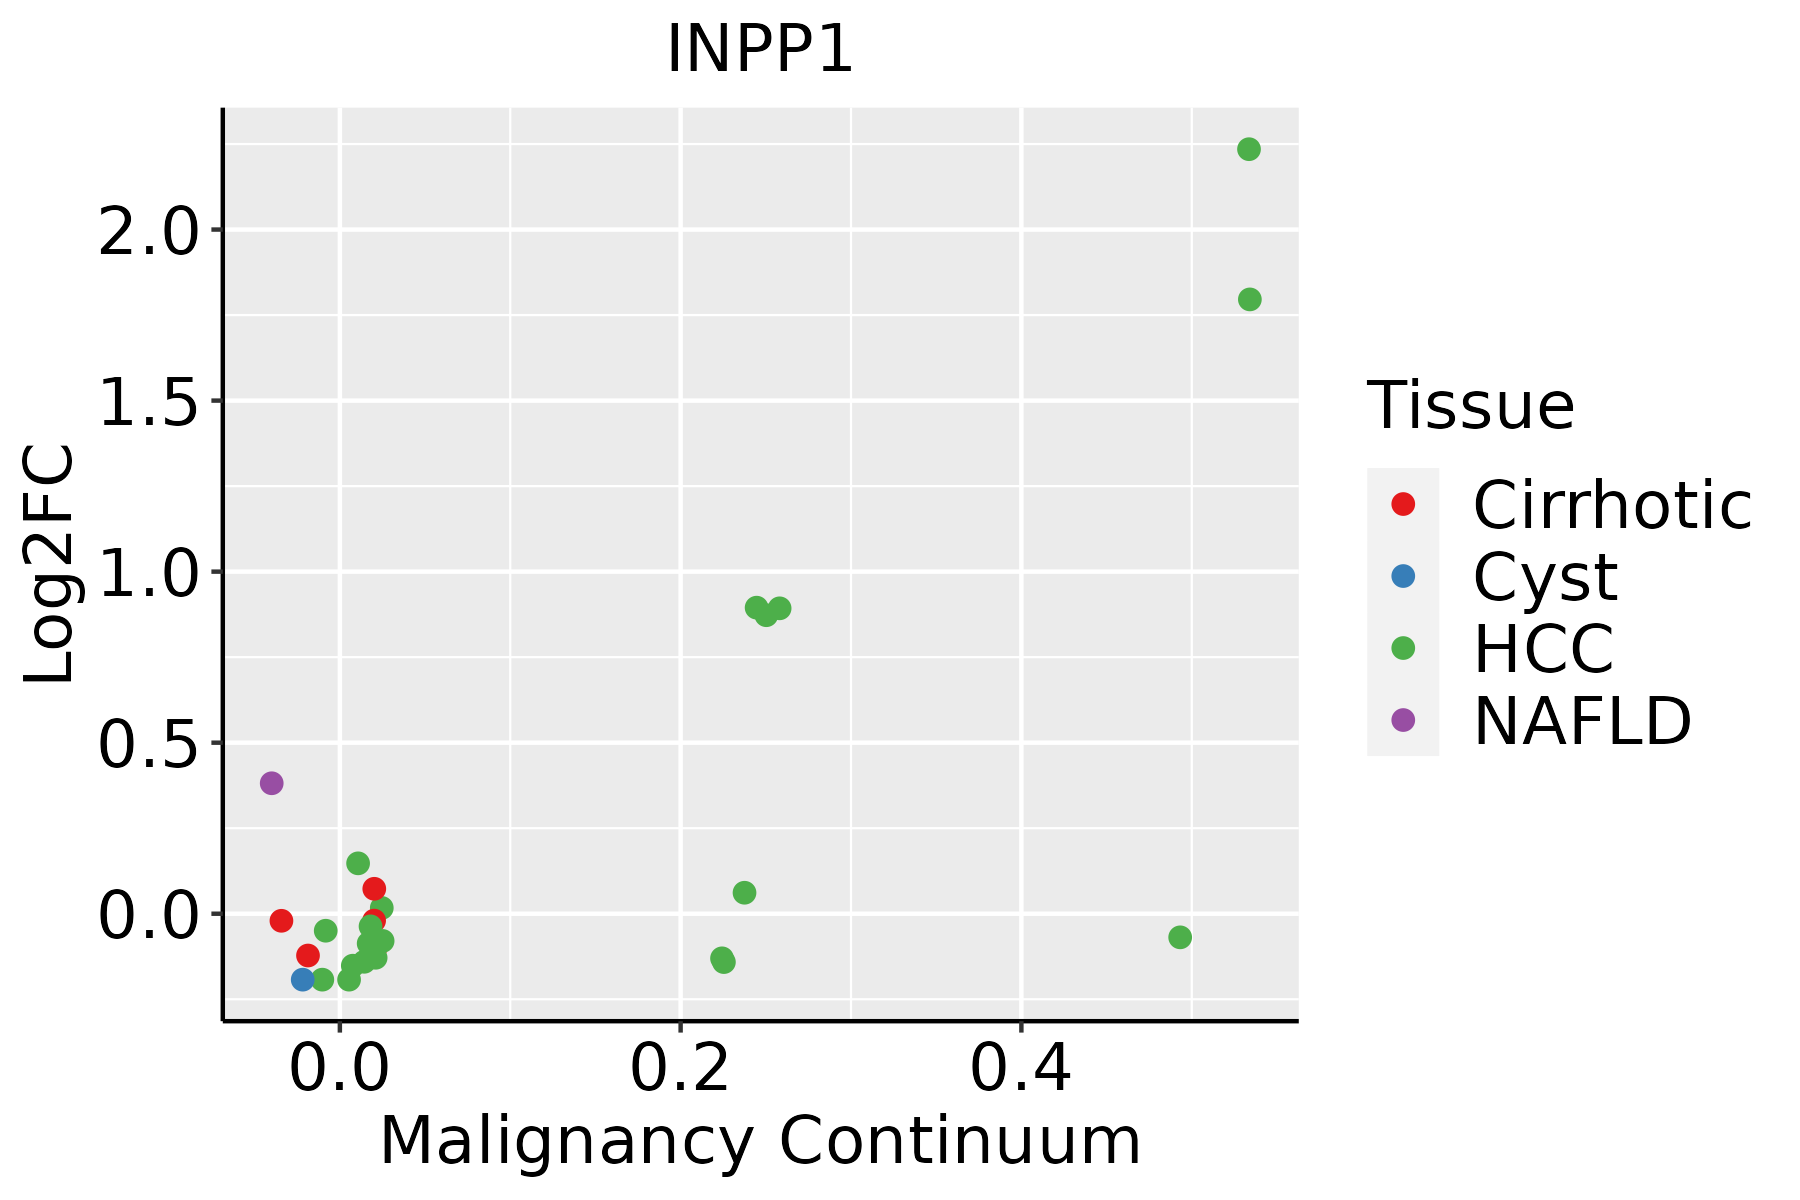 | HCC: Hepatocellular carcinoma |
| NAFLD: Non-alcoholic fatty liver disease | ||
| Oral Cavity |  | EOLP: Erosive Oral lichen planus |
| LP: leukoplakia | ||
| NEOLP: Non-erosive oral lichen planus | ||
| OSCC: Oral squamous cell carcinoma | ||
| Skin | 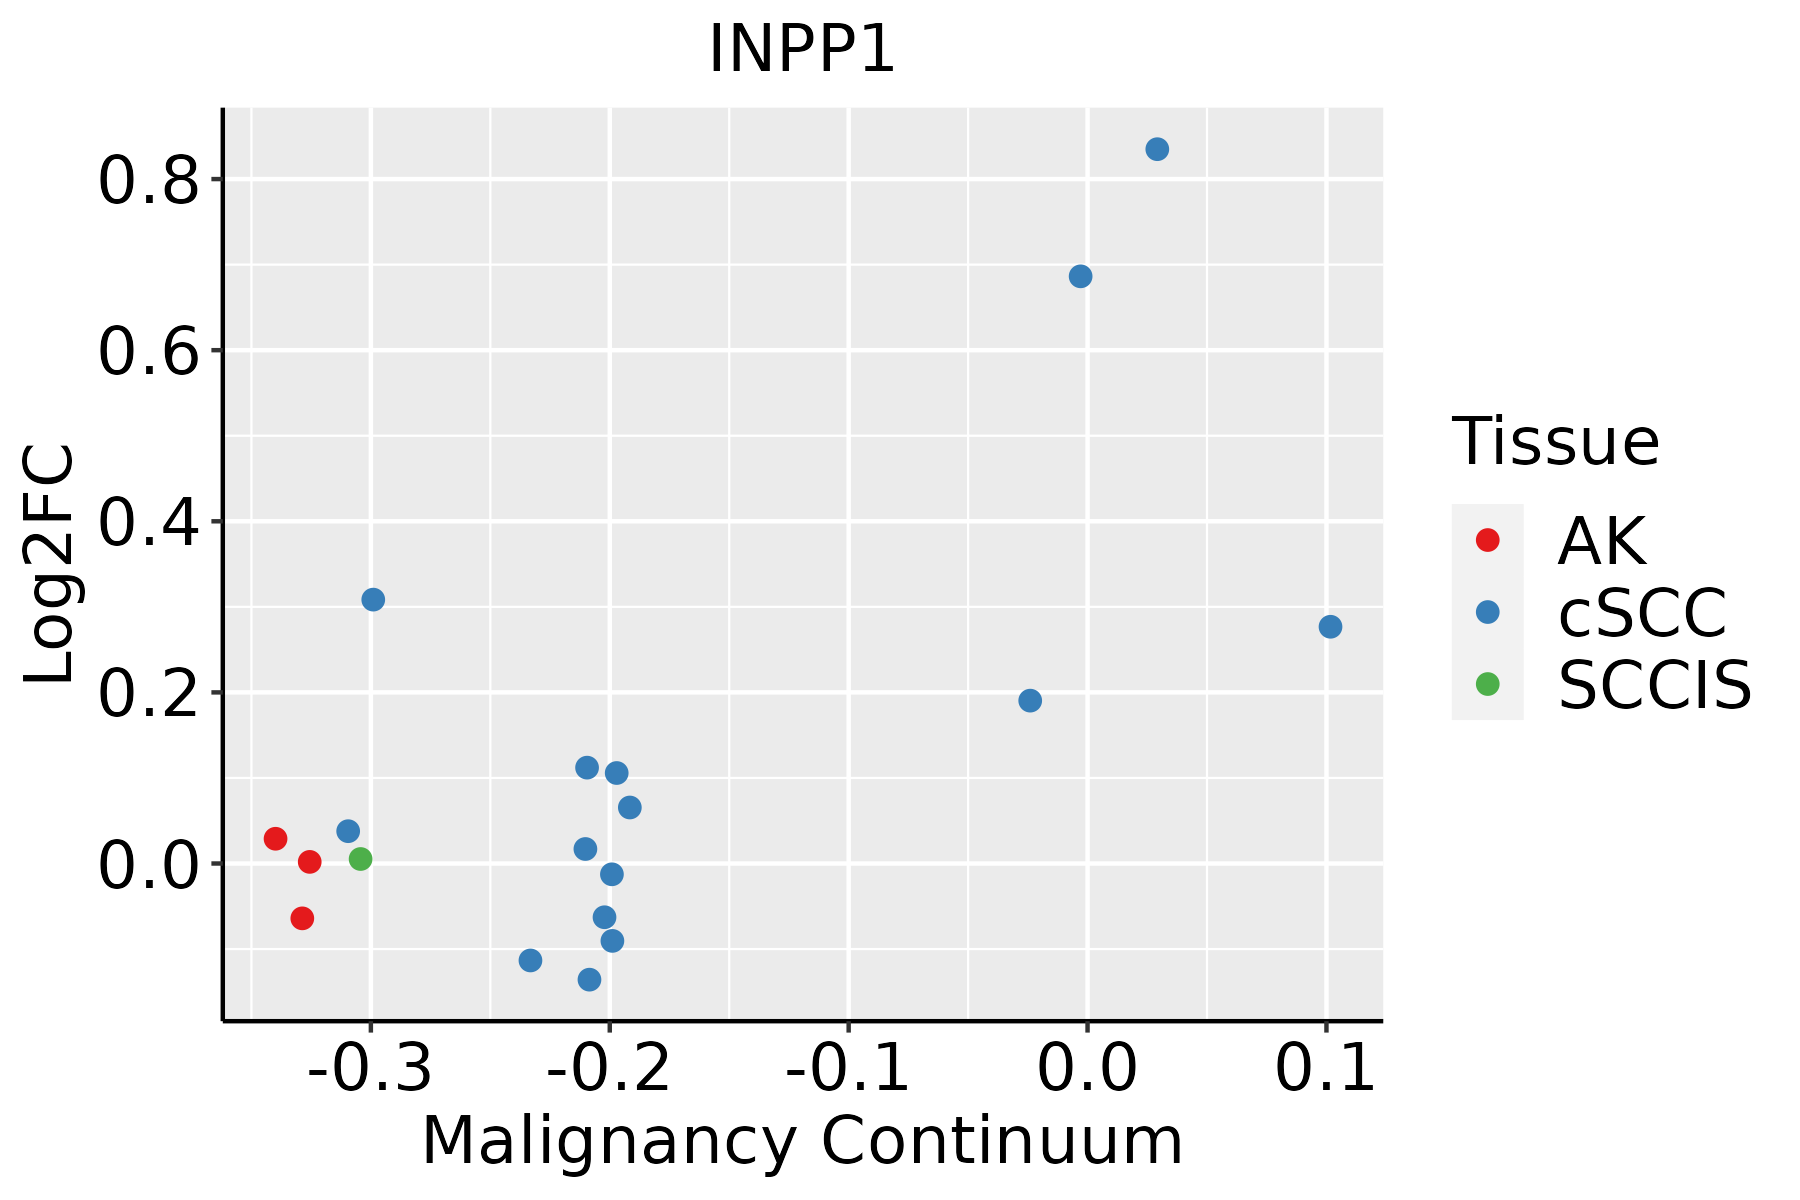 | AK: Actinic keratosis |
| cSCC: Cutaneous squamous cell carcinoma | ||
| SCCIS:squamous cell carcinoma in situ | ||
| Thyroid | 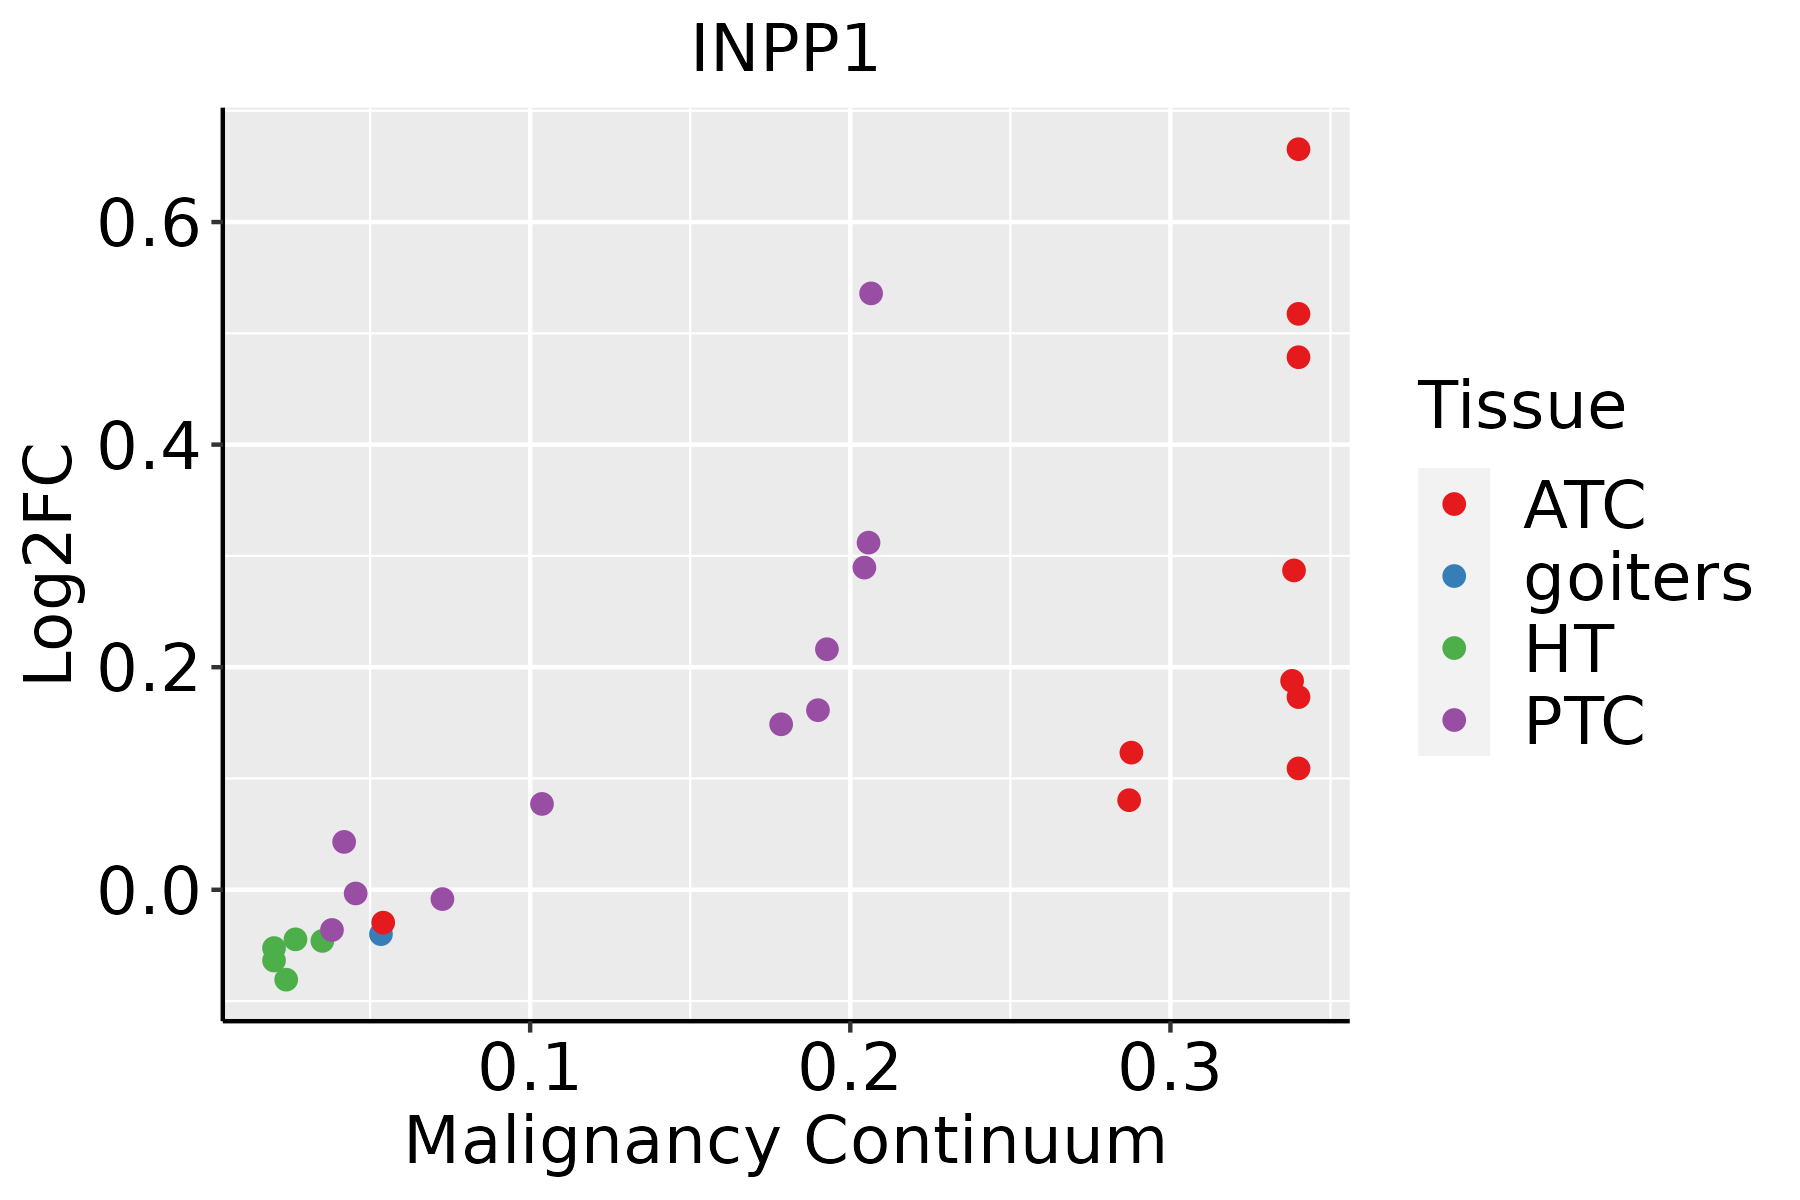 | ATC: Anaplastic thyroid cancer |
| HT: Hashimoto's thyroiditis | ||
| PTC: Papillary thyroid cancer |
| ∗log2FC in expression of this searched gene in stem-like cells from each diseased tissue sample relative to stem-like cells in normal samples in each tissue plotted against the malignancy continuum. Samples are colored based on if they are from different disease stage. |
Top |
Malignant transformation related pathway analysis |
| Find out the enriched GO biological processes and KEGG pathways involved in transition from healthy to precancer to cancer |
| Tissue | Disease Stage | Enriched GO biological Processes |
| Colorectum | AD |  |
| Colorectum | SER |  |
| Colorectum | MSS |  |
| Colorectum | MSI-H |  |
| Colorectum | FAP |  |
| ∗Top 15 enriched GO BP terms are showed in the bar plot of each disease state in each tissue. Each row represents a significant GO biological process which is colored according to the -log10(p.adjust). |
| Page: 1 2 3 4 5 6 7 8 9 |
| GO ID | Tissue | Disease Stage | Description | Gene Ratio | Bg Ratio | pvalue | p.adjust | Count |
| GO:00163117 | Cervix | CC | dephosphorylation | 73/2311 | 417/18723 | 1.23e-03 | 9.87e-03 | 73 |
| GO:001631110 | Esophagus | ESCC | dephosphorylation | 251/8552 | 417/18723 | 1.26e-09 | 2.99e-08 | 251 |
| GO:00086544 | Esophagus | ESCC | phospholipid biosynthetic process | 162/8552 | 253/18723 | 2.59e-09 | 5.73e-08 | 162 |
| GO:000647018 | Esophagus | ESCC | protein dephosphorylation | 177/8552 | 281/18723 | 3.13e-09 | 6.72e-08 | 177 |
| GO:00464744 | Esophagus | ESCC | glycerophospholipid biosynthetic process | 135/8552 | 211/18723 | 5.75e-08 | 1.02e-06 | 135 |
| GO:00450175 | Esophagus | ESCC | glycerolipid biosynthetic process | 154/8552 | 252/18723 | 5.20e-07 | 6.96e-06 | 154 |
| GO:000150317 | Esophagus | ESCC | ossification | 232/8552 | 408/18723 | 3.00e-06 | 3.40e-05 | 232 |
| GO:00066446 | Esophagus | ESCC | phospholipid metabolic process | 218/8552 | 383/18723 | 5.37e-06 | 5.59e-05 | 218 |
| GO:00060668 | Esophagus | ESCC | alcohol metabolic process | 202/8552 | 353/18723 | 7.32e-06 | 7.26e-05 | 202 |
| GO:00066505 | Esophagus | ESCC | glycerophospholipid metabolic process | 174/8552 | 306/18723 | 4.92e-05 | 3.85e-04 | 174 |
| GO:00442626 | Esophagus | ESCC | cellular carbohydrate metabolic process | 160/8552 | 283/18723 | 1.43e-04 | 9.66e-04 | 160 |
| GO:00464864 | Esophagus | ESCC | glycerolipid metabolic process | 211/8552 | 392/18723 | 6.51e-04 | 3.46e-03 | 211 |
| GO:00442827 | Esophagus | ESCC | small molecule catabolic process | 201/8552 | 376/18723 | 1.35e-03 | 6.41e-03 | 201 |
| GO:00066611 | Esophagus | ESCC | phosphatidylinositol biosynthetic process | 73/8552 | 131/18723 | 1.31e-02 | 4.28e-02 | 73 |
| GO:004428221 | Liver | HCC | small molecule catabolic process | 225/7958 | 376/18723 | 6.50e-12 | 2.80e-10 | 225 |
| GO:000606621 | Liver | HCC | alcohol metabolic process | 208/7958 | 353/18723 | 2.80e-10 | 9.50e-09 | 208 |
| GO:00086542 | Liver | HCC | phospholipid biosynthetic process | 150/7958 | 253/18723 | 4.77e-08 | 1.03e-06 | 150 |
| GO:00066444 | Liver | HCC | phospholipid metabolic process | 214/7958 | 383/18723 | 7.25e-08 | 1.48e-06 | 214 |
| GO:001631121 | Liver | HCC | dephosphorylation | 230/7958 | 417/18723 | 1.00e-07 | 1.96e-06 | 230 |
| GO:000647021 | Liver | HCC | protein dephosphorylation | 162/7958 | 281/18723 | 1.91e-07 | 3.46e-06 | 162 |
| Page: 1 2 3 |
| Pathway ID | Tissue | Disease Stage | Description | Gene Ratio | Bg Ratio | pvalue | p.adjust | qvalue | Count |
| Page: 1 |
Top |
Cell-cell communication analysis |
| Identification of potential cell-cell interactions between two cell types and their ligand-receptor pairs for different disease states |
| Ligand | Receptor | LRpair | Pathway | Tissue | Disease Stage |
| Page: 1 |
Top |
Single-cell gene regulatory network inference analysis |
| Find out the significant the regulons (TFs) and the target genes of each regulon across cell types for different disease states |
| TF | Cell Type | Tissue | Disease Stage | Target Gene | RSS | Regulon Activity |
| ∗The dot plots of a searched regulon are shown for all cell subpopulations in each disease state of each tissue based on the regulon specific score inferred using pySCENIC and by calculating the average expression. |
| Page: 1 |
Top |
Somatic mutation of malignant transformation related genes |
| Annotation of somatic variants for genes involved in malignant transformation |
| Hugo Symbol | Variant Class | Variant Classification | dbSNP RS | HGVSc | HGVSp | HGVSp Short | SWISSPROT | BIOTYPE | SIFT | PolyPhen | Tumor Sample Barcode | Tissue | Histology | Sex | Age | Stage | Therapy Types | Drugs | Outcome |
| INPP1 | SNV | Missense_Mutation | novel | c.232N>C | p.Gly78Arg | p.G78R | P49441 | protein_coding | deleterious(0) | probably_damaging(1) | TCGA-AC-A23H-01 | Breast | breast invasive carcinoma | Female | >=65 | I/II | Unknown | Unknown | PD |
| INPP1 | SNV | Missense_Mutation | rs776864674 | c.160N>A | p.Asp54Asn | p.D54N | P49441 | protein_coding | deleterious(0) | probably_damaging(0.999) | TCGA-AR-A1AL-01 | Breast | breast invasive carcinoma | Female | <65 | III/IV | Hormone Therapy | anastrozole | SD |
| INPP1 | deletion | Frame_Shift_Del | novel | c.1181delC | p.Pro394LeufsTer30 | p.P394Lfs*30 | P49441 | protein_coding | TCGA-D8-A27V-01 | Breast | breast invasive carcinoma | Female | <65 | I/II | Hormone Therapy | tamoxiphen | SD | ||
| INPP1 | SNV | Missense_Mutation | novel | c.103G>A | p.Glu35Lys | p.E35K | P49441 | protein_coding | deleterious(0) | possibly_damaging(0.622) | TCGA-2W-A8YY-01 | Cervix | cervical & endocervical cancer | Female | <65 | I/II | Chemotherapy | cisplatin | CR |
| INPP1 | SNV | Missense_Mutation | c.518N>A | p.Gly173Glu | p.G173E | P49441 | protein_coding | deleterious(0.03) | probably_damaging(0.994) | TCGA-DR-A0ZM-01 | Cervix | cervical & endocervical cancer | Female | <65 | III/IV | Unspecific | Cisplatin | SD | |
| INPP1 | SNV | Missense_Mutation | c.816N>G | p.Ile272Met | p.I272M | P49441 | protein_coding | deleterious(0) | possibly_damaging(0.782) | TCGA-FU-A40J-01 | Cervix | cervical & endocervical cancer | Female | <65 | III/IV | Chemotherapy | carboplatin | CR | |
| INPP1 | SNV | Missense_Mutation | novel | c.1072G>C | p.Glu358Gln | p.E358Q | P49441 | protein_coding | tolerated(0.22) | benign(0.003) | TCGA-VS-A9UP-01 | Cervix | cervical & endocervical cancer | Female | <65 | I/II | Chemotherapy | cisplatin | PD |
| INPP1 | SNV | Missense_Mutation | c.1160N>C | p.Leu387Pro | p.L387P | P49441 | protein_coding | tolerated(0.15) | benign(0.054) | TCGA-A6-5665-01 | Colorectum | colon adenocarcinoma | Female | >=65 | I/II | Unknown | Unknown | PD | |
| INPP1 | SNV | Missense_Mutation | rs777831500 | c.1138N>T | p.Arg380Trp | p.R380W | P49441 | protein_coding | tolerated(0.06) | possibly_damaging(0.545) | TCGA-AA-3866-01 | Colorectum | colon adenocarcinoma | Female | >=65 | I/II | Unknown | Unknown | SD |
| INPP1 | SNV | Missense_Mutation | rs577408029 | c.847N>T | p.Arg283Cys | p.R283C | P49441 | protein_coding | tolerated(0.1) | possibly_damaging(0.73) | TCGA-AA-A010-01 | Colorectum | colon adenocarcinoma | Female | <65 | I/II | Chemotherapy | folinic | CR |
| Page: 1 2 3 4 5 |
Top |
Related drugs of malignant transformation related genes |
| Identification of chemicals and drugs interact with genes involved in malignant transfromation |
| (DGIdb 4.0) |
| Entrez ID | Symbol | Category | Interaction Types | Drug Claim Name | Drug Name | PMIDs |
| 3628 | INPP1 | ENZYME | LITHIUM | LITHIUM | 16787706 |
| Page: 1 |

Copyright 2023-Present -The University of Texas Health Science Center at Houston |