
|
|||||
|
 | |
| |
| |
| |
| |
| |
|
Gene: INO80E |
Gene summary for INO80E |
| Gene information | Species | Human | Gene symbol | INO80E | Gene ID | 283899 |
| Gene name | INO80 complex subunit E | |
| Gene Alias | CCDC95 | |
| Cytomap | 16p11.2 | |
| Gene Type | protein-coding | GO ID | GO:0006139 | UniProtAcc | J3KNE2 |
Top |
Malignant transformation analysis |
| Identification of the aberrant gene expression in precancerous and cancerous lesions by comparing the gene expression of stem-like cells in diseased tissues with normal stem cells |
| Entrez ID | Symbol | Replicates | Species | Organ | Tissue | Adj P-value | Log2FC | Malignancy |
| 283899 | INO80E | LZE2T | Human | Esophagus | ESCC | 4.39e-04 | 5.36e-01 | 0.082 |
| 283899 | INO80E | LZE4T | Human | Esophagus | ESCC | 2.02e-10 | 3.34e-01 | 0.0811 |
| 283899 | INO80E | LZE5T | Human | Esophagus | ESCC | 2.01e-02 | 2.90e-01 | 0.0514 |
| 283899 | INO80E | LZE7T | Human | Esophagus | ESCC | 4.91e-17 | 6.14e-01 | 0.0667 |
| 283899 | INO80E | LZE8T | Human | Esophagus | ESCC | 1.83e-12 | 4.61e-01 | 0.067 |
| 283899 | INO80E | LZE20T | Human | Esophagus | ESCC | 3.64e-05 | 2.79e-01 | 0.0662 |
| 283899 | INO80E | LZE22T | Human | Esophagus | ESCC | 4.22e-03 | 5.13e-01 | 0.068 |
| 283899 | INO80E | LZE24T | Human | Esophagus | ESCC | 4.90e-45 | 1.12e+00 | 0.0596 |
| 283899 | INO80E | LZE21T | Human | Esophagus | ESCC | 7.86e-04 | 4.75e-01 | 0.0655 |
| 283899 | INO80E | LZE6T | Human | Esophagus | ESCC | 8.09e-16 | 6.35e-01 | 0.0845 |
| 283899 | INO80E | P1T-E | Human | Esophagus | ESCC | 2.59e-23 | 8.14e-01 | 0.0875 |
| 283899 | INO80E | P2T-E | Human | Esophagus | ESCC | 6.78e-55 | 9.26e-01 | 0.1177 |
| 283899 | INO80E | P4T-E | Human | Esophagus | ESCC | 2.27e-53 | 1.03e+00 | 0.1323 |
| 283899 | INO80E | P5T-E | Human | Esophagus | ESCC | 2.06e-32 | 6.35e-01 | 0.1327 |
| 283899 | INO80E | P8T-E | Human | Esophagus | ESCC | 9.13e-42 | 7.47e-01 | 0.0889 |
| 283899 | INO80E | P9T-E | Human | Esophagus | ESCC | 2.69e-23 | 4.95e-01 | 0.1131 |
| 283899 | INO80E | P10T-E | Human | Esophagus | ESCC | 6.22e-21 | 3.87e-01 | 0.116 |
| 283899 | INO80E | P11T-E | Human | Esophagus | ESCC | 1.73e-29 | 9.28e-01 | 0.1426 |
| 283899 | INO80E | P12T-E | Human | Esophagus | ESCC | 8.81e-54 | 9.17e-01 | 0.1122 |
| 283899 | INO80E | P15T-E | Human | Esophagus | ESCC | 7.38e-30 | 6.38e-01 | 0.1149 |
| Page: 1 2 3 4 5 6 |
| Tissue | Expression Dynamics | Abbreviation |
| Esophagus |  | ESCC: Esophageal squamous cell carcinoma |
| HGIN: High-grade intraepithelial neoplasias | ||
| LGIN: Low-grade intraepithelial neoplasias | ||
| Liver | 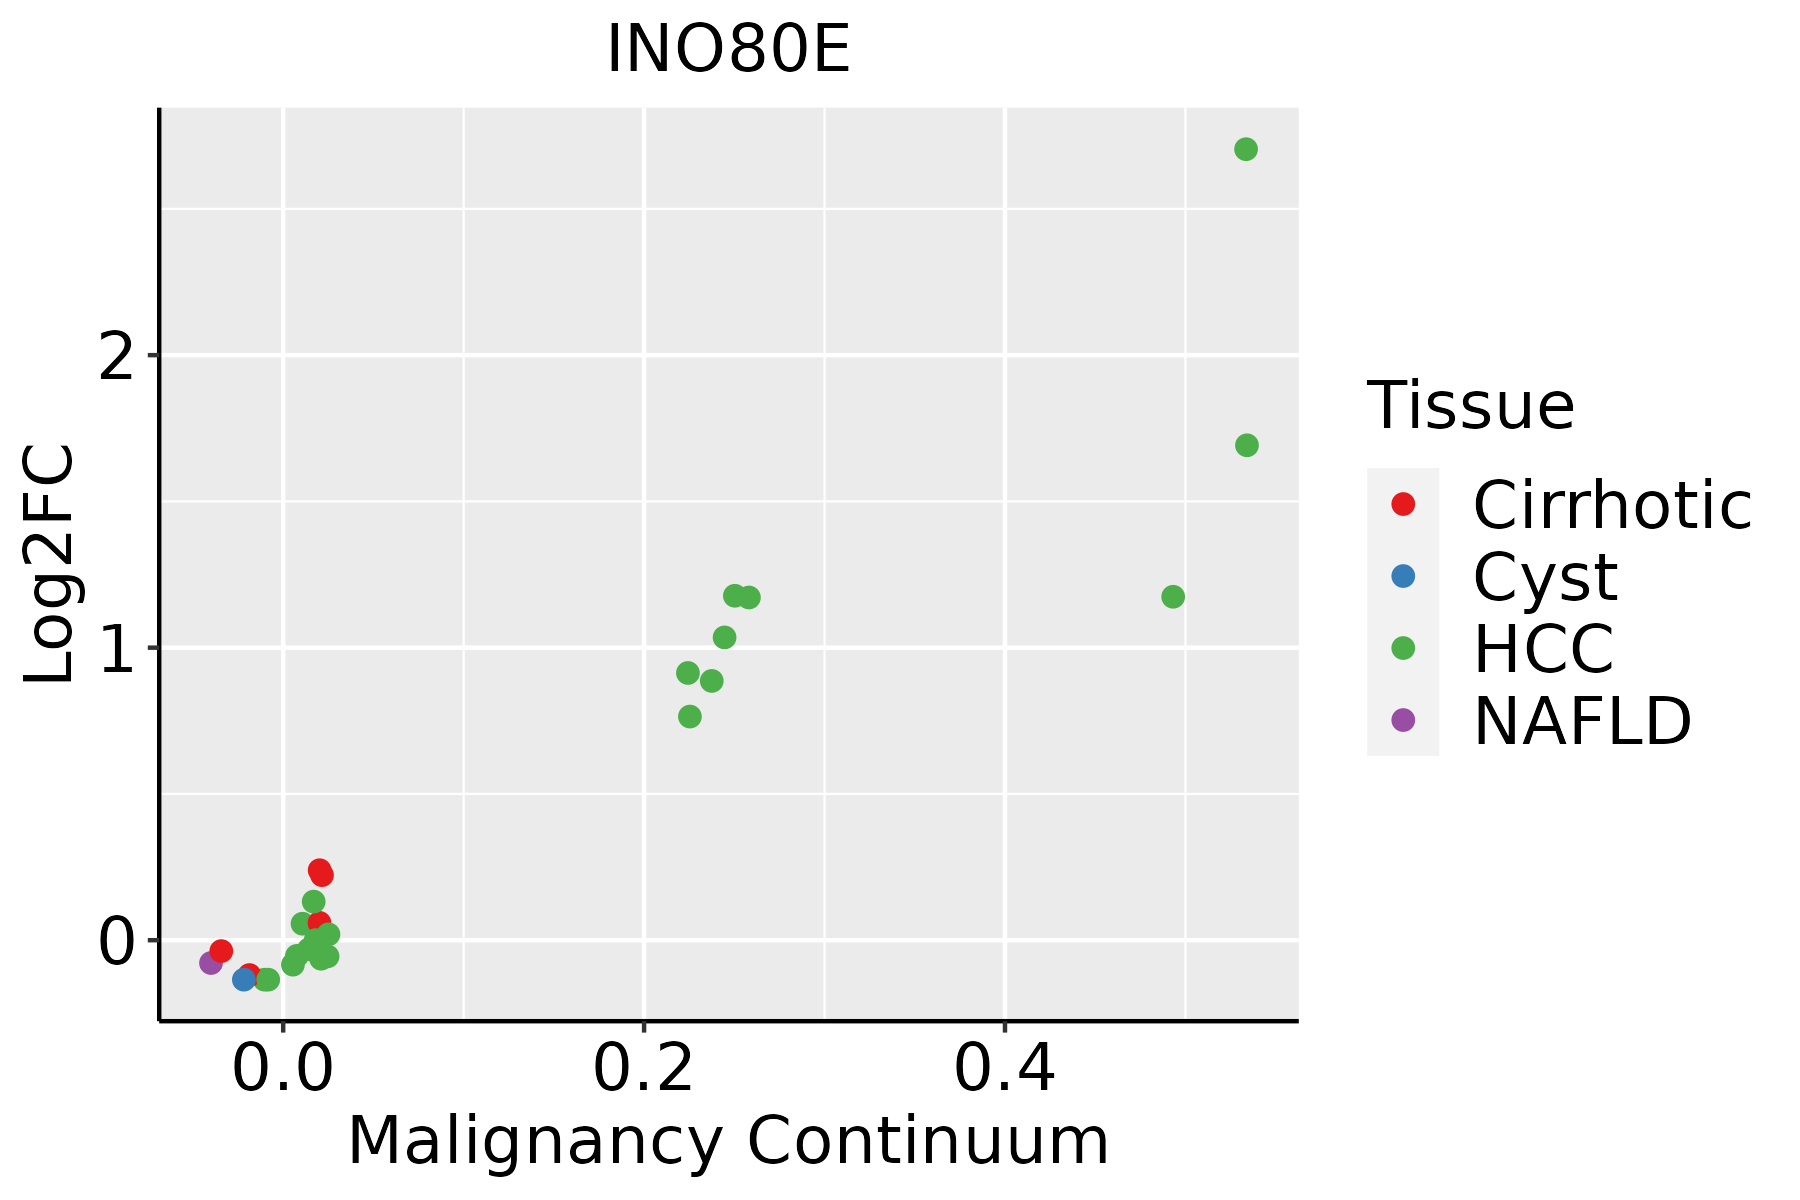 | HCC: Hepatocellular carcinoma |
| NAFLD: Non-alcoholic fatty liver disease | ||
| Oral Cavity | 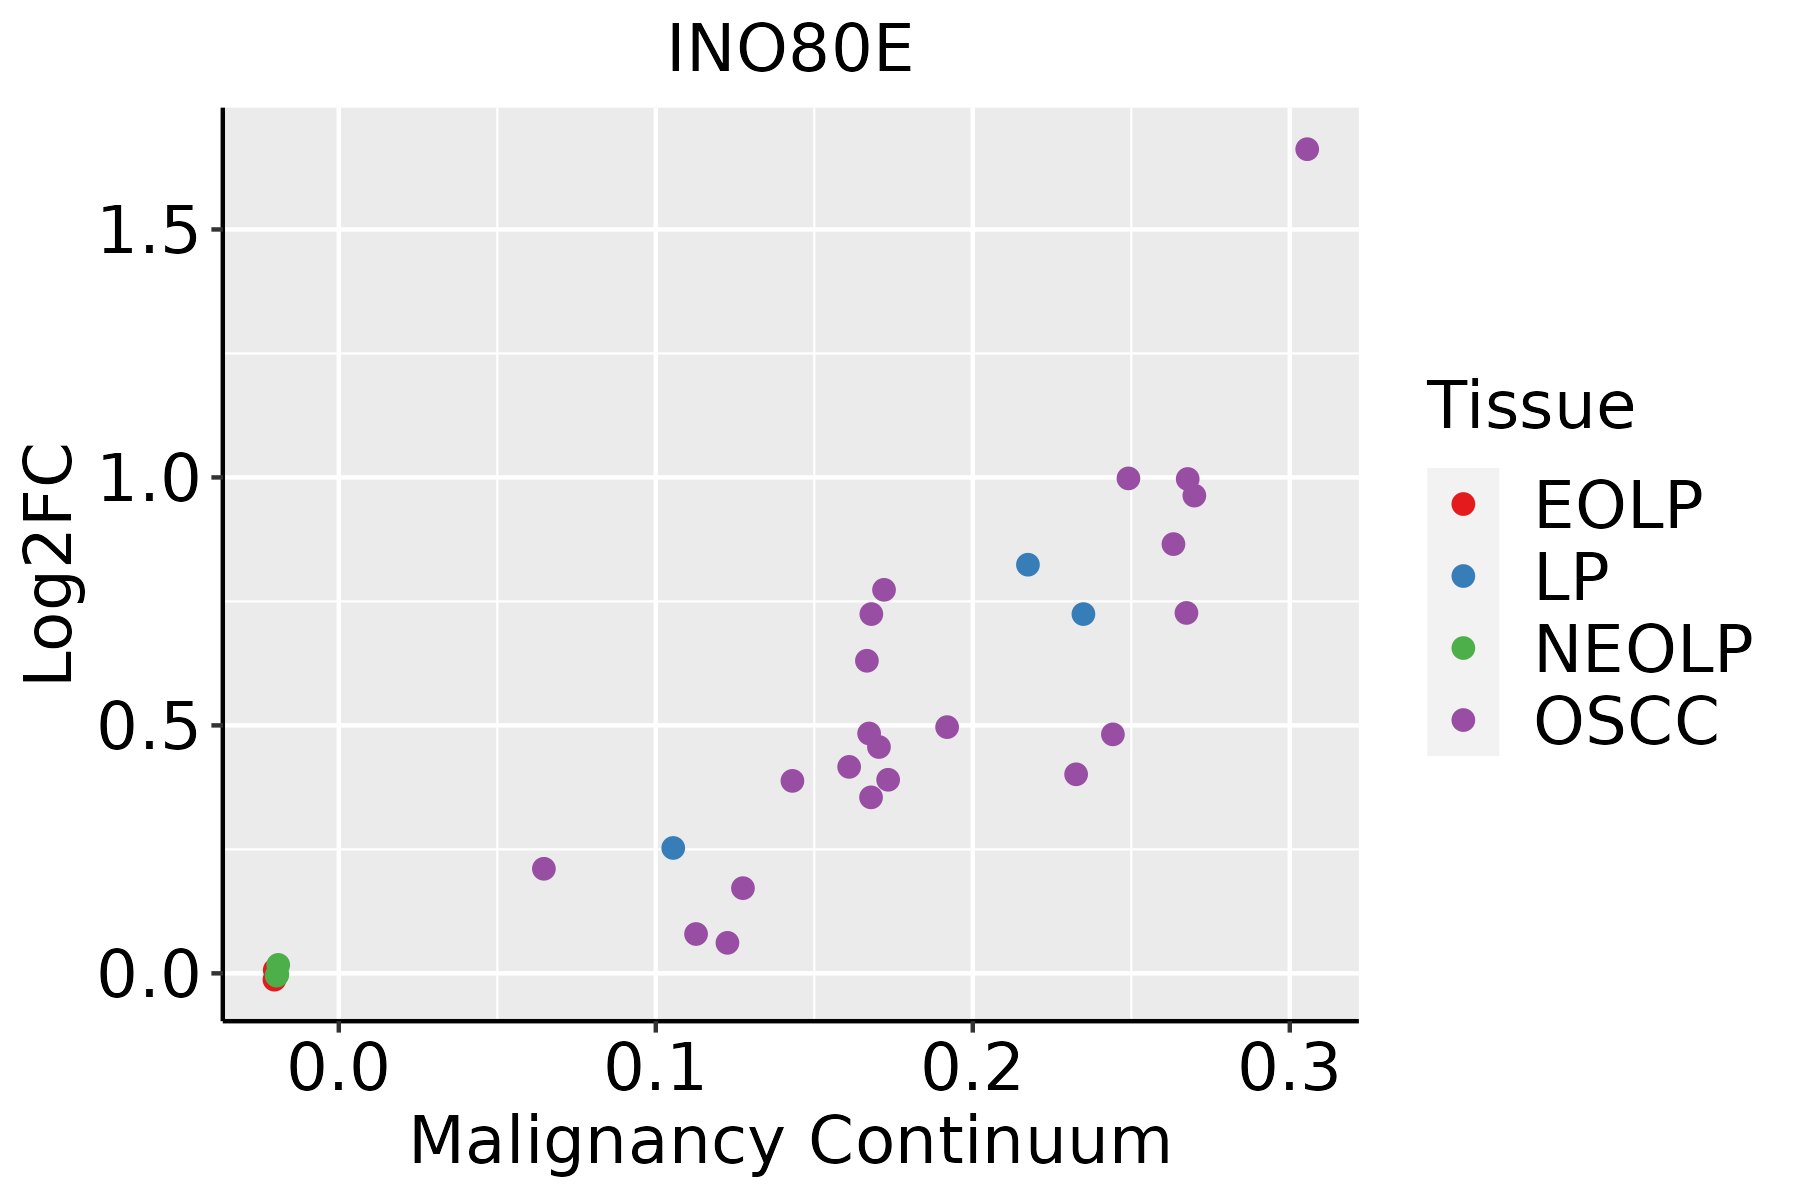 | EOLP: Erosive Oral lichen planus |
| LP: leukoplakia | ||
| NEOLP: Non-erosive oral lichen planus | ||
| OSCC: Oral squamous cell carcinoma | ||
| Skin | 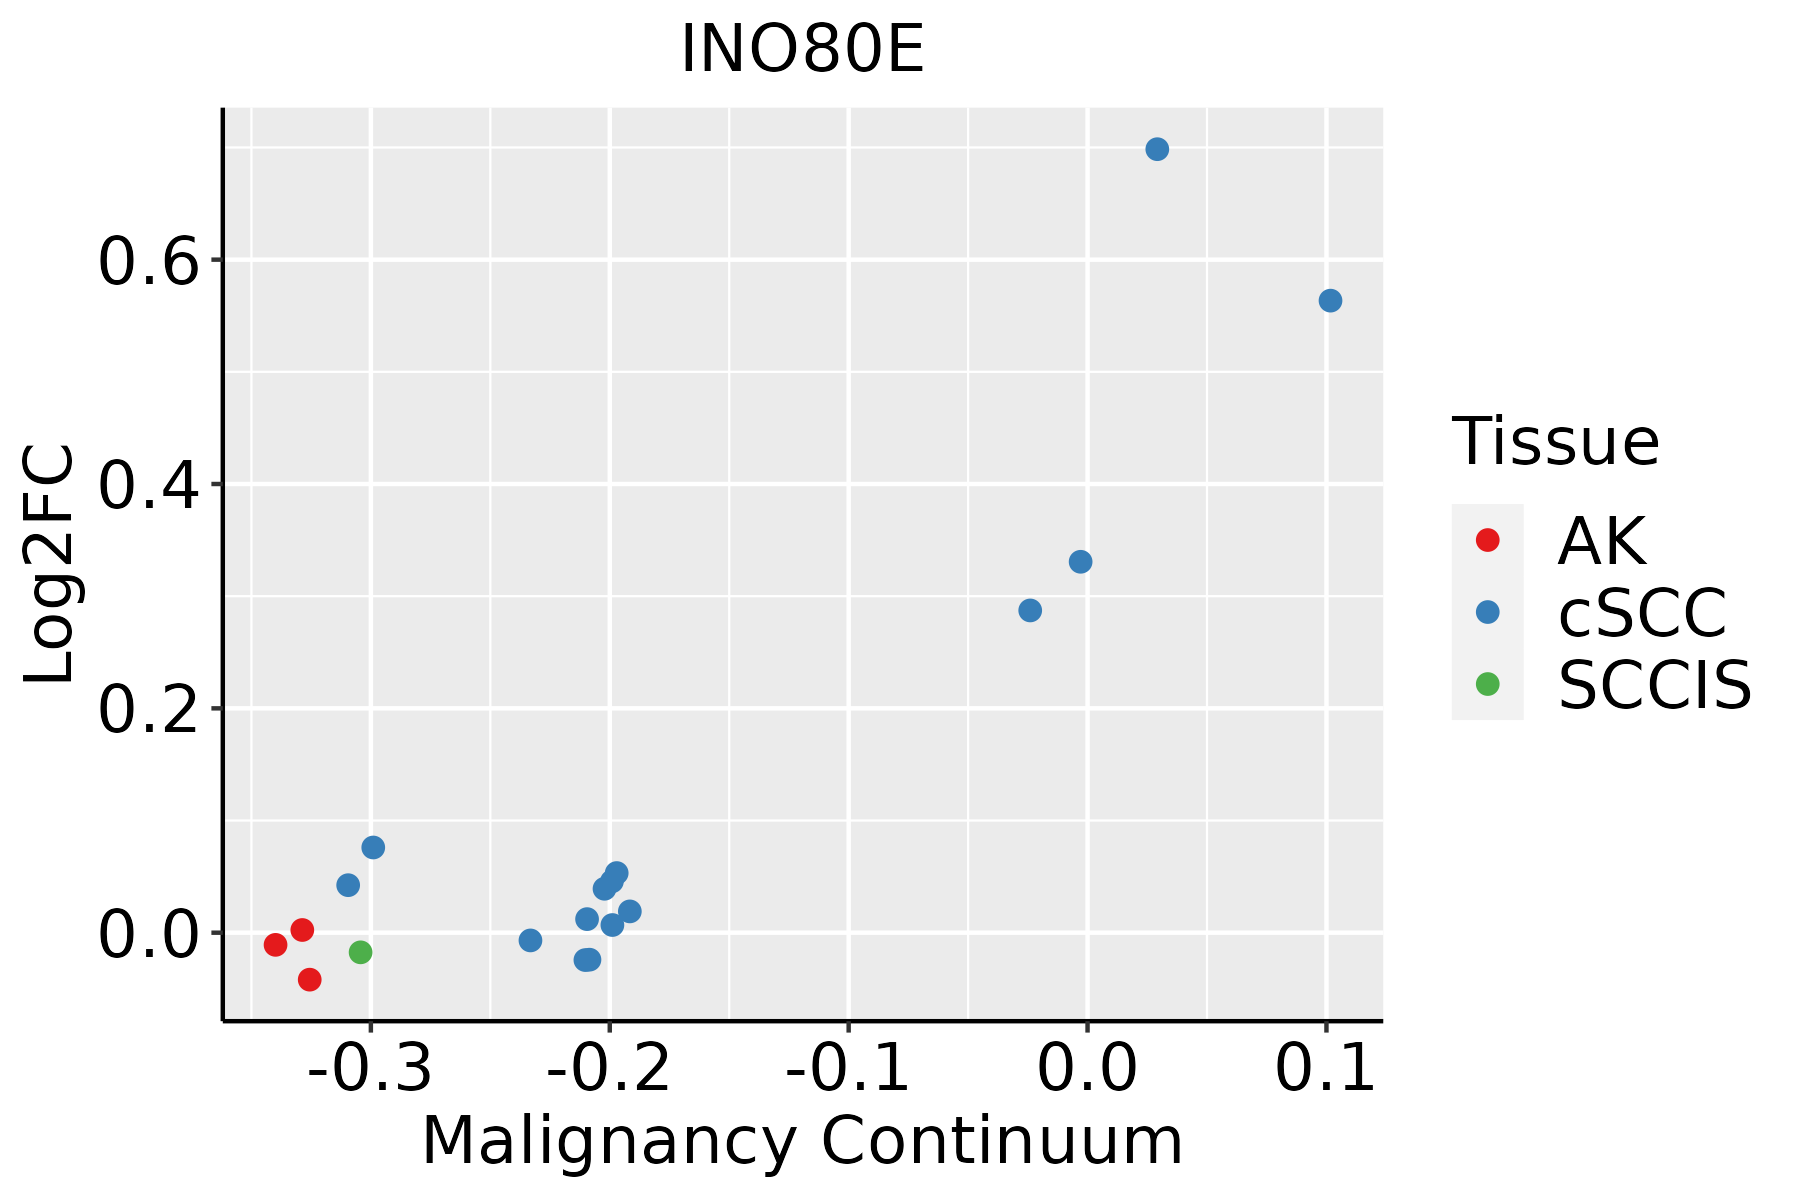 | AK: Actinic keratosis |
| cSCC: Cutaneous squamous cell carcinoma | ||
| SCCIS:squamous cell carcinoma in situ |
| ∗log2FC in expression of this searched gene in stem-like cells from each diseased tissue sample relative to stem-like cells in normal samples in each tissue plotted against the malignancy continuum. Samples are colored based on if they are from different disease stage. |
Top |
Malignant transformation related pathway analysis |
| Find out the enriched GO biological processes and KEGG pathways involved in transition from healthy to precancer to cancer |
| Tissue | Disease Stage | Enriched GO biological Processes |
| Colorectum | AD |  |
| Colorectum | SER |  |
| Colorectum | MSS |  |
| Colorectum | MSI-H |  |
| Colorectum | FAP |  |
| ∗Top 15 enriched GO BP terms are showed in the bar plot of each disease state in each tissue. Each row represents a significant GO biological process which is colored according to the -log10(p.adjust). |
| Page: 1 2 3 4 5 6 7 8 9 |
| GO ID | Tissue | Disease Stage | Description | Gene Ratio | Bg Ratio | pvalue | p.adjust | Count |
| GO:000632517 | Esophagus | ESCC | chromatin organization | 240/8552 | 409/18723 | 6.52e-08 | 1.14e-06 | 240 |
| GO:00063101 | Esophagus | ESCC | DNA recombination | 168/8552 | 305/18723 | 5.58e-04 | 3.05e-03 | 168 |
| GO:000632511 | Liver | HCC | chromatin organization | 206/7958 | 409/18723 | 7.23e-04 | 4.41e-03 | 206 |
| GO:0006310 | Oral cavity | OSCC | DNA recombination | 147/7305 | 305/18723 | 6.33e-04 | 3.56e-03 | 147 |
| GO:000632510 | Oral cavity | OSCC | chromatin organization | 190/7305 | 409/18723 | 1.17e-03 | 5.97e-03 | 190 |
| GO:000632519 | Skin | cSCC | chromatin organization | 147/4864 | 409/18723 | 4.41e-06 | 6.52e-05 | 147 |
| GO:000633812 | Skin | cSCC | chromatin remodeling | 94/4864 | 255/18723 | 7.58e-05 | 7.26e-04 | 94 |
| Page: 1 |
| Pathway ID | Tissue | Disease Stage | Description | Gene Ratio | Bg Ratio | pvalue | p.adjust | qvalue | Count |
| Page: 1 |
Top |
Cell-cell communication analysis |
| Identification of potential cell-cell interactions between two cell types and their ligand-receptor pairs for different disease states |
| Ligand | Receptor | LRpair | Pathway | Tissue | Disease Stage |
| Page: 1 |
Top |
Single-cell gene regulatory network inference analysis |
| Find out the significant the regulons (TFs) and the target genes of each regulon across cell types for different disease states |
| TF | Cell Type | Tissue | Disease Stage | Target Gene | RSS | Regulon Activity |
| ∗The dot plots of a searched regulon are shown for all cell subpopulations in each disease state of each tissue based on the regulon specific score inferred using pySCENIC and by calculating the average expression. |
| Page: 1 |
Top |
Somatic mutation of malignant transformation related genes |
| Annotation of somatic variants for genes involved in malignant transformation |
| Hugo Symbol | Variant Class | Variant Classification | dbSNP RS | HGVSc | HGVSp | HGVSp Short | SWISSPROT | BIOTYPE | SIFT | PolyPhen | Tumor Sample Barcode | Tissue | Histology | Sex | Age | Stage | Therapy Types | Drugs | Outcome |
| INO80E | SNV | Missense_Mutation | c.706N>A | p.Asp236Asn | p.D236N | Q8NBZ0 | protein_coding | tolerated(0.11) | probably_damaging(0.982) | TCGA-C5-A1MK-01 | Cervix | cervical & endocervical cancer | Female | >=65 | III/IV | Chemotherapy | carboplatin | PD | |
| INO80E | deletion | Frame_Shift_Del | rs759306300 | c.633delC | p.Thr212ArgfsTer3 | p.T212Rfs*3 | Q8NBZ0 | protein_coding | TCGA-VS-A9UJ-01 | Cervix | cervical & endocervical cancer | Female | <65 | I/II | Unknown | Unknown | PD | ||
| INO80E | SNV | Missense_Mutation | rs145127821 | c.478C>T | p.Arg160Trp | p.R160W | Q8NBZ0 | protein_coding | deleterious(0) | benign(0.082) | TCGA-AZ-6601-01 | Colorectum | colon adenocarcinoma | Male | >=65 | I/II | Unknown | Unknown | PD |
| INO80E | SNV | Missense_Mutation | c.481G>A | p.Glu161Lys | p.E161K | Q8NBZ0 | protein_coding | tolerated(0.17) | benign(0.043) | TCGA-CK-4951-01 | Colorectum | colon adenocarcinoma | Female | >=65 | I/II | Unknown | Unknown | PD | |
| INO80E | SNV | Missense_Mutation | c.425N>A | p.Pro142His | p.P142H | Q8NBZ0 | protein_coding | deleterious(0.01) | probably_damaging(0.979) | TCGA-G4-6304-01 | Colorectum | colon adenocarcinoma | Female | >=65 | I/II | Chemotherapy | fluorouracil | PD | |
| INO80E | deletion | Frame_Shift_Del | c.531delC | p.Asp178ThrfsTer8 | p.D178Tfs*8 | Q8NBZ0 | protein_coding | TCGA-A6-3809-01 | Colorectum | colon adenocarcinoma | Female | >=65 | I/II | Unknown | Unknown | SD | |||
| INO80E | deletion | Frame_Shift_Del | c.308delG | p.Gly103AlafsTer28 | p.G103Afs*28 | Q8NBZ0 | protein_coding | TCGA-A6-6780-01 | Colorectum | colon adenocarcinoma | Male | >=65 | I/II | Unknown | Unknown | SD | |||
| INO80E | deletion | Frame_Shift_Del | rs759306300 | c.625delN | p.Thr212ArgfsTer3 | p.T212Rfs*3 | Q8NBZ0 | protein_coding | TCGA-AA-3811-01 | Colorectum | colon adenocarcinoma | Female | >=65 | III/IV | Unknown | Unknown | PD | ||
| INO80E | deletion | Frame_Shift_Del | rs759306300 | c.633delC | p.Thr212ArgfsTer3 | p.T212Rfs*3 | Q8NBZ0 | protein_coding | TCGA-AA-3845-01 | Colorectum | colon adenocarcinoma | Female | >=65 | I/II | Unknown | Unknown | PD | ||
| INO80E | deletion | Frame_Shift_Del | rs759306300 | c.633delC | p.Thr212ArgfsTer3 | p.T212Rfs*3 | Q8NBZ0 | protein_coding | TCGA-AD-5900-01 | Colorectum | colon adenocarcinoma | Male | >=65 | I/II | Unknown | Unknown | SD |
| Page: 1 2 3 |
Top |
Related drugs of malignant transformation related genes |
| Identification of chemicals and drugs interact with genes involved in malignant transfromation |
| (DGIdb 4.0) |
| Entrez ID | Symbol | Category | Interaction Types | Drug Claim Name | Drug Name | PMIDs |
| Page: 1 |

Copyright 2023-Present -The University of Texas Health Science Center at Houston |