
|
|||||
|
 | |
| |
| |
| |
| |
| |
|
Gene: INO80D |
Gene summary for INO80D |
| Gene information | Species | Human | Gene symbol | INO80D | Gene ID | 54891 |
| Gene name | INO80 complex subunit D | |
| Gene Alias | INO80D | |
| Cytomap | 2q33.3 | |
| Gene Type | protein-coding | GO ID | GO:0006139 | UniProtAcc | Q53TQ3 |
Top |
Malignant transformation analysis |
| Identification of the aberrant gene expression in precancerous and cancerous lesions by comparing the gene expression of stem-like cells in diseased tissues with normal stem cells |
| Entrez ID | Symbol | Replicates | Species | Organ | Tissue | Adj P-value | Log2FC | Malignancy |
| 54891 | INO80D | HTA11_3410_2000001011 | Human | Colorectum | AD | 2.92e-09 | -5.34e-01 | 0.0155 |
| 54891 | INO80D | HTA11_866_3004761011 | Human | Colorectum | AD | 1.01e-08 | -5.28e-01 | 0.096 |
| 54891 | INO80D | HTA11_10711_2000001011 | Human | Colorectum | AD | 5.72e-05 | -5.64e-01 | 0.0338 |
| 54891 | INO80D | HTA11_7696_3000711011 | Human | Colorectum | AD | 1.07e-09 | -5.26e-01 | 0.0674 |
| 54891 | INO80D | HTA11_11156_2000001011 | Human | Colorectum | AD | 2.57e-17 | 1.62e+00 | 0.0397 |
| 54891 | INO80D | HTA11_99999973899_84307 | Human | Colorectum | MSS | 4.23e-02 | -5.62e-01 | 0.2585 |
| 54891 | INO80D | HTA11_99999974143_84620 | Human | Colorectum | MSS | 1.33e-08 | -4.97e-01 | 0.3005 |
| 54891 | INO80D | A002-C-010 | Human | Colorectum | FAP | 4.44e-03 | -1.33e-01 | 0.242 |
| 54891 | INO80D | A015-C-203 | Human | Colorectum | FAP | 5.60e-142 | 1.31e+00 | -0.1294 |
| 54891 | INO80D | A015-C-204 | Human | Colorectum | FAP | 1.83e-52 | 1.06e+00 | -0.0228 |
| 54891 | INO80D | A014-C-040 | Human | Colorectum | FAP | 1.00e-41 | 1.28e+00 | -0.1184 |
| 54891 | INO80D | A002-C-201 | Human | Colorectum | FAP | 3.84e-92 | 1.20e+00 | 0.0324 |
| 54891 | INO80D | A002-C-203 | Human | Colorectum | FAP | 5.95e-12 | 4.75e-01 | 0.2786 |
| 54891 | INO80D | A001-C-119 | Human | Colorectum | FAP | 2.01e-15 | 5.82e-01 | -0.1557 |
| 54891 | INO80D | A001-C-108 | Human | Colorectum | FAP | 1.02e-11 | -9.51e-02 | -0.0272 |
| 54891 | INO80D | A002-C-205 | Human | Colorectum | FAP | 5.09e-27 | 4.63e-01 | -0.1236 |
| 54891 | INO80D | A014-C-108 | Human | Colorectum | FAP | 3.92e-10 | 5.74e-01 | -0.124 |
| 54891 | INO80D | A001-C-104 | Human | Colorectum | FAP | 3.87e-14 | 4.11e-01 | 0.0184 |
| 54891 | INO80D | A015-C-006 | Human | Colorectum | FAP | 3.84e-13 | 2.66e-01 | -0.0994 |
| 54891 | INO80D | A015-C-106 | Human | Colorectum | FAP | 6.69e-15 | 2.17e-01 | -0.0511 |
| Page: 1 2 3 4 5 6 |
| Tissue | Expression Dynamics | Abbreviation |
| Colorectum (GSE201348) |  | FAP: Familial adenomatous polyposis |
| CRC: Colorectal cancer | ||
| Colorectum (HTA11) |  | AD: Adenomas |
| SER: Sessile serrated lesions | ||
| MSI-H: Microsatellite-high colorectal cancer | ||
| MSS: Microsatellite stable colorectal cancer | ||
| Esophagus | 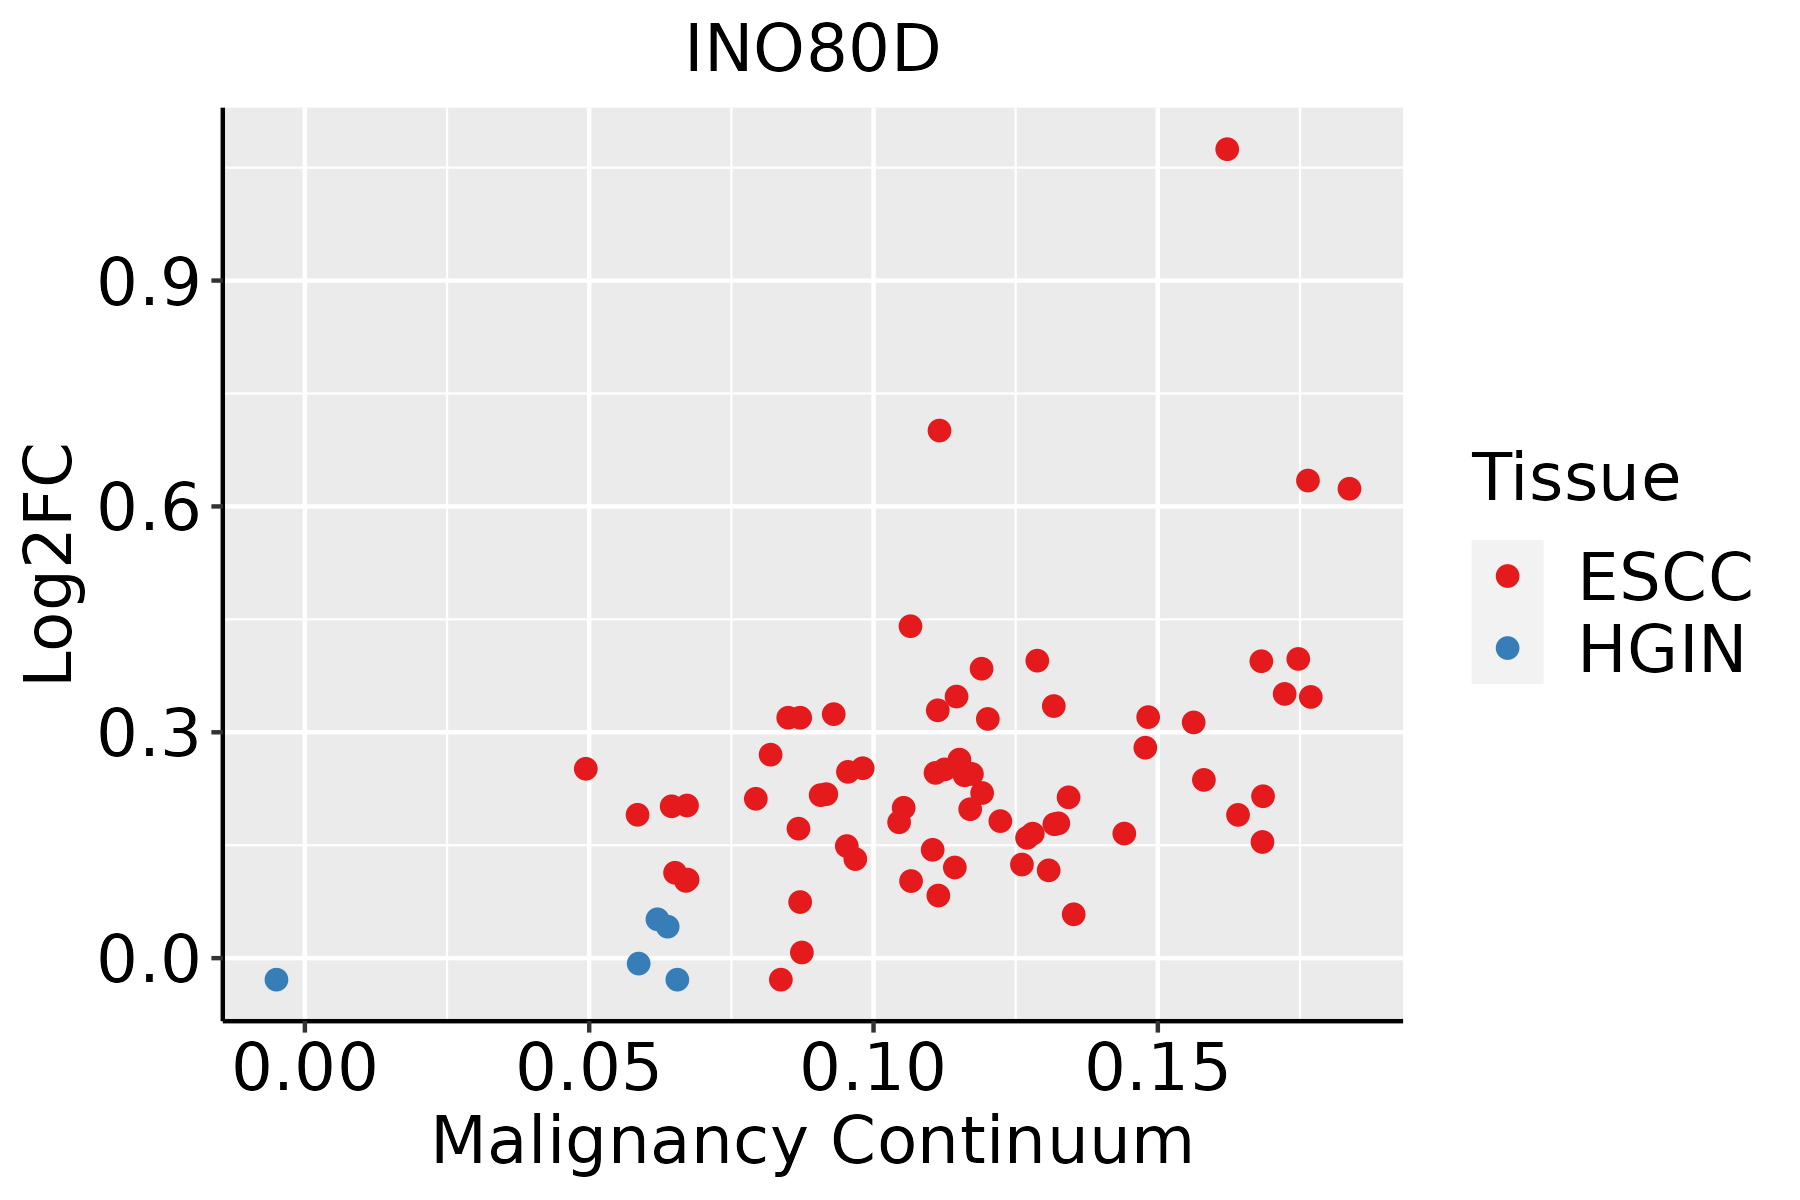 | ESCC: Esophageal squamous cell carcinoma |
| HGIN: High-grade intraepithelial neoplasias | ||
| LGIN: Low-grade intraepithelial neoplasias | ||
| Liver | 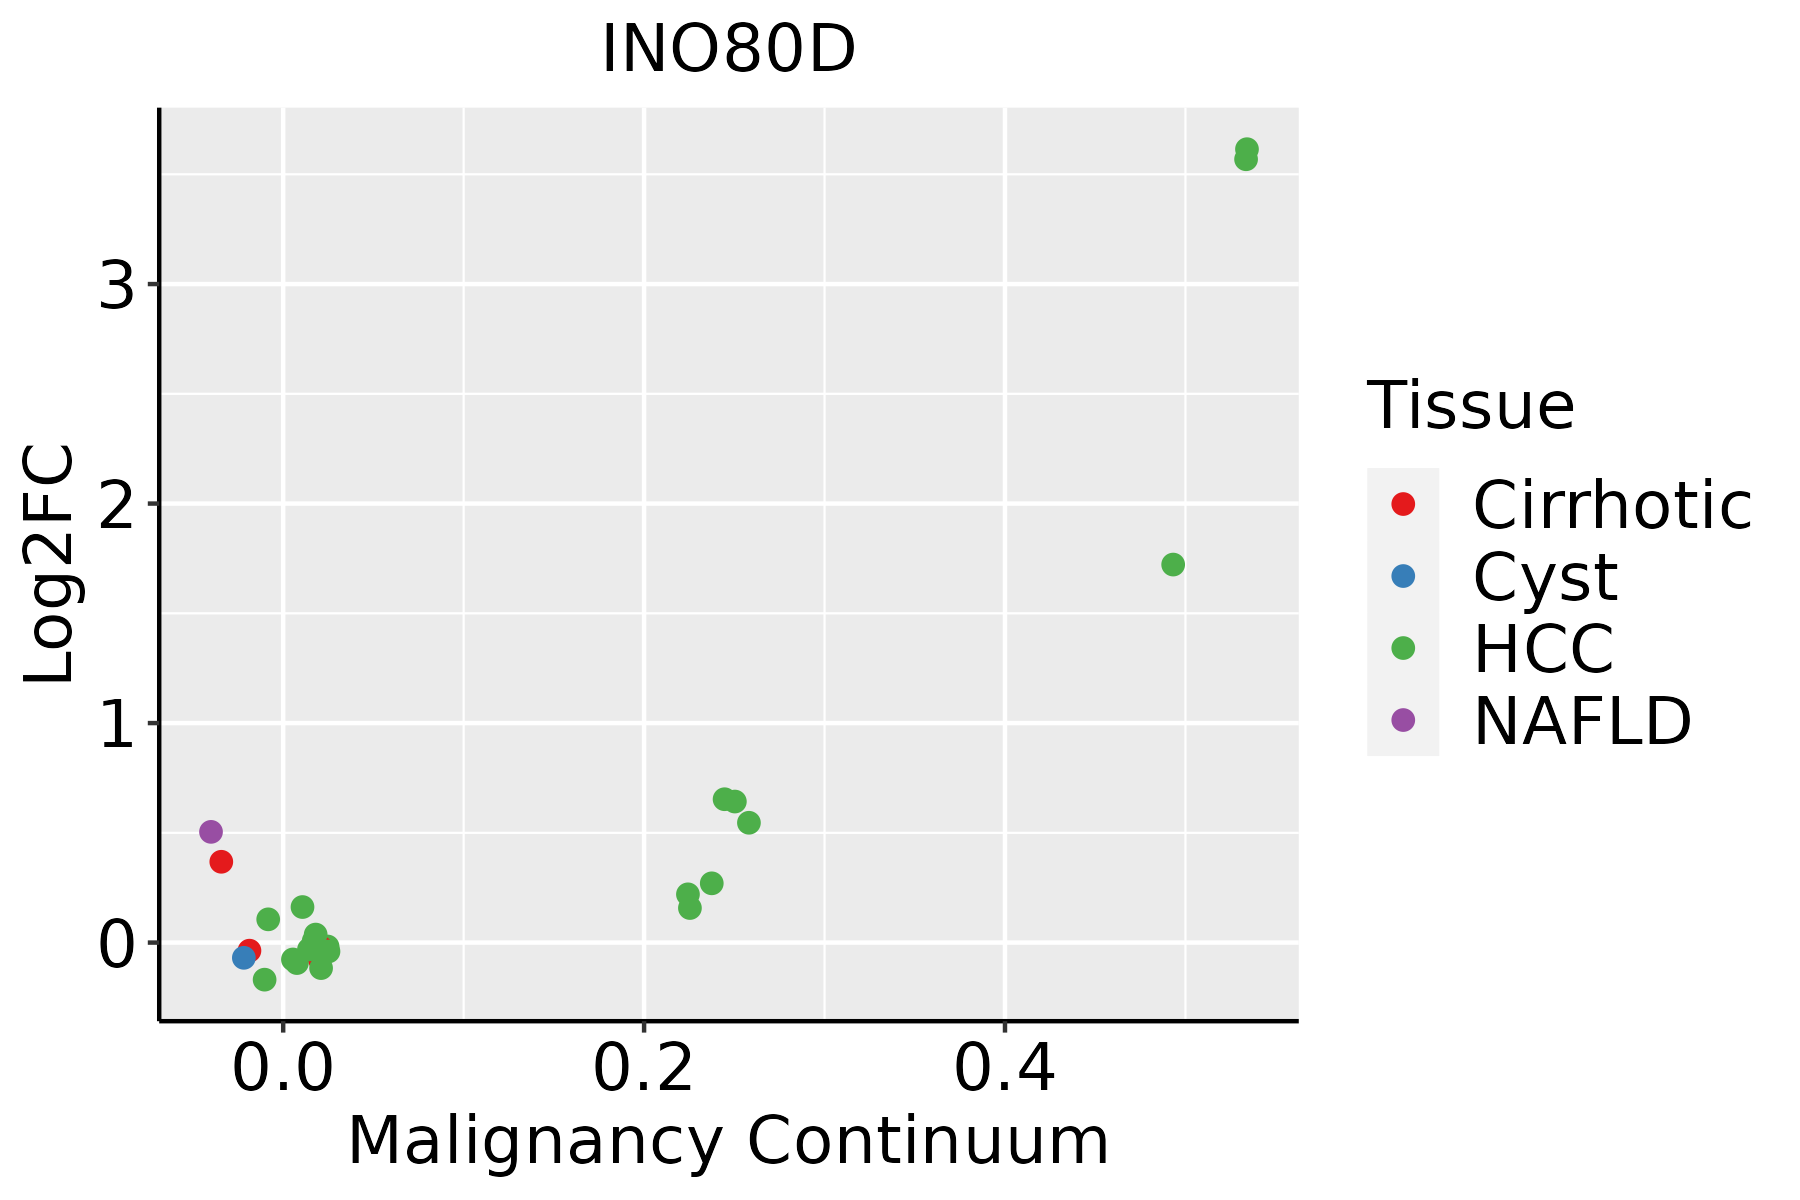 | HCC: Hepatocellular carcinoma |
| NAFLD: Non-alcoholic fatty liver disease | ||
| Thyroid | 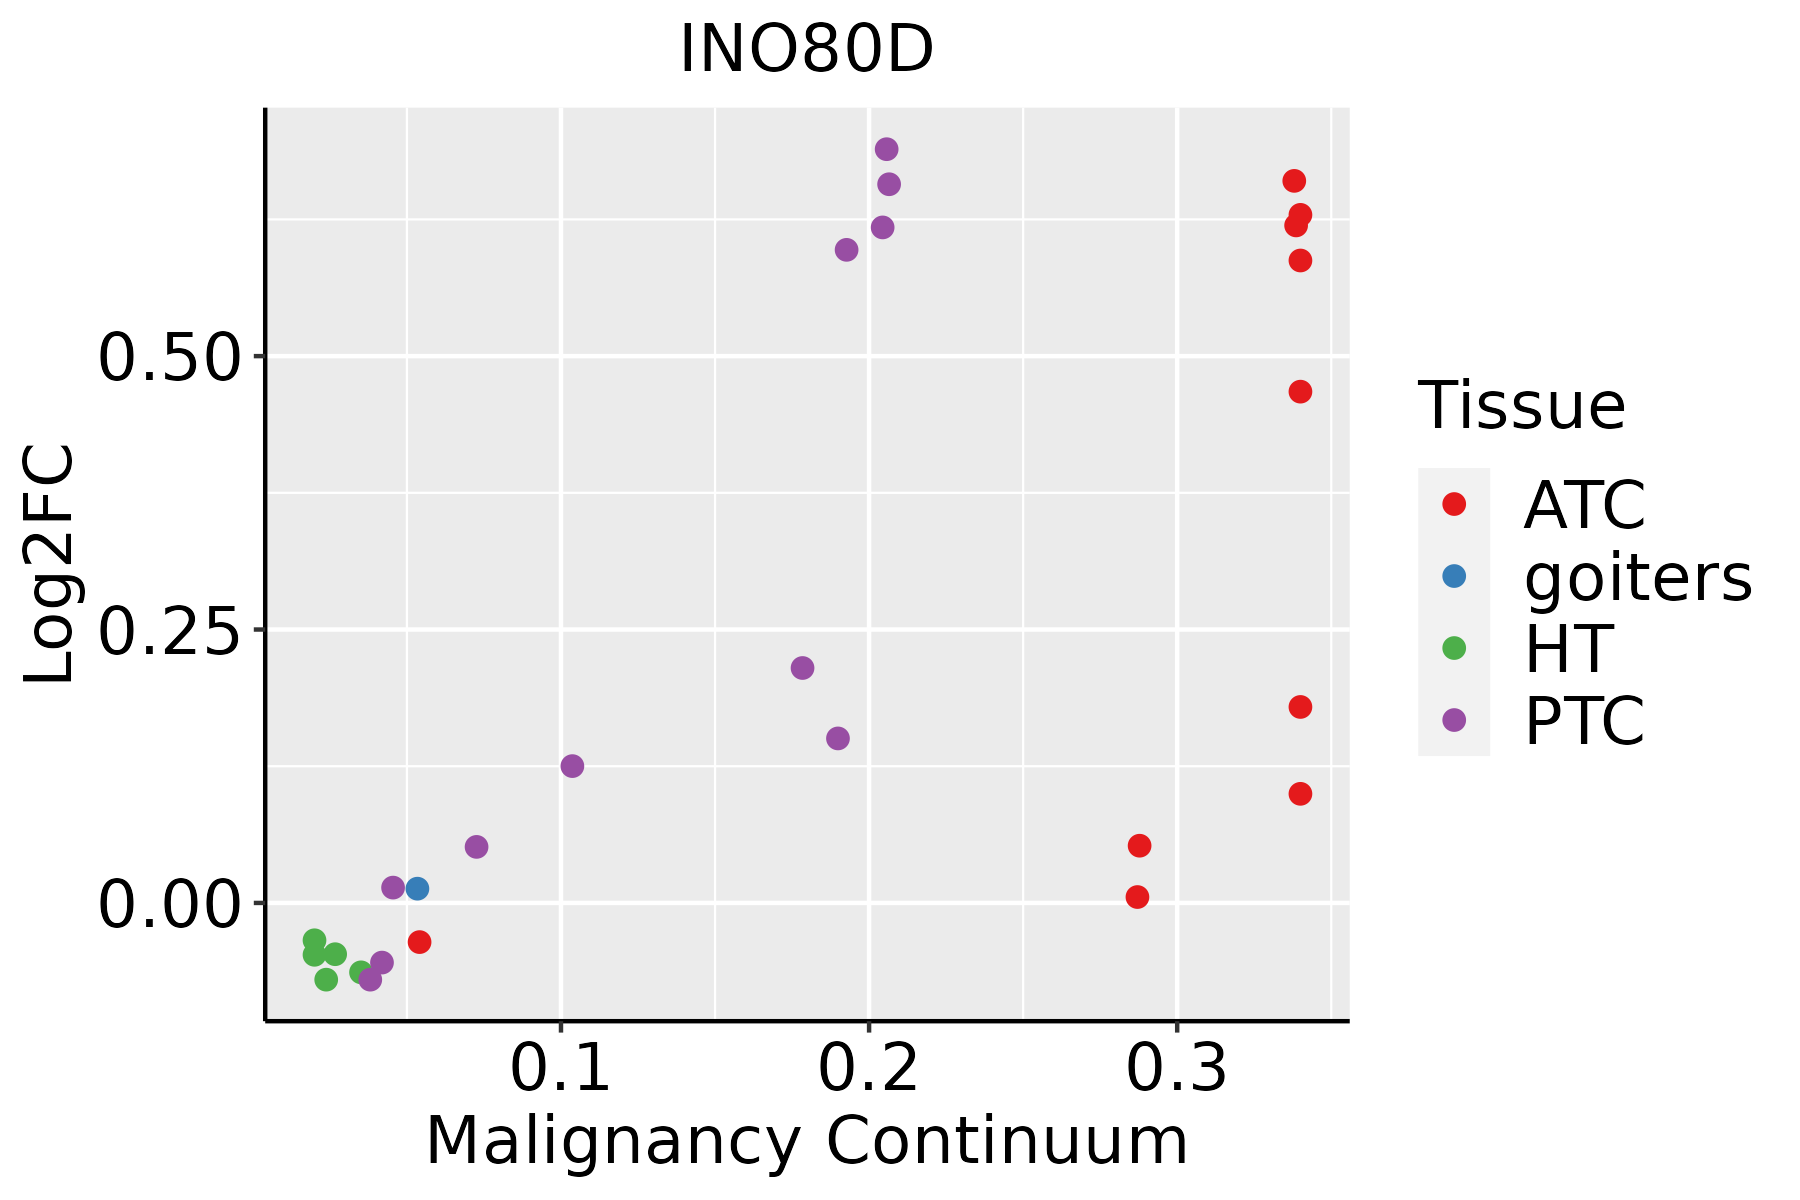 | ATC: Anaplastic thyroid cancer |
| HT: Hashimoto's thyroiditis | ||
| PTC: Papillary thyroid cancer |
| ∗log2FC in expression of this searched gene in stem-like cells from each diseased tissue sample relative to stem-like cells in normal samples in each tissue plotted against the malignancy continuum. Samples are colored based on if they are from different disease stage. |
Top |
Malignant transformation related pathway analysis |
| Find out the enriched GO biological processes and KEGG pathways involved in transition from healthy to precancer to cancer |
| Tissue | Disease Stage | Enriched GO biological Processes |
| Colorectum | AD |  |
| Colorectum | SER |  |
| Colorectum | MSS |  |
| Colorectum | MSI-H |  |
| Colorectum | FAP |  |
| ∗Top 15 enriched GO BP terms are showed in the bar plot of each disease state in each tissue. Each row represents a significant GO biological process which is colored according to the -log10(p.adjust). |
| Page: 1 2 3 4 5 6 7 8 9 |
| GO ID | Tissue | Disease Stage | Description | Gene Ratio | Bg Ratio | pvalue | p.adjust | Count |
| GO:00063101 | Esophagus | ESCC | DNA recombination | 168/8552 | 305/18723 | 5.58e-04 | 3.05e-03 | 168 |
| Page: 1 |
| Pathway ID | Tissue | Disease Stage | Description | Gene Ratio | Bg Ratio | pvalue | p.adjust | qvalue | Count |
| Page: 1 |
Top |
Cell-cell communication analysis |
| Identification of potential cell-cell interactions between two cell types and their ligand-receptor pairs for different disease states |
| Ligand | Receptor | LRpair | Pathway | Tissue | Disease Stage |
| Page: 1 |
Top |
Single-cell gene regulatory network inference analysis |
| Find out the significant the regulons (TFs) and the target genes of each regulon across cell types for different disease states |
| TF | Cell Type | Tissue | Disease Stage | Target Gene | RSS | Regulon Activity |
| ∗The dot plots of a searched regulon are shown for all cell subpopulations in each disease state of each tissue based on the regulon specific score inferred using pySCENIC and by calculating the average expression. |
| Page: 1 |
Top |
Somatic mutation of malignant transformation related genes |
| Annotation of somatic variants for genes involved in malignant transformation |
| Hugo Symbol | Variant Class | Variant Classification | dbSNP RS | HGVSc | HGVSp | HGVSp Short | SWISSPROT | BIOTYPE | SIFT | PolyPhen | Tumor Sample Barcode | Tissue | Histology | Sex | Age | Stage | Therapy Types | Drugs | Outcome |
| INO80D | SNV | Missense_Mutation | novel | c.2728G>A | p.Asp910Asn | p.D910N | Q53TQ3 | protein_coding | deleterious_low_confidence(0) | possibly_damaging(0.873) | TCGA-5L-AAT1-01 | Breast | breast invasive carcinoma | Female | <65 | III/IV | Hormone Therapy | letrozol | SD |
| INO80D | SNV | Missense_Mutation | novel | c.294T>G | p.Asp98Glu | p.D98E | Q53TQ3 | protein_coding | tolerated_low_confidence(1) | benign(0) | TCGA-A7-A0CJ-01 | Breast | breast invasive carcinoma | Female | <65 | I/II | Chemotherapy | cytoxan | SD |
| INO80D | SNV | Missense_Mutation | c.2200N>T | p.Asn734Tyr | p.N734Y | Q53TQ3 | protein_coding | deleterious(0) | possibly_damaging(0.452) | TCGA-AC-A23H-01 | Breast | breast invasive carcinoma | Female | >=65 | I/II | Unknown | Unknown | PD | |
| INO80D | SNV | Missense_Mutation | c.841N>T | p.Asp281Tyr | p.D281Y | Q53TQ3 | protein_coding | deleterious_low_confidence(0.01) | possibly_damaging(0.568) | TCGA-AC-A23H-01 | Breast | breast invasive carcinoma | Female | >=65 | I/II | Unknown | Unknown | PD | |
| INO80D | SNV | Missense_Mutation | novel | c.2584N>A | p.Ala862Thr | p.A862T | Q53TQ3 | protein_coding | tolerated_low_confidence(0.35) | benign(0.001) | TCGA-BH-A0HF-01 | Breast | breast invasive carcinoma | Female | >=65 | I/II | Hormone Therapy | arimidex | SD |
| INO80D | SNV | Missense_Mutation | rs373314822 | c.1273N>T | p.Arg425Trp | p.R425W | Q53TQ3 | protein_coding | deleterious(0.03) | possibly_damaging(0.51) | TCGA-D8-A1XQ-01 | Breast | breast invasive carcinoma | Female | >=65 | I/II | Unknown | Unknown | SD |
| INO80D | SNV | Missense_Mutation | c.2744C>A | p.Ser915Tyr | p.S915Y | Q53TQ3 | protein_coding | deleterious_low_confidence(0) | probably_damaging(0.997) | TCGA-E9-A1R7-01 | Breast | breast invasive carcinoma | Female | <65 | I/II | Hormone Therapy | fareston | SD | |
| INO80D | SNV | Missense_Mutation | novel | c.1831N>A | p.Pro611Thr | p.P611T | Q53TQ3 | protein_coding | deleterious(0.03) | probably_damaging(0.998) | TCGA-LL-A5YP-01 | Breast | breast invasive carcinoma | Female | <65 | I/II | Chemotherapy | cytoxan | SD |
| INO80D | insertion | In_Frame_Ins | novel | c.292_293insCGCCACCGC | p.Asp98delinsAlaProProHis | p.D98delinsAPPH | Q53TQ3 | protein_coding | TCGA-A7-A0CJ-01 | Breast | breast invasive carcinoma | Female | <65 | I/II | Chemotherapy | cytoxan | SD | ||
| INO80D | insertion | Frame_Shift_Ins | novel | c.1803_1804insACACAGCC | p.Asp602ThrfsTer18 | p.D602Tfs*18 | Q53TQ3 | protein_coding | TCGA-A8-A08S-01 | Breast | breast invasive carcinoma | Female | >=65 | I/II | Hormone Therapy | anastrozole | SD |
| Page: 1 2 3 4 5 6 7 8 9 10 |
Top |
Related drugs of malignant transformation related genes |
| Identification of chemicals and drugs interact with genes involved in malignant transfromation |
| (DGIdb 4.0) |
| Entrez ID | Symbol | Category | Interaction Types | Drug Claim Name | Drug Name | PMIDs |
| Page: 1 |

Copyright 2023-Present -The University of Texas Health Science Center at Houston |