| Tissue | Expression Dynamics | Abbreviation |
| Cervix | 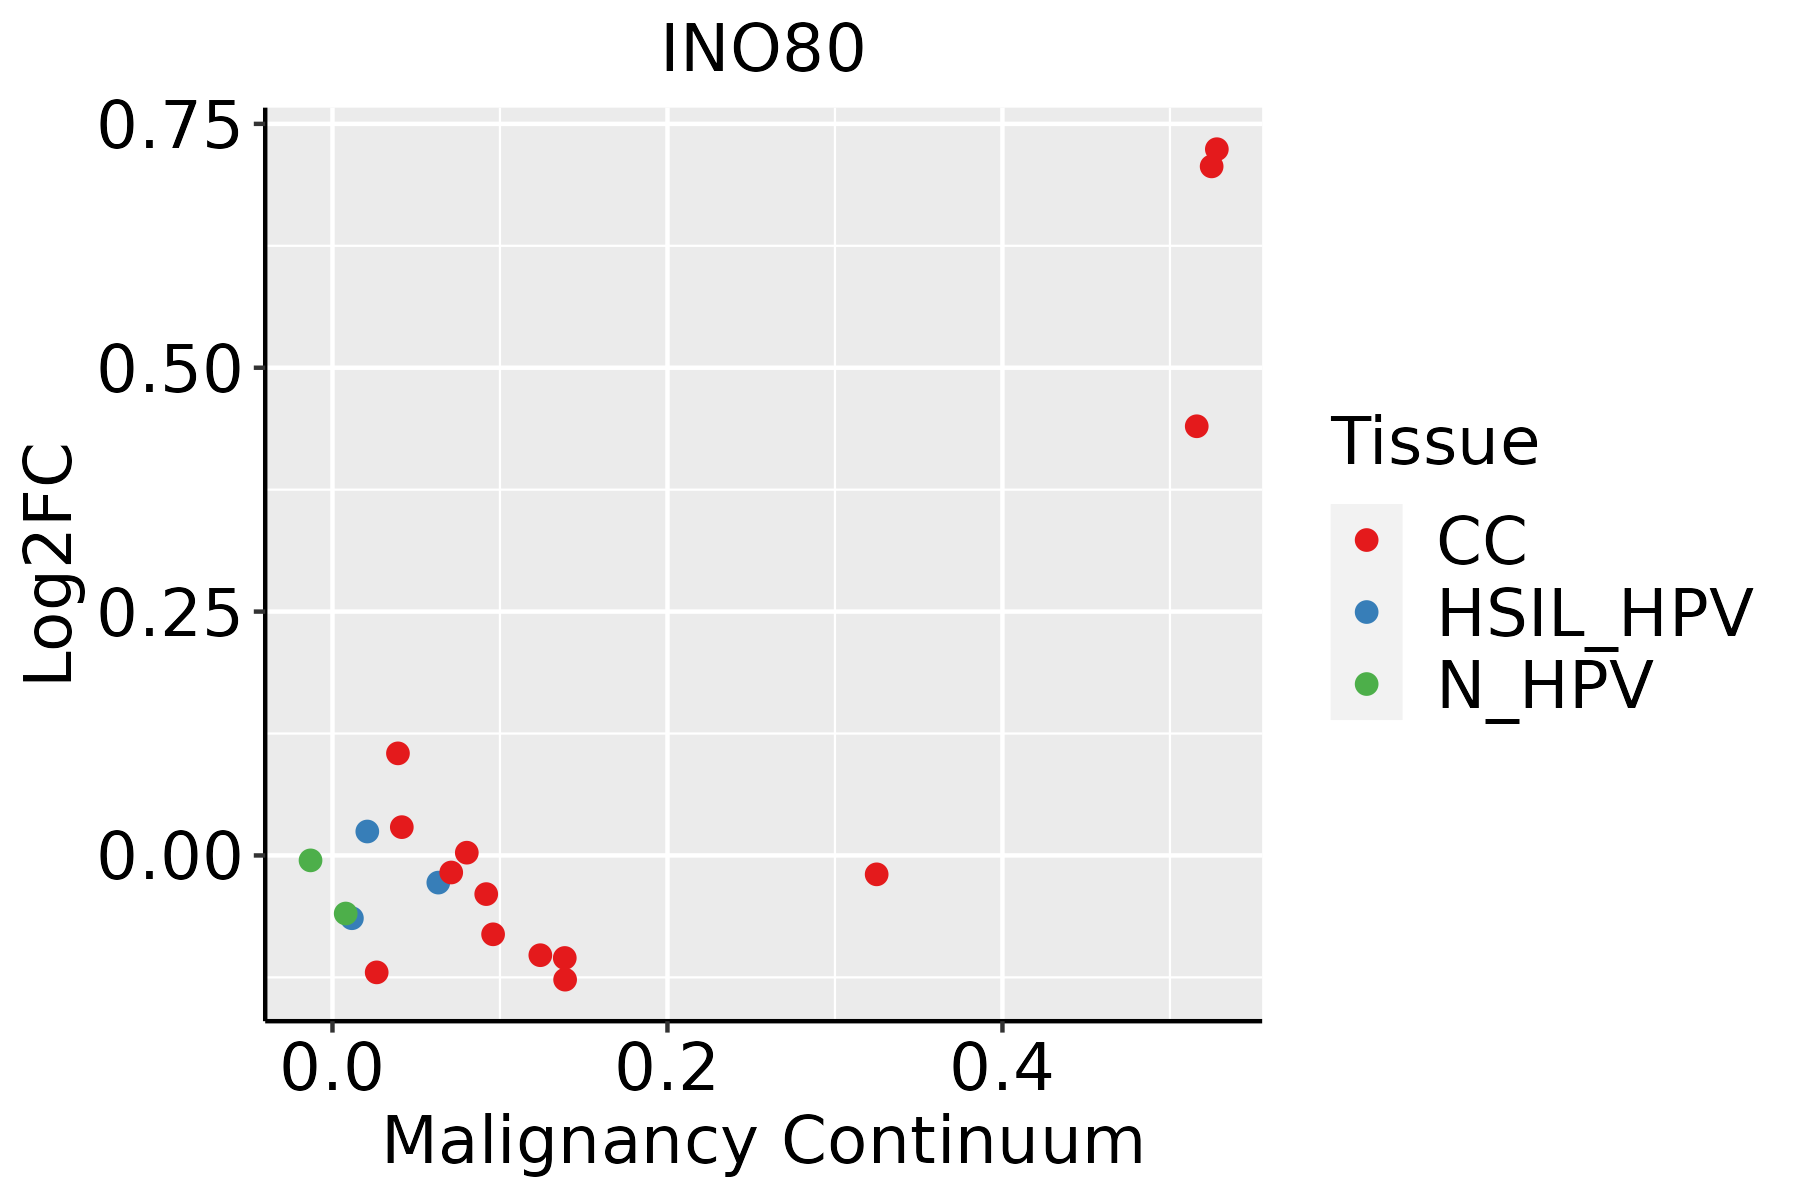 | CC: Cervix cancer |
| HSIL_HPV: HPV-infected high-grade squamous intraepithelial lesions |
| N_HPV: HPV-infected normal cervix |
| Esophagus |  | ESCC: Esophageal squamous cell carcinoma |
| HGIN: High-grade intraepithelial neoplasias |
| LGIN: Low-grade intraepithelial neoplasias |
| Liver | 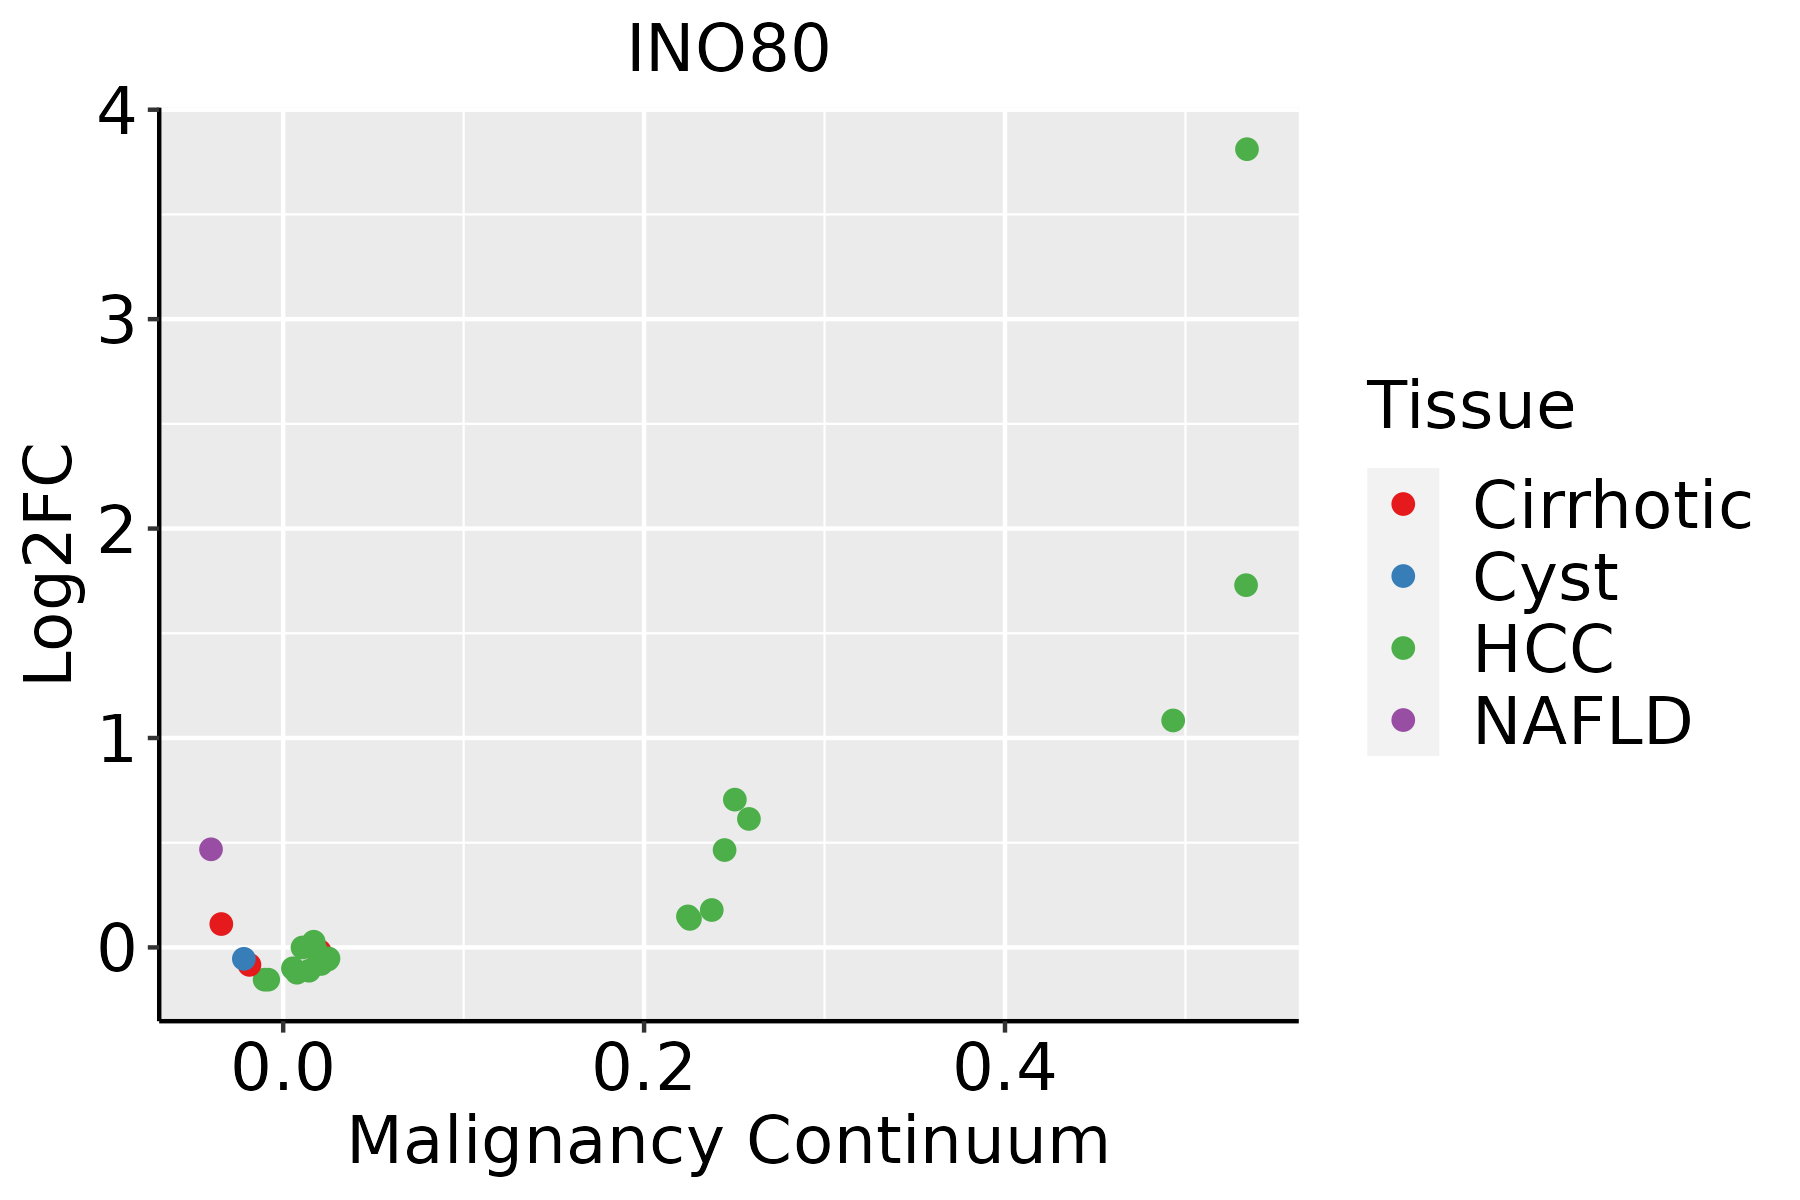 | HCC: Hepatocellular carcinoma |
| NAFLD: Non-alcoholic fatty liver disease |
| Lung | 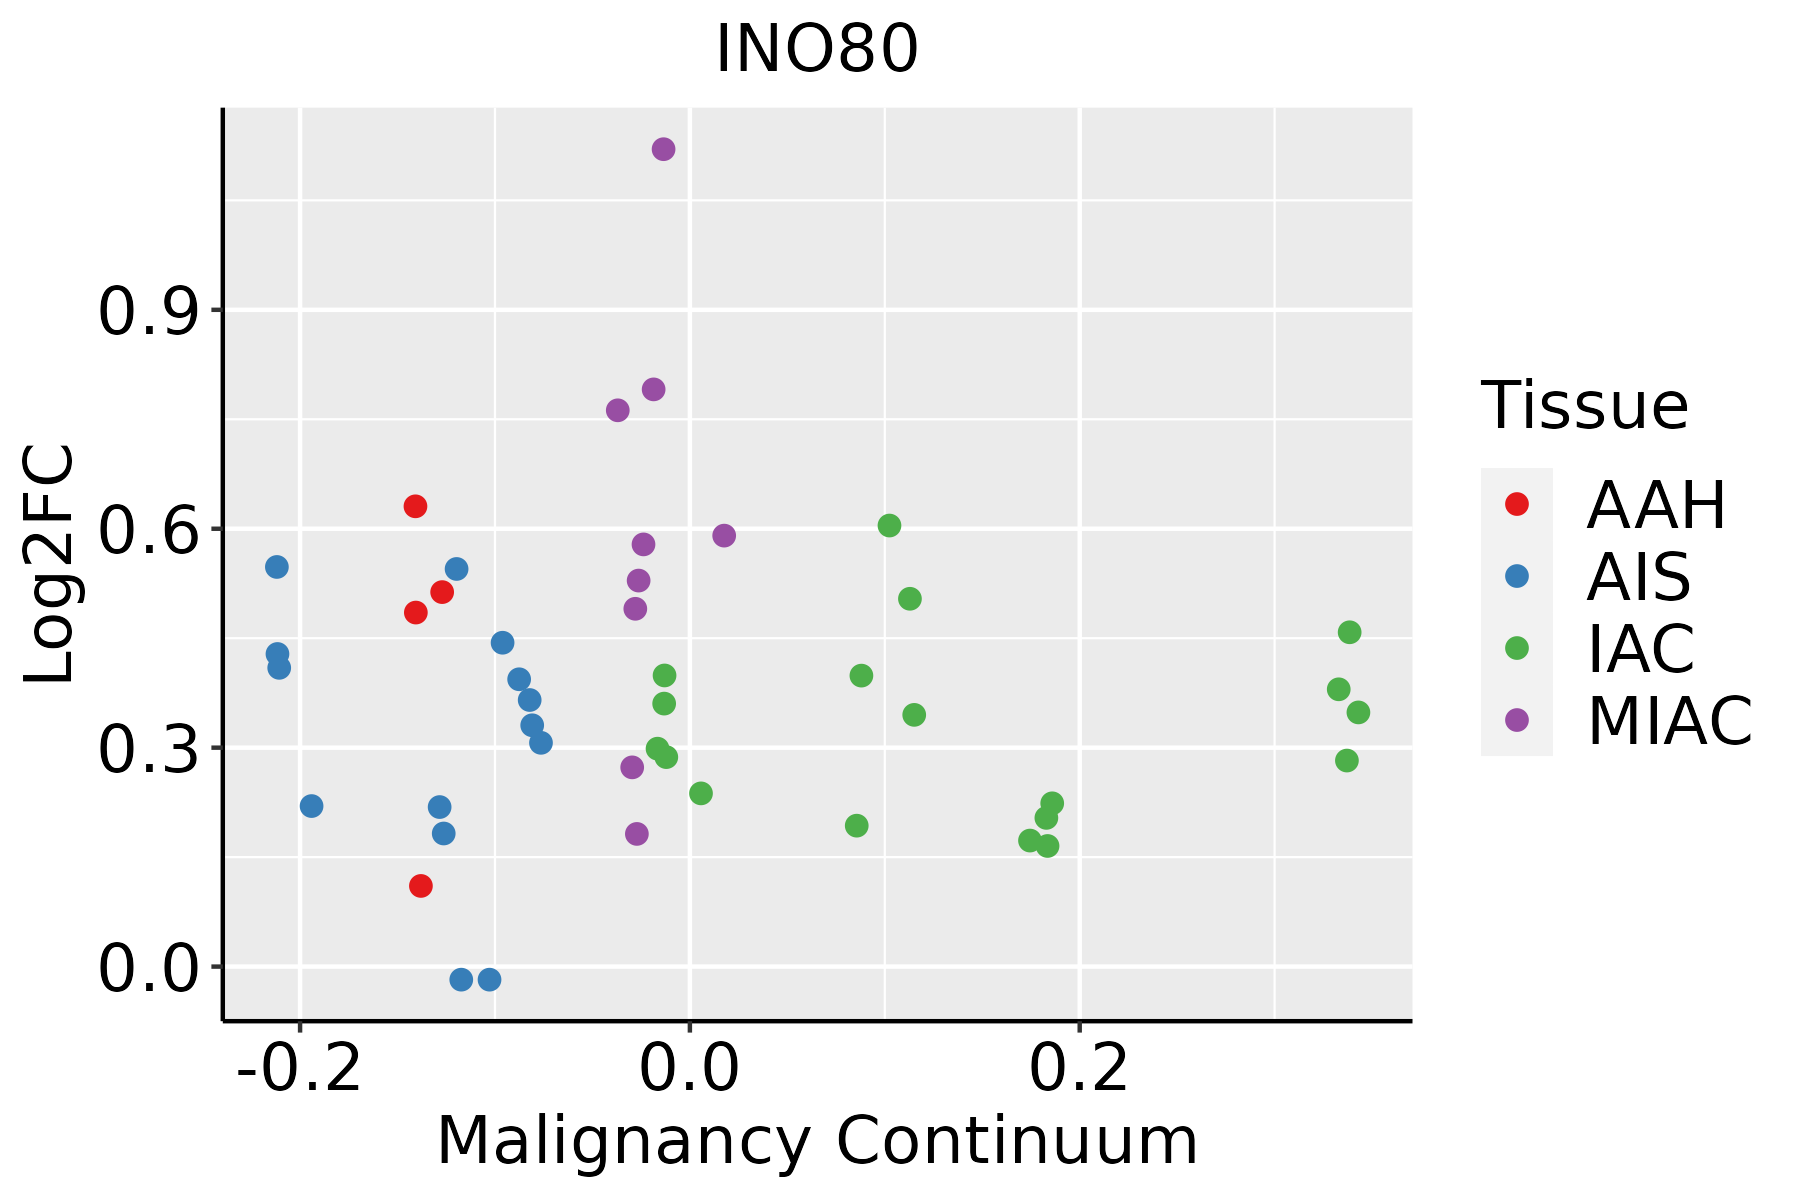 | AAH: Atypical adenomatous hyperplasia |
| AIS: Adenocarcinoma in situ |
| IAC: Invasive lung adenocarcinoma |
| MIA: Minimally invasive adenocarcinoma |
| Thyroid | 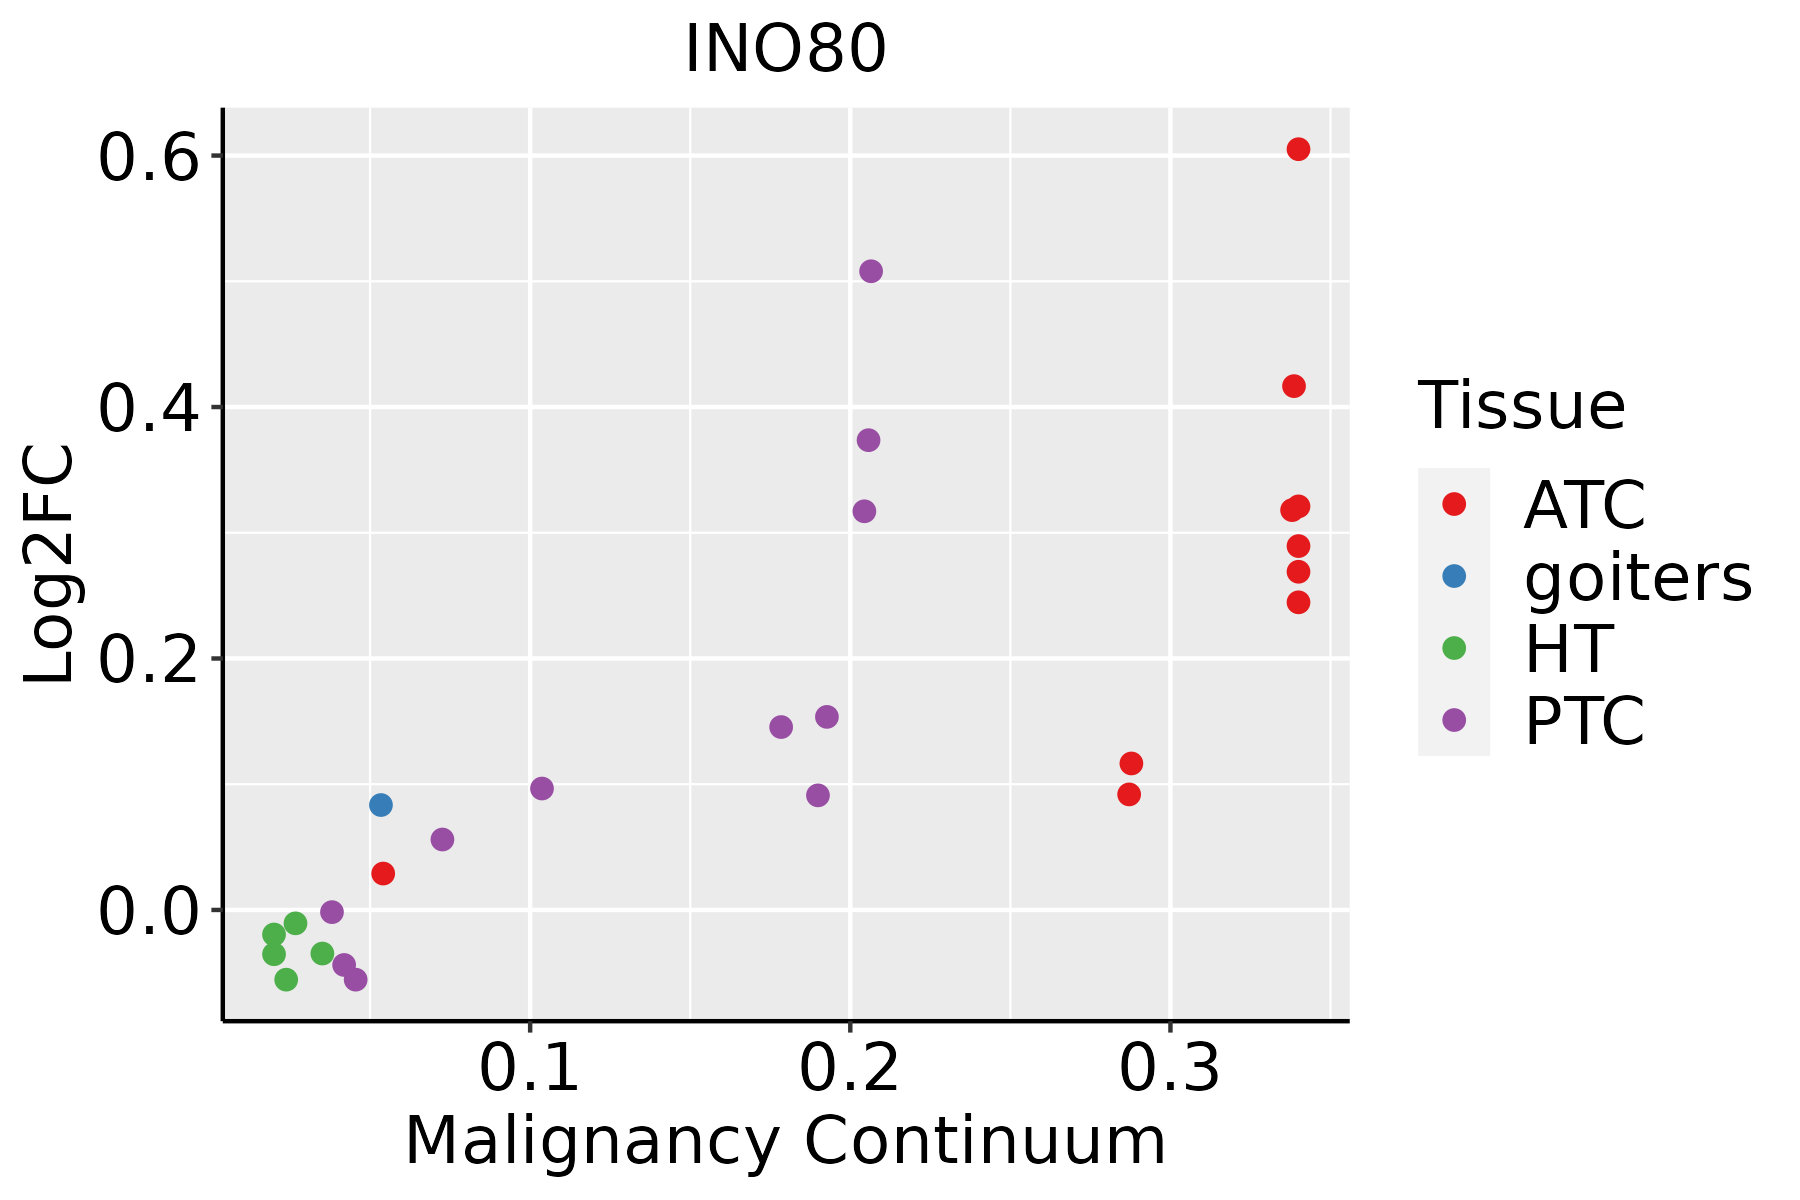 | ATC: Anaplastic thyroid cancer |
| HT: Hashimoto's thyroiditis |
| PTC: Papillary thyroid cancer |
| GO ID | Tissue | Disease Stage | Description | Gene Ratio | Bg Ratio | pvalue | p.adjust | Count |
| GO:004361810 | Cervix | CC | regulation of transcription from RNA polymerase II promoter in response to stress | 21/2311 | 47/18723 | 3.85e-08 | 2.53e-06 | 21 |
| GO:004362010 | Cervix | CC | regulation of DNA-templated transcription in response to stress | 22/2311 | 53/18723 | 9.29e-08 | 5.19e-06 | 22 |
| GO:00447725 | Cervix | CC | mitotic cell cycle phase transition | 89/2311 | 424/18723 | 2.70e-07 | 1.12e-05 | 89 |
| GO:20000453 | Cervix | CC | regulation of G1/S transition of mitotic cell cycle | 37/2311 | 142/18723 | 6.33e-06 | 1.53e-04 | 37 |
| GO:00712148 | Cervix | CC | cellular response to abiotic stimulus | 69/2311 | 331/18723 | 7.36e-06 | 1.73e-04 | 69 |
| GO:01040048 | Cervix | CC | cellular response to environmental stimulus | 69/2311 | 331/18723 | 7.36e-06 | 1.73e-04 | 69 |
| GO:00457876 | Cervix | CC | positive regulation of cell cycle | 66/2311 | 313/18723 | 7.78e-06 | 1.81e-04 | 66 |
| GO:00000824 | Cervix | CC | G1/S transition of mitotic cell cycle | 49/2311 | 214/18723 | 1.16e-05 | 2.48e-04 | 49 |
| GO:00160498 | Cervix | CC | cell growth | 92/2311 | 482/18723 | 1.16e-05 | 2.49e-04 | 92 |
| GO:19028062 | Cervix | CC | regulation of cell cycle G1/S phase transition | 41/2311 | 168/18723 | 1.18e-05 | 2.51e-04 | 41 |
| GO:00073466 | Cervix | CC | regulation of mitotic cell cycle | 88/2311 | 457/18723 | 1.26e-05 | 2.60e-04 | 88 |
| GO:19019903 | Cervix | CC | regulation of mitotic cell cycle phase transition | 63/2311 | 299/18723 | 1.27e-05 | 2.60e-04 | 63 |
| GO:00448434 | Cervix | CC | cell cycle G1/S phase transition | 53/2311 | 241/18723 | 1.76e-05 | 3.32e-04 | 53 |
| GO:00714798 | Cervix | CC | cellular response to ionizing radiation | 22/2311 | 72/18723 | 3.47e-05 | 5.60e-04 | 22 |
| GO:00093149 | Cervix | CC | response to radiation | 86/2311 | 456/18723 | 3.50e-05 | 5.63e-04 | 86 |
| GO:00063257 | Cervix | CC | chromatin organization | 78/2311 | 409/18723 | 5.40e-05 | 8.02e-04 | 78 |
| GO:00900685 | Cervix | CC | positive regulation of cell cycle process | 50/2311 | 236/18723 | 8.25e-05 | 1.11e-03 | 50 |
| GO:19019873 | Cervix | CC | regulation of cell cycle phase transition | 74/2311 | 390/18723 | 9.80e-05 | 1.27e-03 | 74 |
| GO:00459277 | Cervix | CC | positive regulation of growth | 53/2311 | 259/18723 | 1.33e-04 | 1.64e-03 | 53 |
| GO:00015588 | Cervix | CC | regulation of cell growth | 77/2311 | 414/18723 | 1.40e-04 | 1.70e-03 | 77 |
| Hugo Symbol | Variant Class | Variant Classification | dbSNP RS | HGVSc | HGVSp | HGVSp Short | SWISSPROT | BIOTYPE | SIFT | PolyPhen | Tumor Sample Barcode | Tissue | Histology | Sex | Age | Stage | Therapy Types | Drugs | Outcome |
| INO80 | SNV | Missense_Mutation | rs747579178 | c.781C>A | p.Pro261Thr | p.P261T | Q9ULG1 | protein_coding | tolerated(0.24) | probably_damaging(0.994) | TCGA-A7-A0DB-01 | Breast | breast invasive carcinoma | Female | <65 | I/II | Hormone Therapy | arimidex | SD |
| INO80 | SNV | Missense_Mutation | novel | c.1400G>T | p.Arg467Met | p.R467M | Q9ULG1 | protein_coding | deleterious(0) | probably_damaging(0.984) | TCGA-A8-A09Z-01 | Breast | breast invasive carcinoma | Female | >=65 | I/II | Unknown | Unknown | SD |
| INO80 | SNV | Missense_Mutation | | c.4322C>A | p.Ala1441Asp | p.A1441D | Q9ULG1 | protein_coding | tolerated(0.22) | benign(0.025) | TCGA-AC-A23H-01 | Breast | breast invasive carcinoma | Female | >=65 | I/II | Unknown | Unknown | PD |
| INO80 | SNV | Missense_Mutation | | c.4322N>T | p.Ala1441Val | p.A1441V | Q9ULG1 | protein_coding | tolerated(0.24) | benign(0) | TCGA-AN-A0XS-01 | Breast | breast invasive carcinoma | Female | <65 | III/IV | Unknown | Unknown | SD |
| INO80 | SNV | Missense_Mutation | novel | c.3023N>G | p.Ser1008Cys | p.S1008C | Q9ULG1 | protein_coding | tolerated(0.07) | benign(0.174) | TCGA-BH-A0B6-01 | Breast | breast invasive carcinoma | Female | <65 | I/II | Unknown | Unknown | SD |
| INO80 | SNV | Missense_Mutation | | c.241N>T | p.Leu81Phe | p.L81F | Q9ULG1 | protein_coding | tolerated(0.16) | possibly_damaging(0.676) | TCGA-BH-A1FL-01 | Breast | breast invasive carcinoma | Female | >=65 | I/II | Unknown | Unknown | PD |
| INO80 | SNV | Missense_Mutation | rs780868252 | c.934C>T | p.His312Tyr | p.H312Y | Q9ULG1 | protein_coding | tolerated(0.85) | benign(0.303) | TCGA-D8-A1XB-01 | Breast | breast invasive carcinoma | Female | <65 | I/II | Unknown | Unknown | SD |
| INO80 | SNV | Missense_Mutation | | c.532A>G | p.Lys178Glu | p.K178E | Q9ULG1 | protein_coding | tolerated(0.52) | benign(0.074) | TCGA-D8-A1XQ-01 | Breast | breast invasive carcinoma | Female | >=65 | I/II | Unknown | Unknown | SD |
| INO80 | SNV | Missense_Mutation | novel | c.287N>T | p.Tyr96Phe | p.Y96F | Q9ULG1 | protein_coding | tolerated(0.61) | benign(0.031) | TCGA-LL-A73Z-01 | Breast | breast invasive carcinoma | Female | <65 | III/IV | Chemotherapy | adriamycin | PD |
| INO80 | insertion | Frame_Shift_Ins | novel | c.2093_2094insGATTTTGAAGCCATTTATGCTGAGGAGAA | p.Ile698MetfsTer50 | p.I698Mfs*50 | Q9ULG1 | protein_coding | | | TCGA-B6-A0I8-01 | Breast | breast invasive carcinoma | Female | <65 | I/II | Unknown | Unknown | PD |


