
|
|||||
|
 | |
| |
| |
| |
| |
| |
|
Gene: INHBB |
Gene summary for INHBB |
| Gene information | Species | Human | Gene symbol | INHBB | Gene ID | 3625 |
| Gene name | inhibin subunit beta B | |
| Gene Alias | INHBB | |
| Cytomap | 2q14.2 | |
| Gene Type | protein-coding | GO ID | GO:0000003 | UniProtAcc | P09529 |
Top |
Malignant transformation analysis |
| Identification of the aberrant gene expression in precancerous and cancerous lesions by comparing the gene expression of stem-like cells in diseased tissues with normal stem cells |
| Entrez ID | Symbol | Replicates | Species | Organ | Tissue | Adj P-value | Log2FC | Malignancy |
| 3625 | INHBB | LZE4T | Human | Esophagus | ESCC | 3.06e-09 | 1.39e-01 | 0.0811 |
| 3625 | INHBB | P2T-E | Human | Esophagus | ESCC | 5.47e-33 | 6.38e-01 | 0.1177 |
| 3625 | INHBB | P4T-E | Human | Esophagus | ESCC | 1.83e-14 | 5.46e-01 | 0.1323 |
| 3625 | INHBB | P5T-E | Human | Esophagus | ESCC | 4.13e-04 | 1.28e-01 | 0.1327 |
| 3625 | INHBB | P8T-E | Human | Esophagus | ESCC | 3.57e-30 | 4.78e-01 | 0.0889 |
| 3625 | INHBB | P10T-E | Human | Esophagus | ESCC | 5.85e-09 | 2.52e-01 | 0.116 |
| 3625 | INHBB | P12T-E | Human | Esophagus | ESCC | 2.47e-08 | 3.17e-01 | 0.1122 |
| 3625 | INHBB | P15T-E | Human | Esophagus | ESCC | 3.04e-03 | 5.16e-02 | 0.1149 |
| 3625 | INHBB | P16T-E | Human | Esophagus | ESCC | 4.47e-09 | 3.26e-01 | 0.1153 |
| 3625 | INHBB | P20T-E | Human | Esophagus | ESCC | 2.78e-10 | 2.66e-01 | 0.1124 |
| 3625 | INHBB | P21T-E | Human | Esophagus | ESCC | 2.20e-03 | 1.08e-01 | 0.1617 |
| 3625 | INHBB | P22T-E | Human | Esophagus | ESCC | 9.36e-44 | 8.61e-01 | 0.1236 |
| 3625 | INHBB | P24T-E | Human | Esophagus | ESCC | 2.43e-06 | 1.92e-01 | 0.1287 |
| 3625 | INHBB | P26T-E | Human | Esophagus | ESCC | 8.72e-03 | 8.30e-02 | 0.1276 |
| 3625 | INHBB | P28T-E | Human | Esophagus | ESCC | 3.35e-16 | 3.34e-01 | 0.1149 |
| 3625 | INHBB | P30T-E | Human | Esophagus | ESCC | 2.55e-11 | 8.17e-01 | 0.137 |
| 3625 | INHBB | P31T-E | Human | Esophagus | ESCC | 9.91e-45 | 8.15e-01 | 0.1251 |
| 3625 | INHBB | P32T-E | Human | Esophagus | ESCC | 4.09e-02 | 8.90e-02 | 0.1666 |
| 3625 | INHBB | P44T-E | Human | Esophagus | ESCC | 7.18e-03 | 1.87e-01 | 0.1096 |
| 3625 | INHBB | P52T-E | Human | Esophagus | ESCC | 7.03e-10 | 3.10e-01 | 0.1555 |
| Page: 1 2 3 |
| Tissue | Expression Dynamics | Abbreviation |
| Esophagus |  | ESCC: Esophageal squamous cell carcinoma |
| HGIN: High-grade intraepithelial neoplasias | ||
| LGIN: Low-grade intraepithelial neoplasias | ||
| Liver | 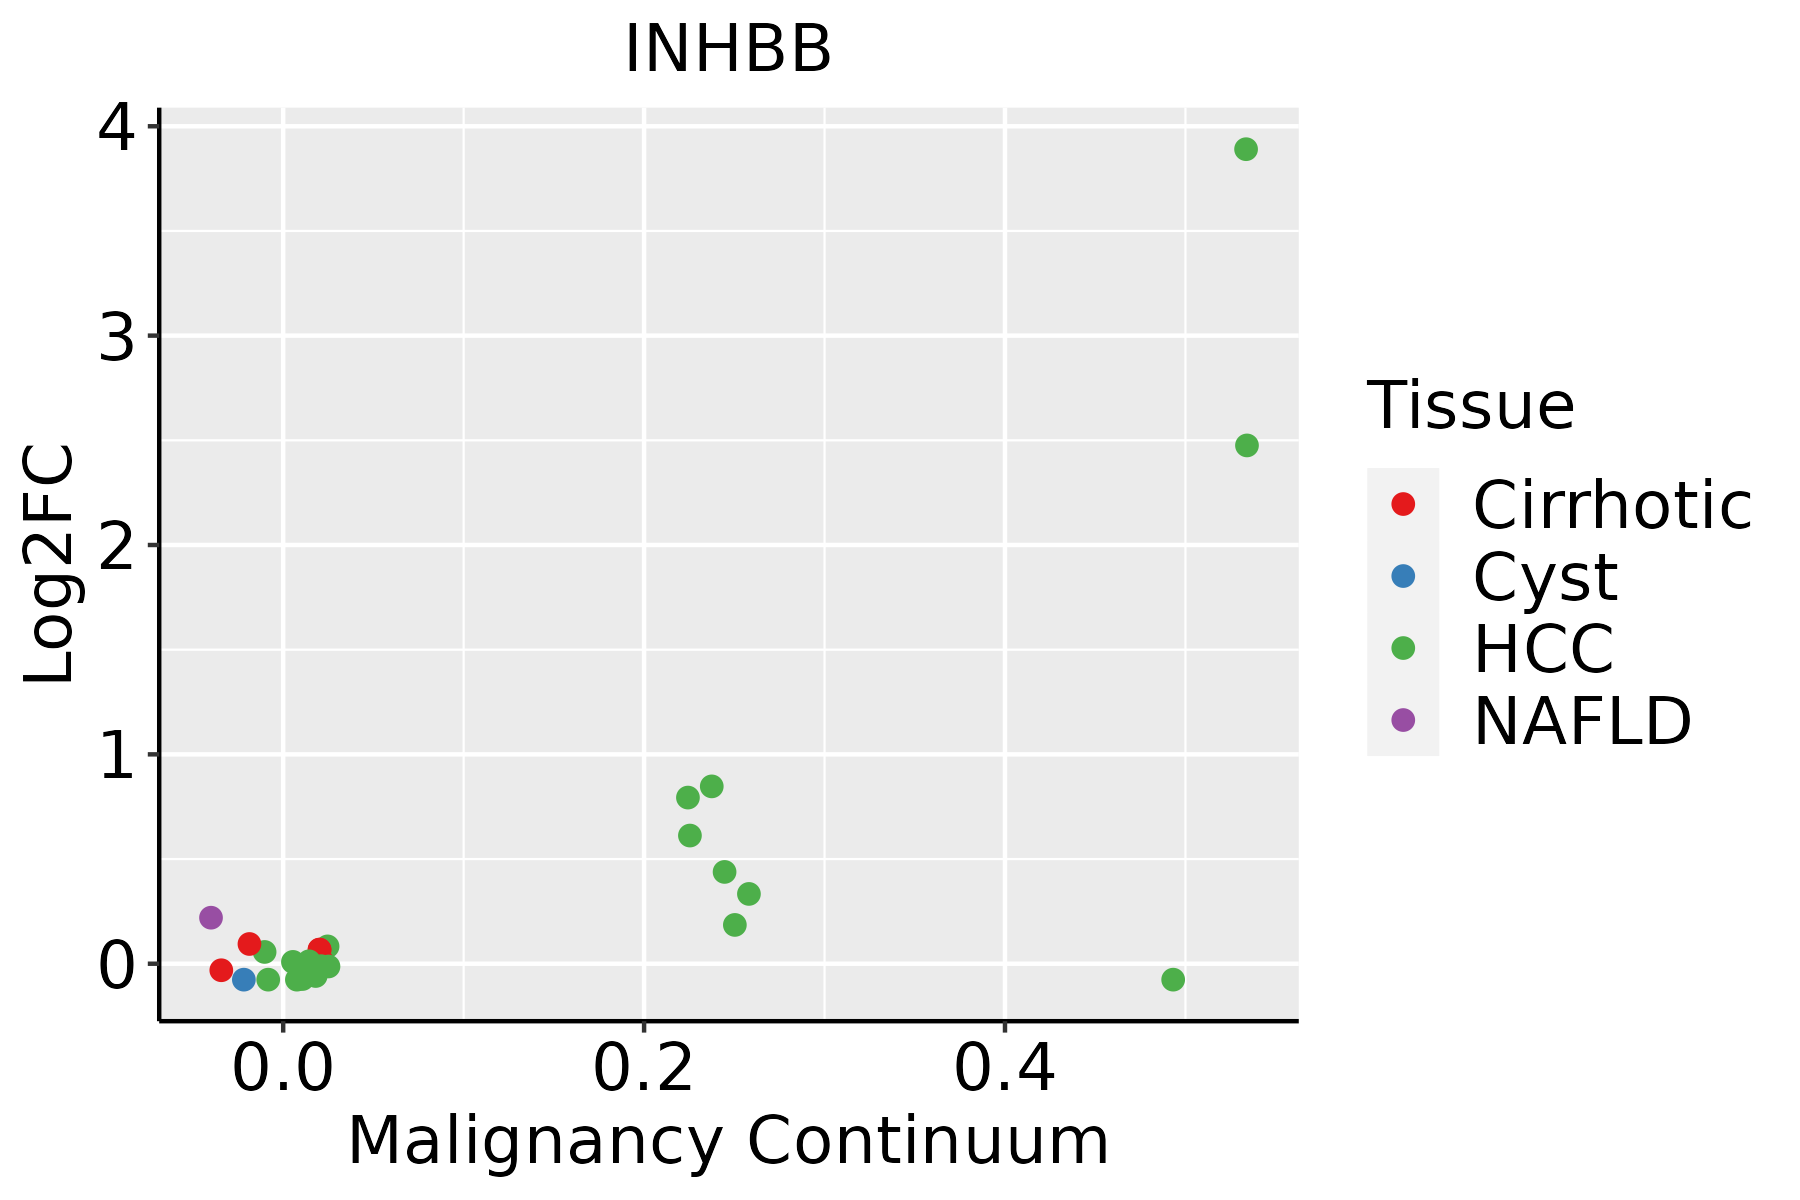 | HCC: Hepatocellular carcinoma |
| NAFLD: Non-alcoholic fatty liver disease | ||
| Thyroid | 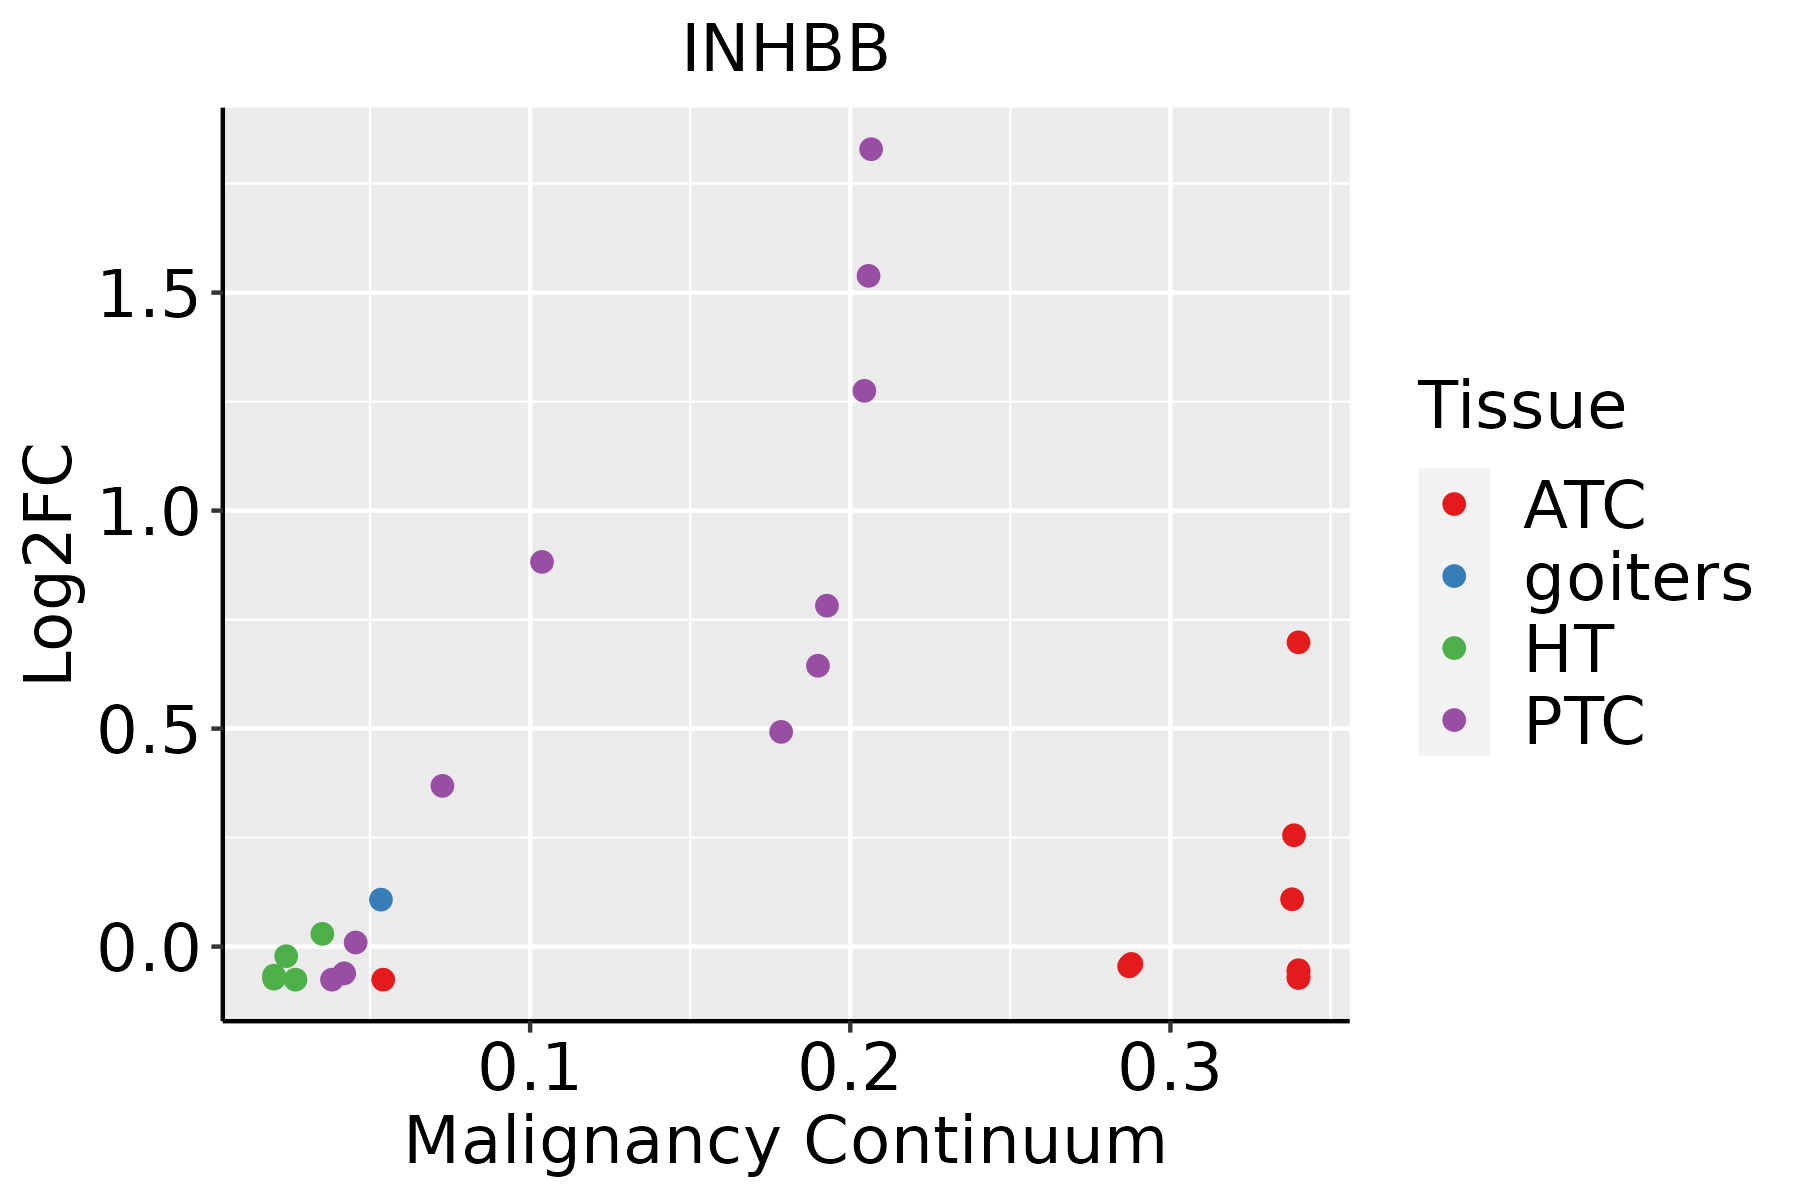 | ATC: Anaplastic thyroid cancer |
| HT: Hashimoto's thyroiditis | ||
| PTC: Papillary thyroid cancer |
| ∗log2FC in expression of this searched gene in stem-like cells from each diseased tissue sample relative to stem-like cells in normal samples in each tissue plotted against the malignancy continuum. Samples are colored based on if they are from different disease stage. |
Top |
Malignant transformation related pathway analysis |
| Find out the enriched GO biological processes and KEGG pathways involved in transition from healthy to precancer to cancer |
| Tissue | Disease Stage | Enriched GO biological Processes |
| Colorectum | AD |  |
| Colorectum | SER |  |
| Colorectum | MSS |  |
| Colorectum | MSI-H |  |
| Colorectum | FAP |  |
| ∗Top 15 enriched GO BP terms are showed in the bar plot of each disease state in each tissue. Each row represents a significant GO biological process which is colored according to the -log10(p.adjust). |
| Page: 1 2 3 4 5 6 7 8 9 |
| GO ID | Tissue | Disease Stage | Description | Gene Ratio | Bg Ratio | pvalue | p.adjust | Count |
| GO:2001233111 | Esophagus | ESCC | regulation of apoptotic signaling pathway | 256/8552 | 356/18723 | 4.11e-24 | 1.04e-21 | 256 |
| GO:0071496111 | Esophagus | ESCC | cellular response to external stimulus | 215/8552 | 320/18723 | 4.29e-15 | 2.43e-13 | 215 |
| GO:0031668111 | Esophagus | ESCC | cellular response to extracellular stimulus | 168/8552 | 246/18723 | 4.93e-13 | 2.23e-11 | 168 |
| GO:0031669110 | Esophagus | ESCC | cellular response to nutrient levels | 148/8552 | 215/18723 | 4.58e-12 | 1.76e-10 | 148 |
| GO:0031667111 | Esophagus | ESCC | response to nutrient levels | 289/8552 | 474/18723 | 9.25e-12 | 3.47e-10 | 289 |
| GO:0044403111 | Esophagus | ESCC | biological process involved in symbiotic interaction | 186/8552 | 290/18723 | 1.43e-10 | 4.16e-09 | 186 |
| GO:0009267110 | Esophagus | ESCC | cellular response to starvation | 110/8552 | 156/18723 | 2.63e-10 | 7.37e-09 | 110 |
| GO:2001235110 | Esophagus | ESCC | positive regulation of apoptotic signaling pathway | 92/8552 | 126/18723 | 3.91e-10 | 1.05e-08 | 92 |
| GO:004259419 | Esophagus | ESCC | response to starvation | 133/8552 | 197/18723 | 4.31e-10 | 1.14e-08 | 133 |
| GO:0061458110 | Esophagus | ESCC | reproductive system development | 247/8552 | 427/18723 | 2.24e-07 | 3.42e-06 | 247 |
| GO:004860818 | Esophagus | ESCC | reproductive structure development | 245/8552 | 424/18723 | 2.82e-07 | 4.14e-06 | 245 |
| GO:190165319 | Esophagus | ESCC | cellular response to peptide | 208/8552 | 359/18723 | 1.68e-06 | 2.01e-05 | 208 |
| GO:0043434111 | Esophagus | ESCC | response to peptide hormone | 234/8552 | 414/18723 | 4.93e-06 | 5.21e-05 | 234 |
| GO:003286918 | Esophagus | ESCC | cellular response to insulin stimulus | 124/8552 | 203/18723 | 6.63e-06 | 6.75e-05 | 124 |
| GO:003286818 | Esophagus | ESCC | response to insulin | 156/8552 | 264/18723 | 7.21e-06 | 7.20e-05 | 156 |
| GO:00454449 | Esophagus | ESCC | fat cell differentiation | 135/8552 | 229/18723 | 3.38e-05 | 2.78e-04 | 135 |
| GO:007137516 | Esophagus | ESCC | cellular response to peptide hormone stimulus | 166/8552 | 290/18723 | 4.48e-05 | 3.55e-04 | 166 |
| GO:000717810 | Esophagus | ESCC | transmembrane receptor protein serine/threonine kinase signaling pathway | 195/8552 | 355/18723 | 2.58e-04 | 1.58e-03 | 195 |
| GO:00512244 | Esophagus | ESCC | negative regulation of protein transport | 74/8552 | 127/18723 | 2.86e-03 | 1.21e-02 | 74 |
| GO:19049505 | Esophagus | ESCC | negative regulation of establishment of protein localization | 76/8552 | 131/18723 | 2.96e-03 | 1.24e-02 | 76 |
| Page: 1 2 3 4 |
| Pathway ID | Tissue | Disease Stage | Description | Gene Ratio | Bg Ratio | pvalue | p.adjust | qvalue | Count |
| hsa043507 | Esophagus | ESCC | TGF-beta signaling pathway | 69/4205 | 108/8465 | 1.92e-03 | 5.54e-03 | 2.84e-03 | 69 |
| hsa0435014 | Esophagus | ESCC | TGF-beta signaling pathway | 69/4205 | 108/8465 | 1.92e-03 | 5.54e-03 | 2.84e-03 | 69 |
| Page: 1 |
Top |
Cell-cell communication analysis |
| Identification of potential cell-cell interactions between two cell types and their ligand-receptor pairs for different disease states |
| Ligand | Receptor | LRpair | Pathway | Tissue | Disease Stage |
| INHBB | ACVR1B_ACVR2A | INHBB_ACVR1B_ACVR2A | ACTIVIN | Cervix | CC |
| INHBB | ACVR1B_ACVR2A | INHBB_ACVR1B_ACVR2A | ACTIVIN | CRC | MSI-H |
| INHBB | ACVR1B_ACVR2B | INHBB_ACVR1B_ACVR2B | ACTIVIN | CRC | MSI-H |
| INHBB | ACVR1B_ACVR2A | INHBB_ACVR1B_ACVR2A | ACTIVIN | THCA | Cancer |
| Page: 1 |
Top |
Single-cell gene regulatory network inference analysis |
| Find out the significant the regulons (TFs) and the target genes of each regulon across cell types for different disease states |
| TF | Cell Type | Tissue | Disease Stage | Target Gene | RSS | Regulon Activity |
| ∗The dot plots of a searched regulon are shown for all cell subpopulations in each disease state of each tissue based on the regulon specific score inferred using pySCENIC and by calculating the average expression. |
| Page: 1 |
Top |
Somatic mutation of malignant transformation related genes |
| Annotation of somatic variants for genes involved in malignant transformation |
| Hugo Symbol | Variant Class | Variant Classification | dbSNP RS | HGVSc | HGVSp | HGVSp Short | SWISSPROT | BIOTYPE | SIFT | PolyPhen | Tumor Sample Barcode | Tissue | Histology | Sex | Age | Stage | Therapy Types | Drugs | Outcome |
| INHBB | SNV | Missense_Mutation | rs148176831 | c.769N>A | p.Glu257Lys | p.E257K | P09529 | protein_coding | deleterious(0.05) | benign(0.139) | TCGA-D8-A1J9-01 | Breast | breast invasive carcinoma | Female | <65 | I/II | Unknown | Unknown | SD |
| INHBB | SNV | Missense_Mutation | c.983A>G | p.Tyr328Cys | p.Y328C | P09529 | protein_coding | deleterious(0) | probably_damaging(0.926) | TCGA-R2-A69V-01 | Cervix | cervical & endocervical cancer | Female | <65 | I/II | Chemotherapy | cisplatin | SD | |
| INHBB | SNV | Missense_Mutation | rs201621303 | c.854G>A | p.Ser285Asn | p.S285N | P09529 | protein_coding | tolerated(0.55) | benign(0.001) | TCGA-AA-3663-01 | Colorectum | colon adenocarcinoma | Male | <65 | I/II | Unknown | Unknown | SD |
| INHBB | SNV | Missense_Mutation | rs779417932 | c.467G>A | p.Arg156Gln | p.R156Q | P09529 | protein_coding | tolerated(0.41) | benign(0.066) | TCGA-AA-3864-01 | Colorectum | colon adenocarcinoma | Male | >=65 | I/II | Unknown | Unknown | SD |
| INHBB | SNV | Missense_Mutation | c.812N>T | p.Ser271Leu | p.S271L | P09529 | protein_coding | deleterious(0) | probably_damaging(0.971) | TCGA-DM-A0X9-01 | Colorectum | colon adenocarcinoma | Female | >=65 | I/II | Unknown | Unknown | SD | |
| INHBB | SNV | Missense_Mutation | rs371205927 | c.1076G>A | p.Arg359His | p.R359H | P09529 | protein_coding | deleterious(0) | probably_damaging(0.998) | TCGA-A5-A0R8-01 | Endometrium | uterine corpus endometrioid carcinoma | Female | >=65 | I/II | Unknown | Unknown | PD |
| INHBB | SNV | Missense_Mutation | novel | c.784N>T | p.Pro262Ser | p.P262S | P09529 | protein_coding | tolerated(0.15) | probably_damaging(0.997) | TCGA-AJ-A3EK-01 | Endometrium | uterine corpus endometrioid carcinoma | Female | <65 | I/II | Chemotherapy | carboplatin | CR |
| INHBB | SNV | Missense_Mutation | rs144228850 | c.841N>T | p.Arg281Trp | p.R281W | P09529 | protein_coding | deleterious(0) | probably_damaging(0.929) | TCGA-AJ-A3NE-01 | Endometrium | uterine corpus endometrioid carcinoma | Female | <65 | I/II | Unknown | Unknown | SD |
| INHBB | SNV | Missense_Mutation | rs780625208 | c.667N>T | p.Arg223Cys | p.R223C | P09529 | protein_coding | deleterious(0) | probably_damaging(0.995) | TCGA-AJ-A5DW-01 | Endometrium | uterine corpus endometrioid carcinoma | Female | <65 | I/II | Unknown | Unknown | SD |
| INHBB | SNV | Missense_Mutation | rs770683310 | c.695C>T | p.Thr232Met | p.T232M | P09529 | protein_coding | deleterious(0) | probably_damaging(0.941) | TCGA-AX-A2HD-01 | Endometrium | uterine corpus endometrioid carcinoma | Female | >=65 | III/IV | Unknown | Unknown | SD |
| Page: 1 2 3 4 |
Top |
Related drugs of malignant transformation related genes |
| Identification of chemicals and drugs interact with genes involved in malignant transfromation |
| (DGIdb 4.0) |
| Entrez ID | Symbol | Category | Interaction Types | Drug Claim Name | Drug Name | PMIDs |
| Page: 1 |

Copyright 2023-Present -The University of Texas Health Science Center at Houston |