
|
|||||
|
 | |
| |
| |
| |
| |
| |
|
Gene: INHBA |
Gene summary for INHBA |
| Gene information | Species | Human | Gene symbol | INHBA | Gene ID | 3624 |
| Gene name | inhibin subunit beta A | |
| Gene Alias | EDF | |
| Cytomap | 7p14.1 | |
| Gene Type | protein-coding | GO ID | GO:0000003 | UniProtAcc | A4D1W7 |
Top |
Malignant transformation analysis |
| Identification of the aberrant gene expression in precancerous and cancerous lesions by comparing the gene expression of stem-like cells in diseased tissues with normal stem cells |
| Entrez ID | Symbol | Replicates | Species | Organ | Tissue | Adj P-value | Log2FC | Malignancy |
| 3624 | INHBA | P10T-E | Human | Esophagus | ESCC | 3.34e-06 | 3.23e-01 | 0.116 |
| 3624 | INHBA | P11T-E | Human | Esophagus | ESCC | 4.27e-17 | 2.53e+00 | 0.1426 |
| 3624 | INHBA | P17T-E | Human | Esophagus | ESCC | 5.02e-11 | 1.37e+00 | 0.1278 |
| 3624 | INHBA | P20T-E | Human | Esophagus | ESCC | 2.99e-07 | 9.53e-01 | 0.1124 |
| 3624 | INHBA | P21T-E | Human | Esophagus | ESCC | 1.07e-28 | 1.88e+00 | 0.1617 |
| 3624 | INHBA | P31T-E | Human | Esophagus | ESCC | 6.12e-20 | 1.18e+00 | 0.1251 |
| 3624 | INHBA | P32T-E | Human | Esophagus | ESCC | 2.39e-28 | 1.50e+00 | 0.1666 |
| 3624 | INHBA | P37T-E | Human | Esophagus | ESCC | 1.28e-62 | 2.82e+00 | 0.1371 |
| 3624 | INHBA | P40T-E | Human | Esophagus | ESCC | 1.28e-06 | 1.15e+00 | 0.109 |
| 3624 | INHBA | P42T-E | Human | Esophagus | ESCC | 1.81e-13 | 1.55e+00 | 0.1175 |
| 3624 | INHBA | P44T-E | Human | Esophagus | ESCC | 2.07e-05 | 9.28e-01 | 0.1096 |
| 3624 | INHBA | P47T-E | Human | Esophagus | ESCC | 4.51e-06 | 8.57e-01 | 0.1067 |
| 3624 | INHBA | P49T-E | Human | Esophagus | ESCC | 5.23e-12 | 2.97e+00 | 0.1768 |
| 3624 | INHBA | P52T-E | Human | Esophagus | ESCC | 2.65e-26 | 1.61e+00 | 0.1555 |
| 3624 | INHBA | P62T-E | Human | Esophagus | ESCC | 6.02e-05 | 8.65e-01 | 0.1302 |
| 3624 | INHBA | P76T-E | Human | Esophagus | ESCC | 2.75e-22 | 1.82e+00 | 0.1207 |
| 3624 | INHBA | P83T-E | Human | Esophagus | ESCC | 8.29e-23 | 2.90e+00 | 0.1738 |
| 3624 | INHBA | P89T-E | Human | Esophagus | ESCC | 2.74e-24 | 3.92e+00 | 0.1752 |
| 3624 | INHBA | P91T-E | Human | Esophagus | ESCC | 1.32e-16 | 2.84e+00 | 0.1828 |
| 3624 | INHBA | P107T-E | Human | Esophagus | ESCC | 6.88e-19 | 2.41e+00 | 0.171 |
| Page: 1 2 3 |
| Tissue | Expression Dynamics | Abbreviation |
| Esophagus | 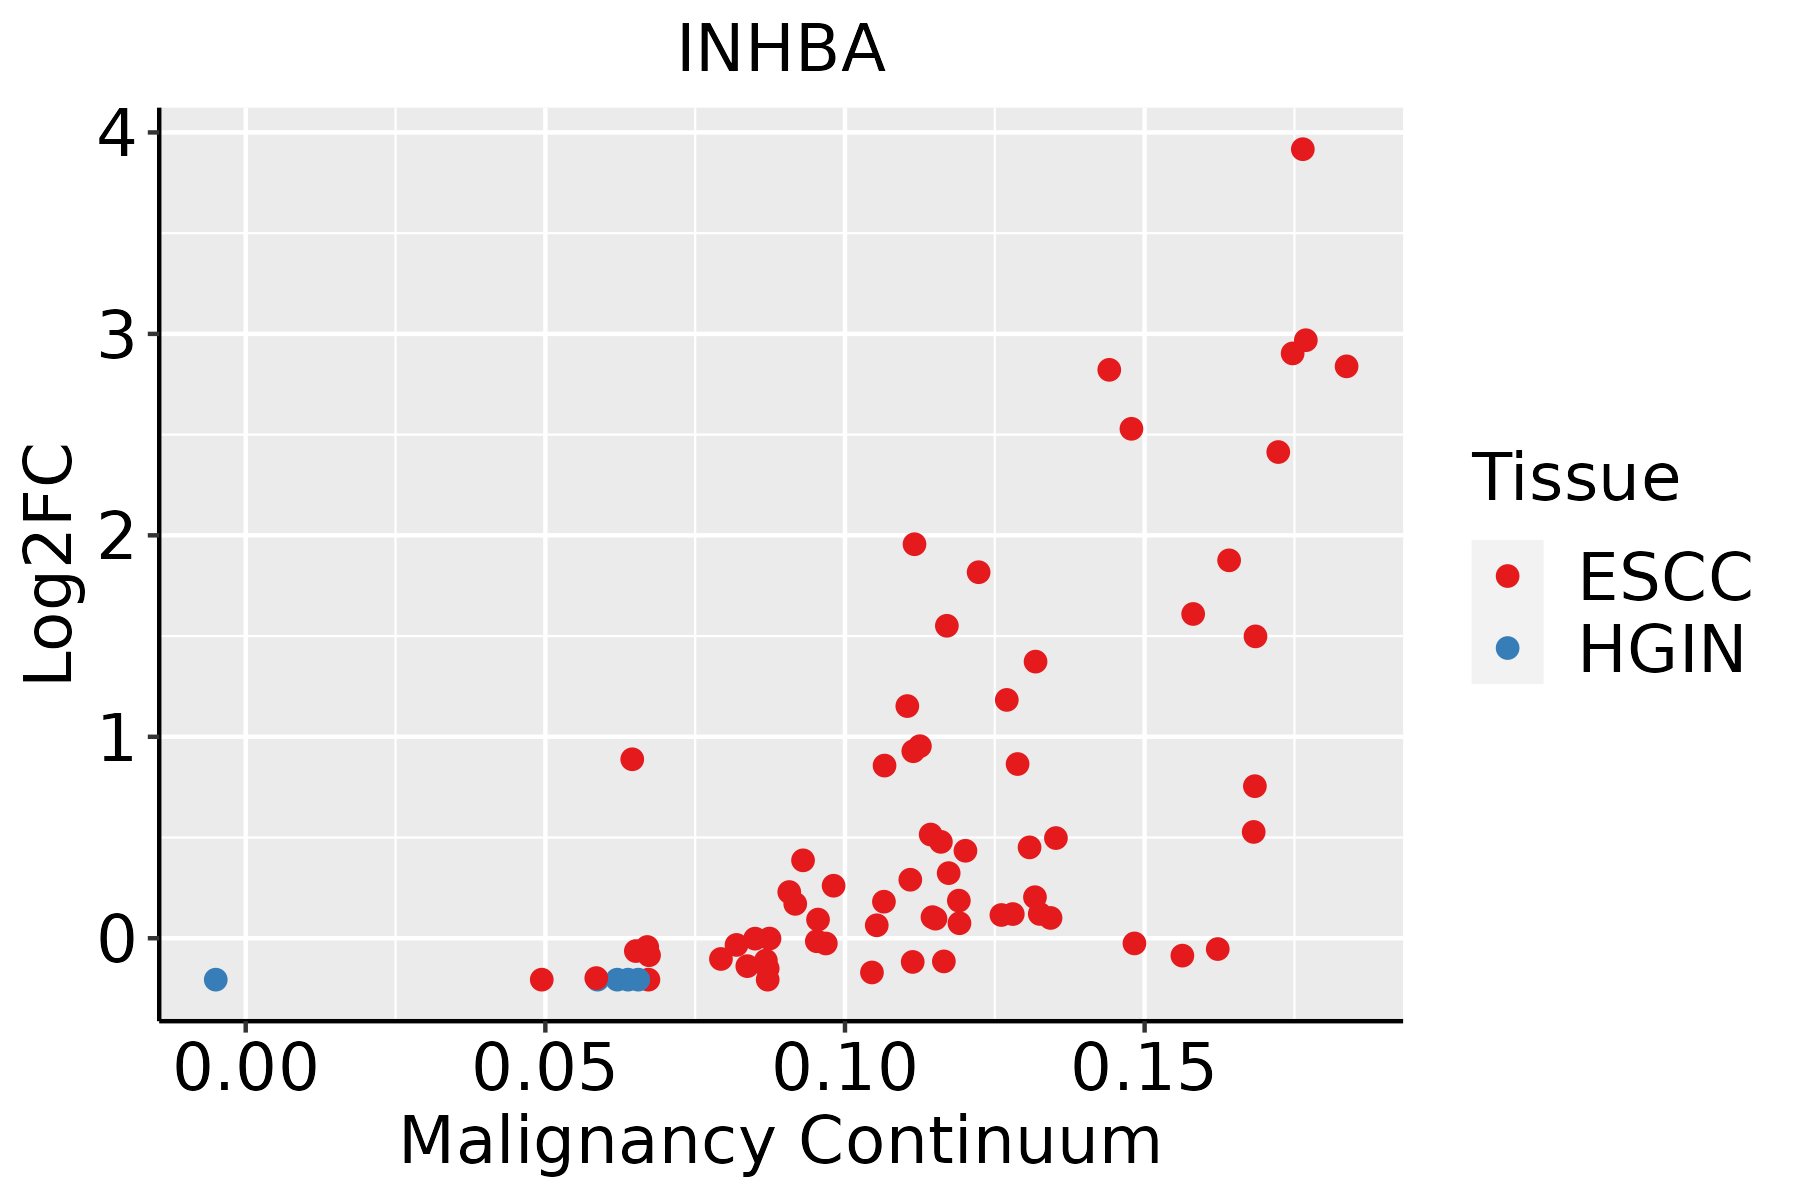 | ESCC: Esophageal squamous cell carcinoma |
| HGIN: High-grade intraepithelial neoplasias | ||
| LGIN: Low-grade intraepithelial neoplasias | ||
| Oral Cavity | 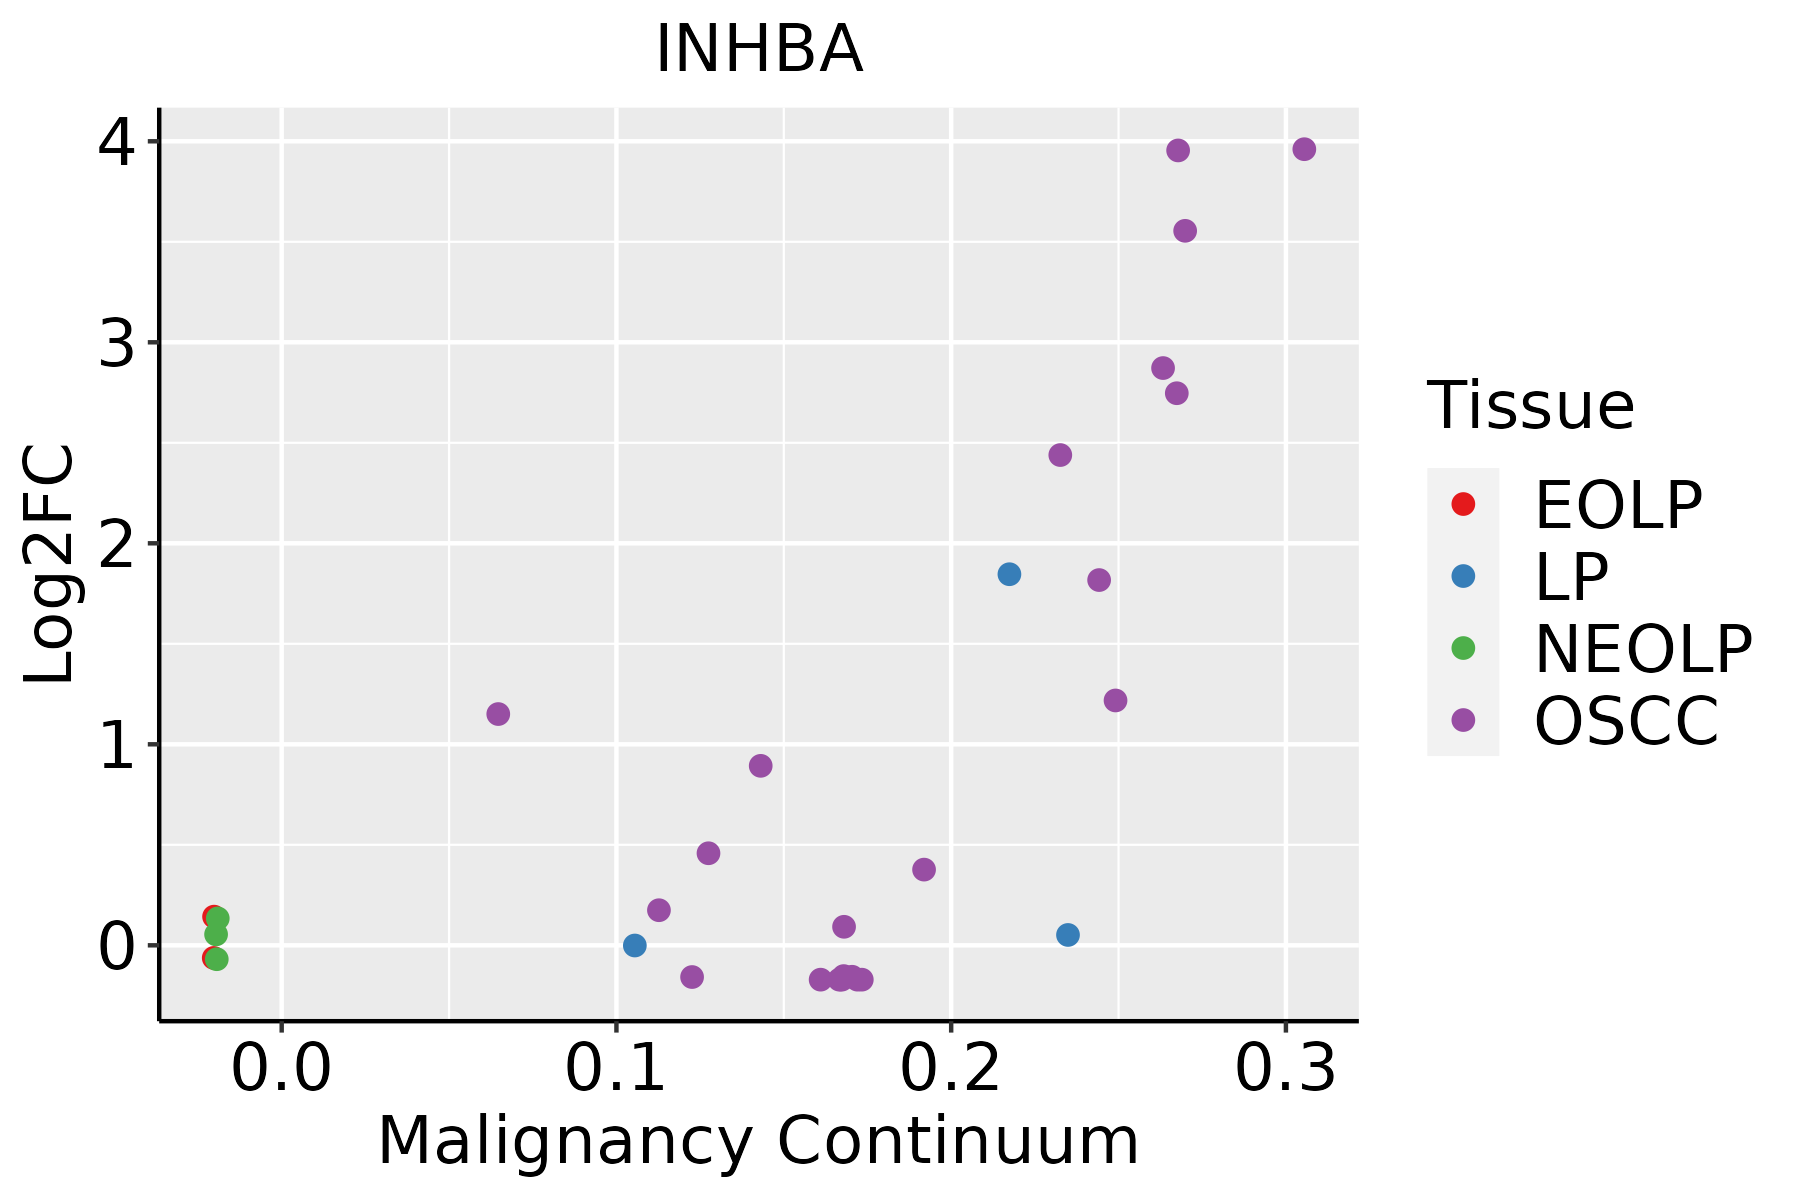 | EOLP: Erosive Oral lichen planus |
| LP: leukoplakia | ||
| NEOLP: Non-erosive oral lichen planus | ||
| OSCC: Oral squamous cell carcinoma | ||
| Skin | 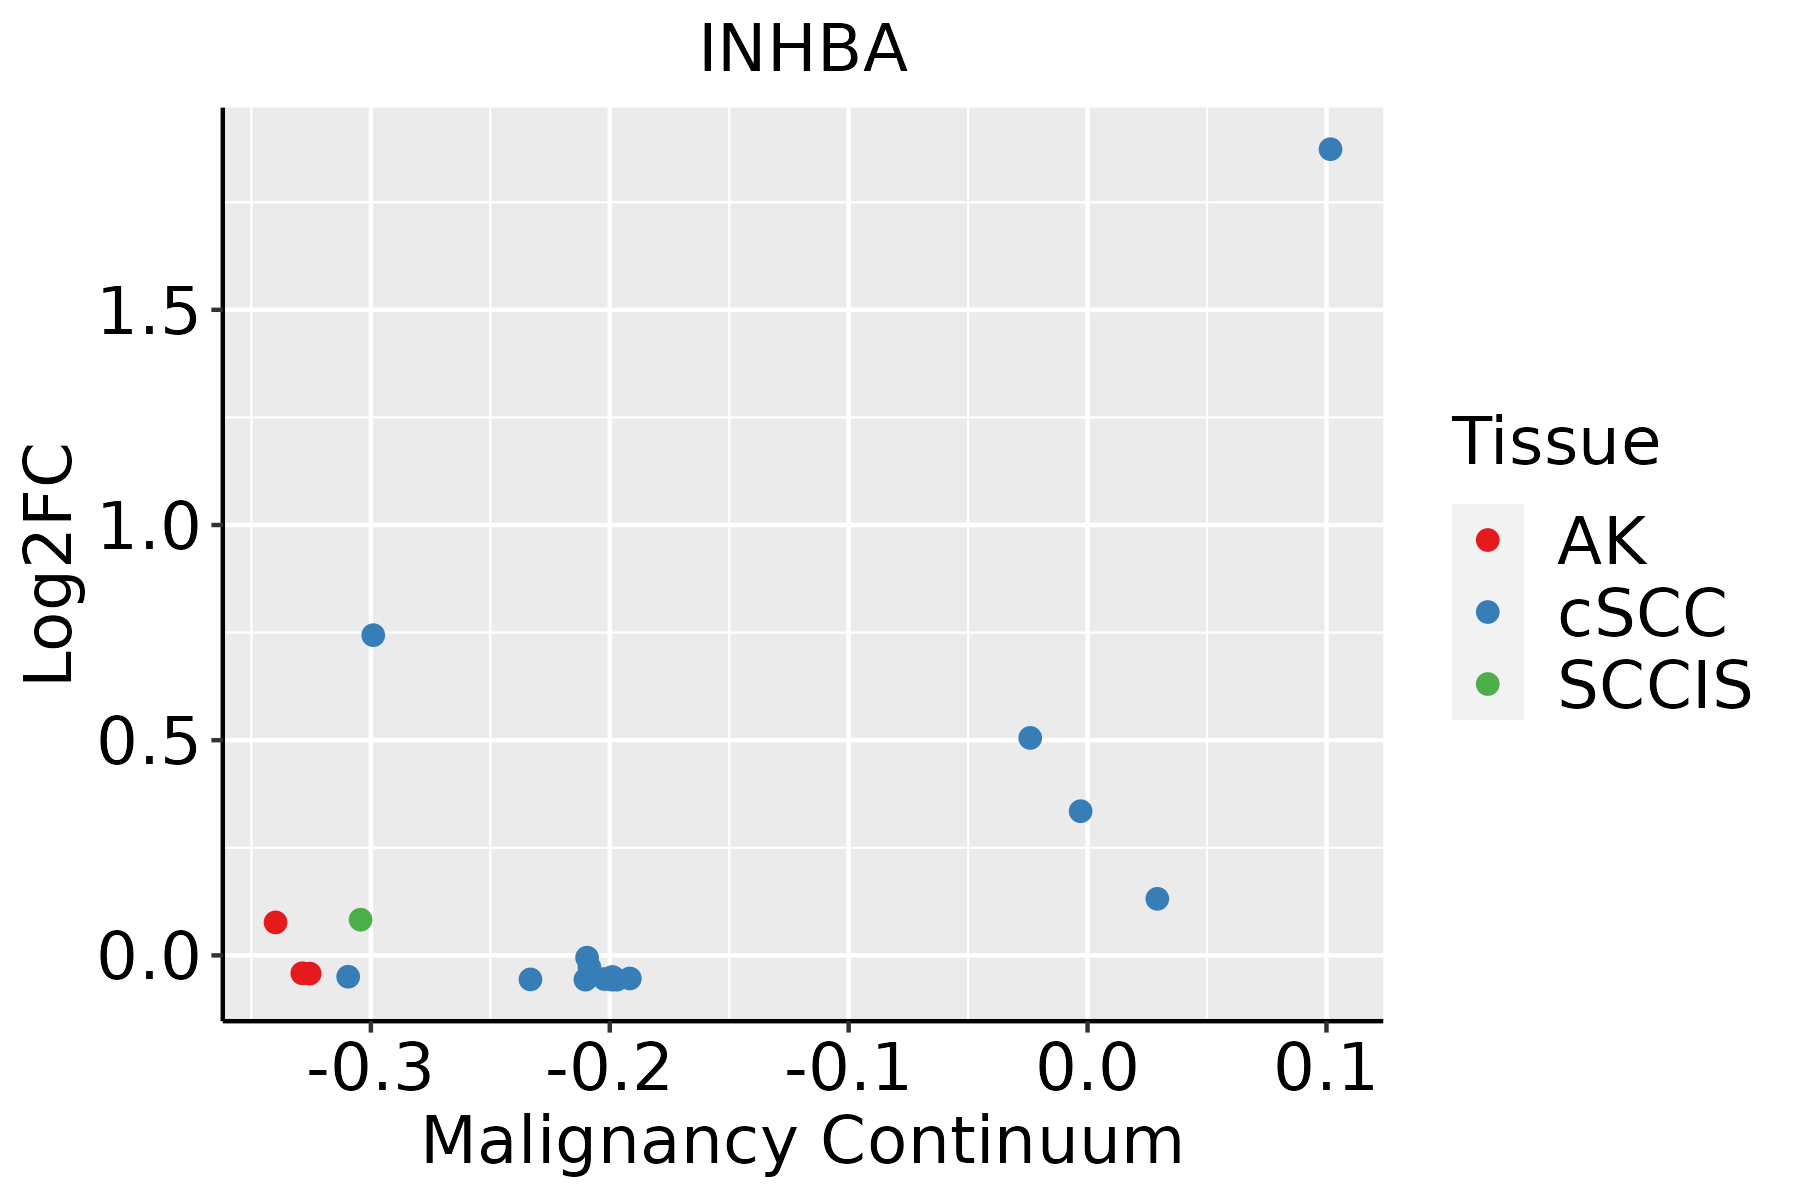 | AK: Actinic keratosis |
| cSCC: Cutaneous squamous cell carcinoma | ||
| SCCIS:squamous cell carcinoma in situ | ||
| Thyroid | 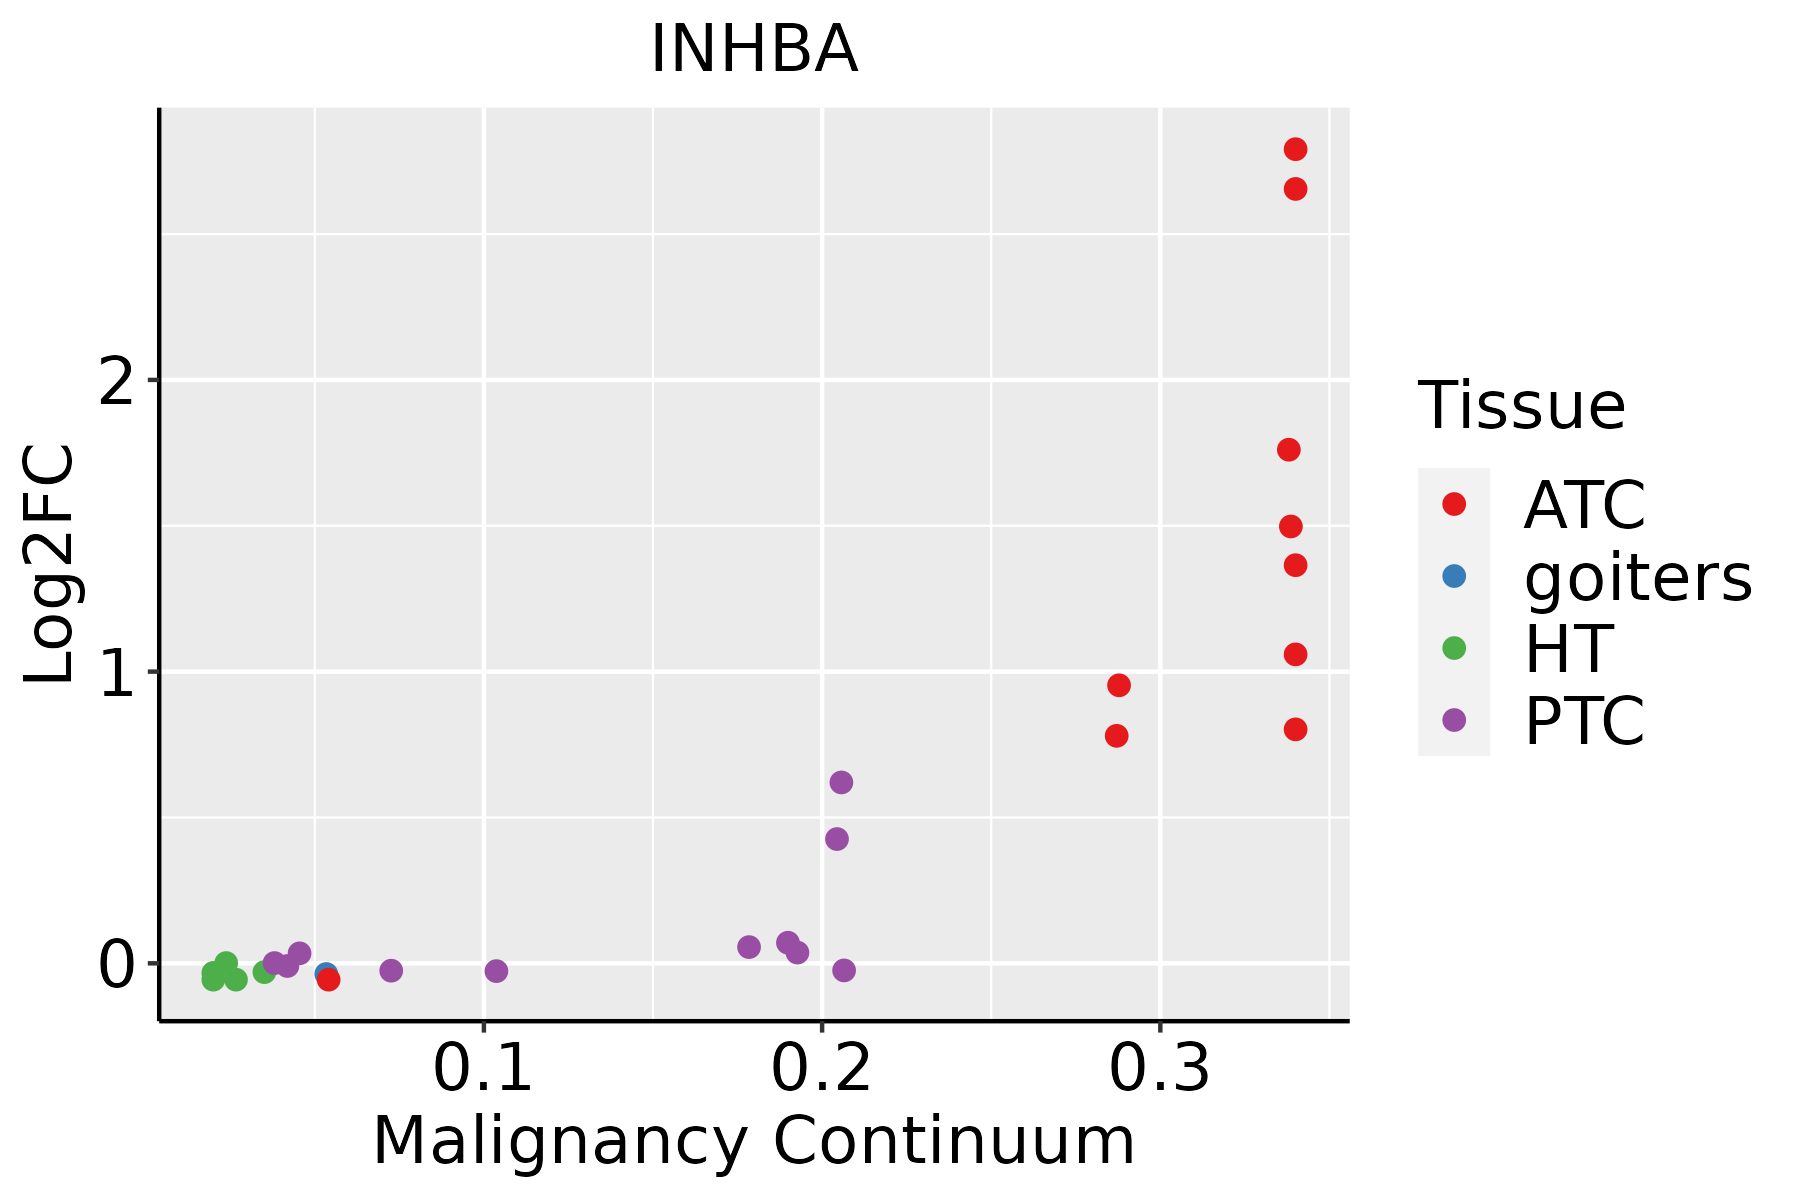 | ATC: Anaplastic thyroid cancer |
| HT: Hashimoto's thyroiditis | ||
| PTC: Papillary thyroid cancer |
| ∗log2FC in expression of this searched gene in stem-like cells from each diseased tissue sample relative to stem-like cells in normal samples in each tissue plotted against the malignancy continuum. Samples are colored based on if they are from different disease stage. |
Top |
Malignant transformation related pathway analysis |
| Find out the enriched GO biological processes and KEGG pathways involved in transition from healthy to precancer to cancer |
| Tissue | Disease Stage | Enriched GO biological Processes |
| Colorectum | AD |  |
| Colorectum | SER |  |
| Colorectum | MSS |  |
| Colorectum | MSI-H |  |
| Colorectum | FAP |  |
| ∗Top 15 enriched GO BP terms are showed in the bar plot of each disease state in each tissue. Each row represents a significant GO biological process which is colored according to the -log10(p.adjust). |
| Page: 1 2 3 4 5 6 7 8 9 |
| GO ID | Tissue | Disease Stage | Description | Gene Ratio | Bg Ratio | pvalue | p.adjust | Count |
| GO:2001233111 | Esophagus | ESCC | regulation of apoptotic signaling pathway | 256/8552 | 356/18723 | 4.11e-24 | 1.04e-21 | 256 |
| GO:004477216 | Esophagus | ESCC | mitotic cell cycle phase transition | 281/8552 | 424/18723 | 4.63e-18 | 4.45e-16 | 281 |
| GO:0097191111 | Esophagus | ESCC | extrinsic apoptotic signaling pathway | 159/8552 | 219/18723 | 4.12e-16 | 2.94e-14 | 159 |
| GO:0010563111 | Esophagus | ESCC | negative regulation of phosphorus metabolic process | 274/8552 | 442/18723 | 2.32e-12 | 9.41e-11 | 274 |
| GO:2001236111 | Esophagus | ESCC | regulation of extrinsic apoptotic signaling pathway | 111/8552 | 151/18723 | 2.97e-12 | 1.18e-10 | 111 |
| GO:0045936111 | Esophagus | ESCC | negative regulation of phosphate metabolic process | 273/8552 | 441/18723 | 3.18e-12 | 1.25e-10 | 273 |
| GO:0016049110 | Esophagus | ESCC | cell growth | 289/8552 | 482/18723 | 1.29e-10 | 3.77e-09 | 289 |
| GO:0042326111 | Esophagus | ESCC | negative regulation of phosphorylation | 237/8552 | 385/18723 | 1.86e-10 | 5.33e-09 | 237 |
| GO:00457865 | Esophagus | ESCC | negative regulation of cell cycle | 236/8552 | 385/18723 | 3.62e-10 | 9.93e-09 | 236 |
| GO:2001235110 | Esophagus | ESCC | positive regulation of apoptotic signaling pathway | 92/8552 | 126/18723 | 3.91e-10 | 1.05e-08 | 92 |
| GO:0030099111 | Esophagus | ESCC | myeloid cell differentiation | 232/8552 | 381/18723 | 1.22e-09 | 2.90e-08 | 232 |
| GO:000155819 | Esophagus | ESCC | regulation of cell growth | 248/8552 | 414/18723 | 2.97e-09 | 6.45e-08 | 248 |
| GO:00435888 | Esophagus | ESCC | skin development | 163/8552 | 263/18723 | 6.48e-08 | 1.14e-06 | 163 |
| GO:200123817 | Esophagus | ESCC | positive regulation of extrinsic apoptotic signaling pathway | 40/8552 | 48/18723 | 8.03e-08 | 1.39e-06 | 40 |
| GO:0002262111 | Esophagus | ESCC | myeloid cell homeostasis | 104/8552 | 157/18723 | 1.49e-07 | 2.36e-06 | 104 |
| GO:0034101111 | Esophagus | ESCC | erythrocyte homeostasis | 88/8552 | 129/18723 | 1.81e-07 | 2.84e-06 | 88 |
| GO:0061458110 | Esophagus | ESCC | reproductive system development | 247/8552 | 427/18723 | 2.24e-07 | 3.42e-06 | 247 |
| GO:004860818 | Esophagus | ESCC | reproductive structure development | 245/8552 | 424/18723 | 2.82e-07 | 4.14e-06 | 245 |
| GO:000854410 | Esophagus | ESCC | epidermis development | 193/8552 | 324/18723 | 2.87e-07 | 4.19e-06 | 193 |
| GO:000008214 | Esophagus | ESCC | G1/S transition of mitotic cell cycle | 134/8552 | 214/18723 | 4.04e-07 | 5.55e-06 | 134 |
| Page: 1 2 3 4 5 6 7 8 9 10 11 12 |
| Pathway ID | Tissue | Disease Stage | Description | Gene Ratio | Bg Ratio | pvalue | p.adjust | qvalue | Count |
| hsa043506 | Oral cavity | OSCC | TGF-beta signaling pathway | 60/3704 | 108/8465 | 8.66e-03 | 1.97e-02 | 1.00e-02 | 60 |
| hsa0435013 | Oral cavity | OSCC | TGF-beta signaling pathway | 60/3704 | 108/8465 | 8.66e-03 | 1.97e-02 | 1.00e-02 | 60 |
| Page: 1 |
Top |
Cell-cell communication analysis |
| Identification of potential cell-cell interactions between two cell types and their ligand-receptor pairs for different disease states |
| Ligand | Receptor | LRpair | Pathway | Tissue | Disease Stage |
| INHBA | ACVR1B_ACVR2A | INHBA_ACVR1B_ACVR2A | ACTIVIN | Cervix | CC |
| INHBA | ACVR1B_ACVR2A | INHBA_ACVR1B_ACVR2A | ACTIVIN | THCA | Cancer |
| Page: 1 |
Top |
Single-cell gene regulatory network inference analysis |
| Find out the significant the regulons (TFs) and the target genes of each regulon across cell types for different disease states |
| TF | Cell Type | Tissue | Disease Stage | Target Gene | RSS | Regulon Activity |
| ∗The dot plots of a searched regulon are shown for all cell subpopulations in each disease state of each tissue based on the regulon specific score inferred using pySCENIC and by calculating the average expression. |
| Page: 1 |
Top |
Somatic mutation of malignant transformation related genes |
| Annotation of somatic variants for genes involved in malignant transformation |
| Hugo Symbol | Variant Class | Variant Classification | dbSNP RS | HGVSc | HGVSp | HGVSp Short | SWISSPROT | BIOTYPE | SIFT | PolyPhen | Tumor Sample Barcode | Tissue | Histology | Sex | Age | Stage | Therapy Types | Drugs | Outcome |
| INHBA | SNV | Missense_Mutation | rs762653354 | c.217G>A | p.Asp73Asn | p.D73N | P08476 | protein_coding | tolerated(1) | benign(0) | TCGA-AN-A046-01 | Breast | breast invasive carcinoma | Female | >=65 | I/II | Unknown | Unknown | SD |
| INHBA | SNV | Missense_Mutation | c.1012N>A | p.Trp338Arg | p.W338R | P08476 | protein_coding | deleterious(0) | probably_damaging(1) | TCGA-BH-A204-01 | Breast | breast invasive carcinoma | Female | >=65 | I/II | Unknown | Unknown | SD | |
| INHBA | SNV | Missense_Mutation | rs373613637 | c.892N>T | p.Arg298Trp | p.R298W | P08476 | protein_coding | deleterious(0) | probably_damaging(0.982) | TCGA-BH-A42T-01 | Breast | breast invasive carcinoma | Female | >=65 | I/II | Unknown | Unknown | SD |
| INHBA | SNV | Missense_Mutation | c.1135C>T | p.Arg379Trp | p.R379W | P08476 | protein_coding | deleterious(0) | probably_damaging(0.999) | TCGA-C8-A27B-01 | Breast | breast invasive carcinoma | Female | <65 | I/II | Chemotherapy | 5-fluorouracil | CR | |
| INHBA | deletion | Frame_Shift_Del | novel | c.776delN | p.Lys259ArgfsTer100 | p.K259Rfs*100 | P08476 | protein_coding | TCGA-EW-A2FV-01 | Breast | breast invasive carcinoma | Female | <65 | III/IV | Chemotherapy | docetaxel | SD | ||
| INHBA | SNV | Missense_Mutation | c.170N>T | p.Ala57Val | p.A57V | P08476 | protein_coding | tolerated(0.08) | probably_damaging(0.999) | TCGA-A6-2686-01 | Colorectum | colon adenocarcinoma | Female | >=65 | I/II | Unknown | Unknown | SD | |
| INHBA | SNV | Missense_Mutation | novel | c.643N>G | p.Lys215Glu | p.K215E | P08476 | protein_coding | deleterious(0.05) | possibly_damaging(0.593) | TCGA-A6-3808-01 | Colorectum | colon adenocarcinoma | Male | >=65 | I/II | Unknown | Unknown | SD |
| INHBA | SNV | Missense_Mutation | c.323N>A | p.Gly108Glu | p.G108E | P08476 | protein_coding | tolerated(0.08) | benign(0.066) | TCGA-AA-3856-01 | Colorectum | colon adenocarcinoma | Male | <65 | I/II | Unknown | Unknown | SD | |
| INHBA | SNV | Missense_Mutation | novel | c.1048T>C | p.Cys350Arg | p.C350R | P08476 | protein_coding | deleterious(0) | probably_damaging(1) | TCGA-AA-3994-01 | Colorectum | colon adenocarcinoma | Male | >=65 | III/IV | Chemotherapy | capecitabine | CR |
| INHBA | SNV | Missense_Mutation | rs150182559 | c.721N>T | p.Arg241Trp | p.R241W | P08476 | protein_coding | deleterious(0) | probably_damaging(1) | TCGA-AA-A00N-01 | Colorectum | colon adenocarcinoma | Male | >=65 | I/II | Unknown | Unknown | PD |
| Page: 1 2 3 4 5 6 7 8 9 10 |
Top |
Related drugs of malignant transformation related genes |
| Identification of chemicals and drugs interact with genes involved in malignant transfromation |
| (DGIdb 4.0) |
| Entrez ID | Symbol | Category | Interaction Types | Drug Claim Name | Drug Name | PMIDs |
| 3624 | INHBA | CLINICALLY ACTIONABLE, GROWTH FACTOR, HORMONE ACTIVITY, DRUGGABLE GENOME | inhibitor | CHEMBL1743073 | SOTATERCEPT |
| Page: 1 |

Copyright 2023-Present -The University of Texas Health Science Center at Houston |