
|
|||||
|
 | |
| |
| |
| |
| |
| |
|
Gene: ING4 |
Gene summary for ING4 |
| Gene information | Species | Human | Gene symbol | ING4 | Gene ID | 51147 |
| Gene name | inhibitor of growth family member 4 | |
| Gene Alias | my036 | |
| Cytomap | 12p13.31 | |
| Gene Type | protein-coding | GO ID | GO:0006139 | UniProtAcc | Q9UNL4 |
Top |
Malignant transformation analysis |
| Identification of the aberrant gene expression in precancerous and cancerous lesions by comparing the gene expression of stem-like cells in diseased tissues with normal stem cells |
| Entrez ID | Symbol | Replicates | Species | Organ | Tissue | Adj P-value | Log2FC | Malignancy |
| 51147 | ING4 | LZE7T | Human | Esophagus | ESCC | 2.60e-02 | 1.12e-01 | 0.0667 |
| 51147 | ING4 | LZE8T | Human | Esophagus | ESCC | 1.38e-07 | 2.42e-01 | 0.067 |
| 51147 | ING4 | LZE20T | Human | Esophagus | ESCC | 9.45e-05 | 2.17e-01 | 0.0662 |
| 51147 | ING4 | LZE24T | Human | Esophagus | ESCC | 2.59e-14 | 4.75e-01 | 0.0596 |
| 51147 | ING4 | P1T-E | Human | Esophagus | ESCC | 3.45e-05 | 3.83e-01 | 0.0875 |
| 51147 | ING4 | P2T-E | Human | Esophagus | ESCC | 1.11e-32 | 6.00e-01 | 0.1177 |
| 51147 | ING4 | P4T-E | Human | Esophagus | ESCC | 5.45e-18 | 4.43e-01 | 0.1323 |
| 51147 | ING4 | P5T-E | Human | Esophagus | ESCC | 3.61e-13 | 1.69e-01 | 0.1327 |
| 51147 | ING4 | P8T-E | Human | Esophagus | ESCC | 2.16e-24 | 3.71e-01 | 0.0889 |
| 51147 | ING4 | P9T-E | Human | Esophagus | ESCC | 2.81e-08 | 1.37e-01 | 0.1131 |
| 51147 | ING4 | P10T-E | Human | Esophagus | ESCC | 7.93e-29 | 5.22e-01 | 0.116 |
| 51147 | ING4 | P11T-E | Human | Esophagus | ESCC | 1.22e-04 | 2.29e-01 | 0.1426 |
| 51147 | ING4 | P12T-E | Human | Esophagus | ESCC | 2.88e-42 | 6.62e-01 | 0.1122 |
| 51147 | ING4 | P15T-E | Human | Esophagus | ESCC | 1.30e-16 | 3.21e-01 | 0.1149 |
| 51147 | ING4 | P16T-E | Human | Esophagus | ESCC | 1.95e-22 | 4.26e-01 | 0.1153 |
| 51147 | ING4 | P17T-E | Human | Esophagus | ESCC | 1.25e-05 | 3.36e-01 | 0.1278 |
| 51147 | ING4 | P19T-E | Human | Esophagus | ESCC | 2.96e-03 | 3.98e-01 | 0.1662 |
| 51147 | ING4 | P20T-E | Human | Esophagus | ESCC | 7.44e-26 | 5.71e-01 | 0.1124 |
| 51147 | ING4 | P21T-E | Human | Esophagus | ESCC | 7.87e-22 | 3.02e-01 | 0.1617 |
| 51147 | ING4 | P22T-E | Human | Esophagus | ESCC | 2.98e-51 | 9.56e-01 | 0.1236 |
| Page: 1 2 3 4 5 6 |
| Tissue | Expression Dynamics | Abbreviation |
| Esophagus | 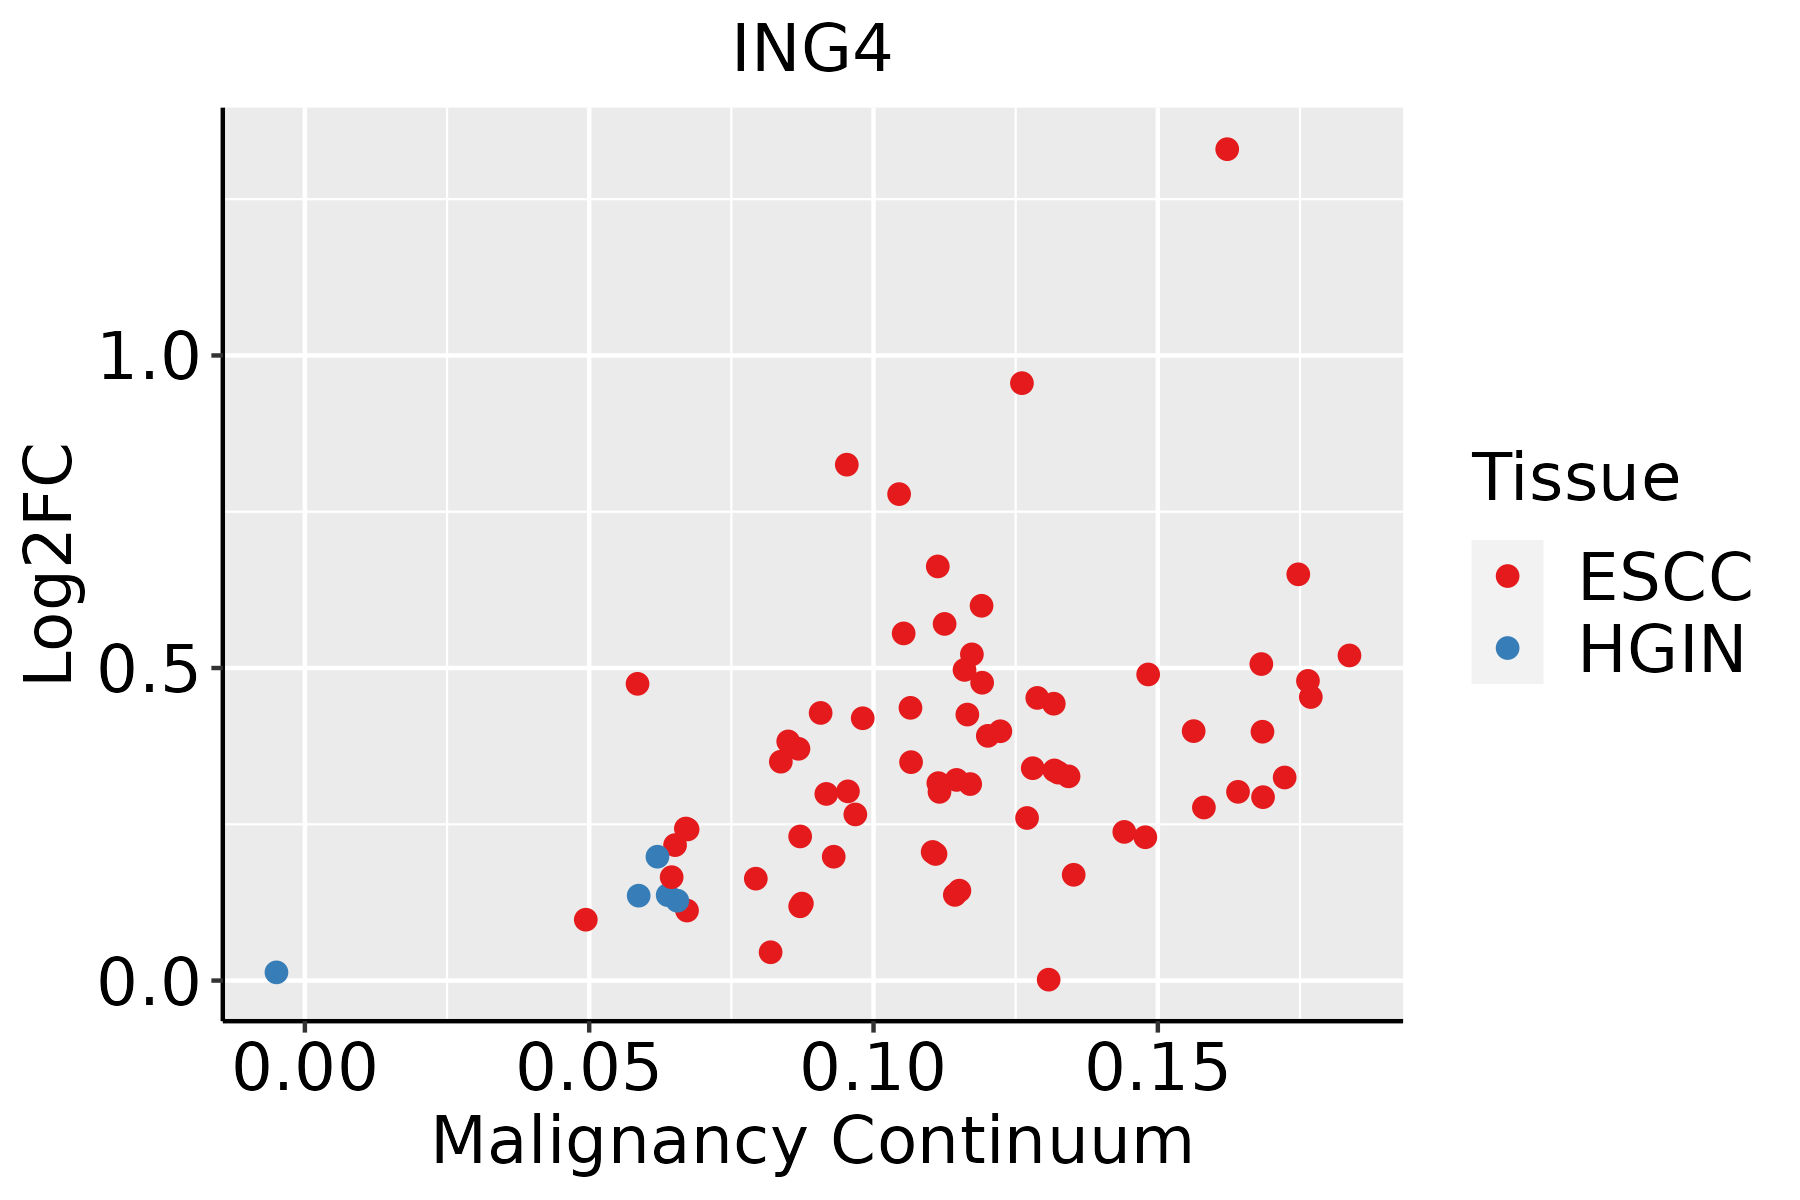 | ESCC: Esophageal squamous cell carcinoma |
| HGIN: High-grade intraepithelial neoplasias | ||
| LGIN: Low-grade intraepithelial neoplasias | ||
| Liver |  | HCC: Hepatocellular carcinoma |
| NAFLD: Non-alcoholic fatty liver disease | ||
| Oral Cavity | 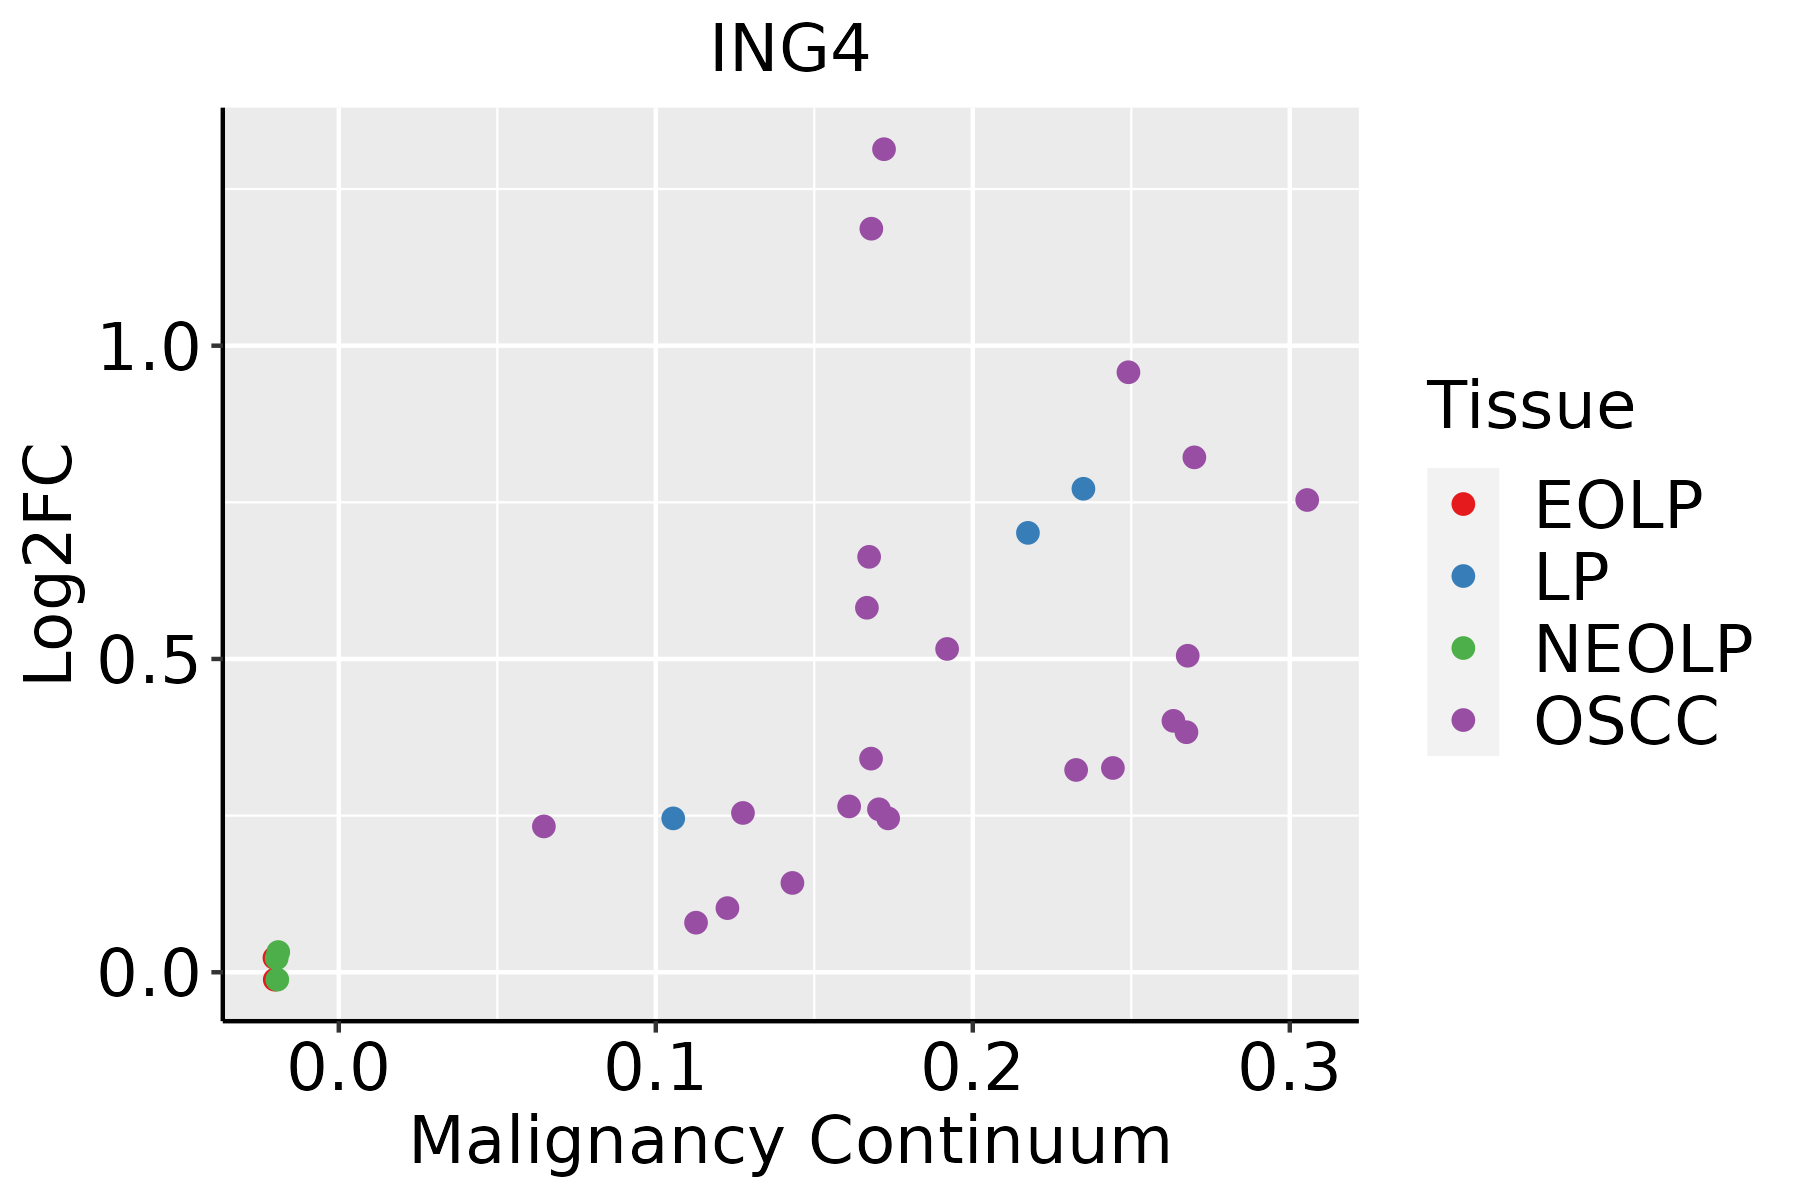 | EOLP: Erosive Oral lichen planus |
| LP: leukoplakia | ||
| NEOLP: Non-erosive oral lichen planus | ||
| OSCC: Oral squamous cell carcinoma | ||
| Thyroid | 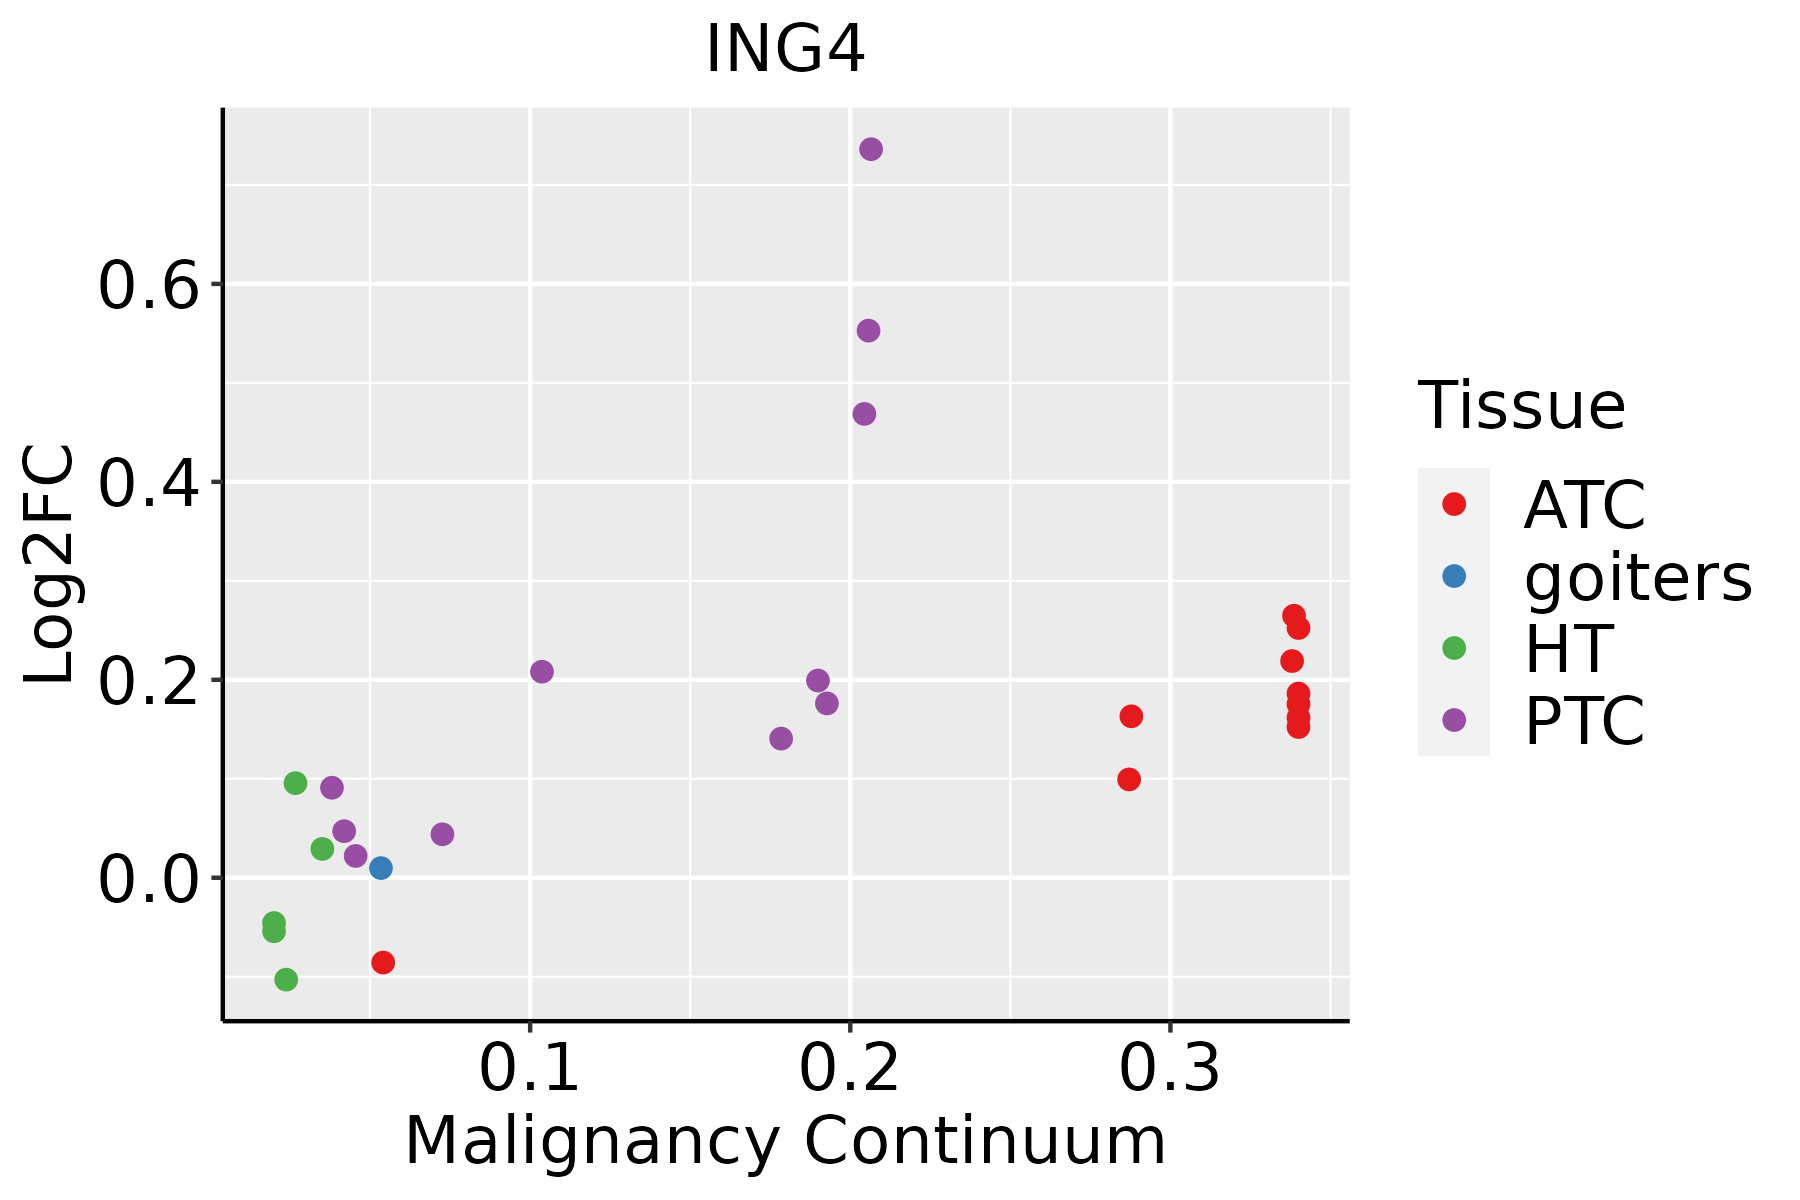 | ATC: Anaplastic thyroid cancer |
| HT: Hashimoto's thyroiditis | ||
| PTC: Papillary thyroid cancer |
| ∗log2FC in expression of this searched gene in stem-like cells from each diseased tissue sample relative to stem-like cells in normal samples in each tissue plotted against the malignancy continuum. Samples are colored based on if they are from different disease stage. |
Top |
Malignant transformation related pathway analysis |
| Find out the enriched GO biological processes and KEGG pathways involved in transition from healthy to precancer to cancer |
| Tissue | Disease Stage | Enriched GO biological Processes |
| Colorectum | AD |  |
| Colorectum | SER |  |
| Colorectum | MSS |  |
| Colorectum | MSI-H |  |
| Colorectum | FAP |  |
| ∗Top 15 enriched GO BP terms are showed in the bar plot of each disease state in each tissue. Each row represents a significant GO biological process which is colored according to the -log10(p.adjust). |
| Page: 1 2 3 4 5 6 7 8 9 |
| GO ID | Tissue | Disease Stage | Description | Gene Ratio | Bg Ratio | pvalue | p.adjust | Count |
| GO:001657015 | Esophagus | ESCC | histone modification | 323/8552 | 463/18723 | 2.61e-26 | 7.88e-24 | 323 |
| GO:001820514 | Esophagus | ESCC | peptidyl-lysine modification | 259/8552 | 376/18723 | 3.90e-20 | 5.26e-18 | 259 |
| GO:00062604 | Esophagus | ESCC | DNA replication | 181/8552 | 260/18723 | 3.55e-15 | 2.05e-13 | 181 |
| GO:0072331111 | Esophagus | ESCC | signal transduction by p53 class mediator | 121/8552 | 163/18723 | 9.61e-14 | 4.69e-12 | 121 |
| GO:001839413 | Esophagus | ESCC | peptidyl-lysine acetylation | 123/8552 | 169/18723 | 6.58e-13 | 2.94e-11 | 123 |
| GO:004354313 | Esophagus | ESCC | protein acylation | 165/8552 | 243/18723 | 1.69e-12 | 7.14e-11 | 165 |
| GO:000647313 | Esophagus | ESCC | protein acetylation | 140/8552 | 201/18723 | 4.37e-12 | 1.69e-10 | 140 |
| GO:001839313 | Esophagus | ESCC | internal peptidyl-lysine acetylation | 114/8552 | 158/18723 | 1.16e-11 | 4.24e-10 | 114 |
| GO:000647513 | Esophagus | ESCC | internal protein amino acid acetylation | 115/8552 | 160/18723 | 1.43e-11 | 5.08e-10 | 115 |
| GO:00165735 | Esophagus | ESCC | histone acetylation | 110/8552 | 152/18723 | 1.95e-11 | 6.81e-10 | 110 |
| GO:004277014 | Esophagus | ESCC | signal transduction in response to DNA damage | 117/8552 | 172/18723 | 2.38e-09 | 5.32e-08 | 117 |
| GO:004396712 | Esophagus | ESCC | histone H4 acetylation | 53/8552 | 67/18723 | 2.11e-08 | 4.03e-07 | 53 |
| GO:0030330110 | Esophagus | ESCC | DNA damage response, signal transduction by p53 class mediator | 53/8552 | 72/18723 | 1.34e-06 | 1.63e-05 | 53 |
| GO:00459267 | Esophagus | ESCC | negative regulation of growth | 148/8552 | 249/18723 | 7.88e-06 | 7.73e-05 | 148 |
| GO:00439662 | Esophagus | ESCC | histone H3 acetylation | 43/8552 | 61/18723 | 7.57e-05 | 5.67e-04 | 43 |
| GO:00427722 | Esophagus | ESCC | DNA damage response, signal transduction resulting in transcription | 15/8552 | 17/18723 | 3.48e-04 | 2.03e-03 | 15 |
| GO:00069782 | Esophagus | ESCC | DNA damage response, signal transduction by p53 class mediator resulting in transcription of p21 class mediator | 14/8552 | 16/18723 | 6.78e-04 | 3.56e-03 | 14 |
| GO:00439811 | Esophagus | ESCC | histone H4-K5 acetylation | 13/8552 | 15/18723 | 1.31e-03 | 6.26e-03 | 13 |
| GO:00439821 | Esophagus | ESCC | histone H4-K8 acetylation | 13/8552 | 15/18723 | 1.31e-03 | 6.26e-03 | 13 |
| GO:00064731 | Liver | Cirrhotic | protein acetylation | 84/4634 | 201/18723 | 7.50e-08 | 2.25e-06 | 84 |
| Page: 1 2 3 4 5 6 |
| Pathway ID | Tissue | Disease Stage | Description | Gene Ratio | Bg Ratio | pvalue | p.adjust | qvalue | Count |
| Page: 1 |
Top |
Cell-cell communication analysis |
| Identification of potential cell-cell interactions between two cell types and their ligand-receptor pairs for different disease states |
| Ligand | Receptor | LRpair | Pathway | Tissue | Disease Stage |
| Page: 1 |
Top |
Single-cell gene regulatory network inference analysis |
| Find out the significant the regulons (TFs) and the target genes of each regulon across cell types for different disease states |
| TF | Cell Type | Tissue | Disease Stage | Target Gene | RSS | Regulon Activity |
| ING4 | ICAF | Breast | IDC | TBP,CDKL5,AC025159.1, etc. | 6.19e-03 |  |
| ING4 | PLA | Lung | Healthy | LARP4,RPL36AL,CHCHD5, etc. | 7.85e-02 |  |
| ING4 | SPI | Oral cavity | EOLP | ZNF114,RP11-305K5.1,MME, etc. | 1.71e-01 |  |
| ING4 | NUER | Prostate | ADJ | AC007405.6,HCAR2,LSM11, etc. | 4.30e-02 |  |
| ING4 | NUER | Prostate | BPH | AC007405.6,HCAR2,LSM11, etc. | 2.51e-02 |  |
| ING4 | URO | Prostate | BPH | AC007405.6,HCAR2,LSM11, etc. | 5.33e-02 | |
| ING4 | URO | Prostate | Tumor | AC007405.6,HCAR2,LSM11, etc. | 1.59e-01 |  |
| ING4 | A.X | Stomach | Healthy | VAMP2,ZCRB1,ATP4B, etc. | 1.19e-01 |  |
| ∗The dot plots of a searched regulon are shown for all cell subpopulations in each disease state of each tissue based on the regulon specific score inferred using pySCENIC and by calculating the average expression. |
| Page: 1 |
Top |
Somatic mutation of malignant transformation related genes |
| Annotation of somatic variants for genes involved in malignant transformation |
| Hugo Symbol | Variant Class | Variant Classification | dbSNP RS | HGVSc | HGVSp | HGVSp Short | SWISSPROT | BIOTYPE | SIFT | PolyPhen | Tumor Sample Barcode | Tissue | Histology | Sex | Age | Stage | Therapy Types | Drugs | Outcome |
| ING4 | SNV | Missense_Mutation | c.349N>A | p.Glu117Lys | p.E117K | Q9UNL4 | protein_coding | tolerated(0.55) | benign(0.284) | TCGA-A8-A092-01 | Breast | breast invasive carcinoma | Female | <65 | III/IV | Chemotherapy | paclitaxel | CR | |
| ING4 | SNV | Missense_Mutation | novel | c.229N>C | p.Glu77Gln | p.E77Q | Q9UNL4 | protein_coding | deleterious(0.01) | probably_damaging(0.992) | TCGA-ZJ-AAXU-01 | Cervix | cervical & endocervical cancer | Female | <65 | I/II | Unknown | Unknown | SD |
| ING4 | SNV | Missense_Mutation | c.463N>A | p.Pro155Thr | p.P155T | Q9UNL4 | protein_coding | tolerated(0.06) | possibly_damaging(0.616) | TCGA-AA-3864-01 | Colorectum | colon adenocarcinoma | Male | >=65 | I/II | Unknown | Unknown | SD | |
| ING4 | SNV | Missense_Mutation | novel | c.662N>C | p.Trp221Ser | p.W221S | Q9UNL4 | protein_coding | deleterious(0) | probably_damaging(0.998) | TCGA-AA-A00O-01 | Colorectum | colon adenocarcinoma | Female | >=65 | III/IV | Unknown | Unknown | SD |
| ING4 | SNV | Missense_Mutation | c.470N>T | p.Thr157Ile | p.T157I | Q9UNL4 | protein_coding | tolerated(0.11) | benign(0.01) | TCGA-G4-6588-01 | Colorectum | colon adenocarcinoma | Female | <65 | I/II | Unknown | Unknown | SD | |
| ING4 | SNV | Missense_Mutation | novel | c.119N>A | p.Ala40Asp | p.A40D | Q9UNL4 | protein_coding | tolerated(0.38) | benign(0.024) | TCGA-A5-A0G1-01 | Endometrium | uterine corpus endometrioid carcinoma | Female | >=65 | I/II | Unknown | Unknown | SD |
| ING4 | SNV | Missense_Mutation | c.307N>T | p.Asp103Tyr | p.D103Y | Q9UNL4 | protein_coding | deleterious(0) | probably_damaging(0.998) | TCGA-AP-A051-01 | Endometrium | uterine corpus endometrioid carcinoma | Female | >=65 | I/II | Unknown | Unknown | SD | |
| ING4 | SNV | Missense_Mutation | novel | c.313N>T | p.Ala105Ser | p.A105S | Q9UNL4 | protein_coding | tolerated(0.12) | possibly_damaging(0.759) | TCGA-AP-A1DK-01 | Endometrium | uterine corpus endometrioid carcinoma | Female | <65 | I/II | Unknown | Unknown | SD |
| ING4 | SNV | Missense_Mutation | novel | c.602G>A | p.Cys201Tyr | p.C201Y | Q9UNL4 | protein_coding | deleterious(0) | probably_damaging(0.967) | TCGA-AX-A06F-01 | Endometrium | uterine corpus endometrioid carcinoma | Female | <65 | III/IV | Chemotherapy | carboplatin | SD |
| ING4 | SNV | Missense_Mutation | c.497N>A | p.Arg166His | p.R166H | Q9UNL4 | protein_coding | tolerated(0.15) | benign(0.153) | TCGA-B5-A11E-01 | Endometrium | uterine corpus endometrioid carcinoma | Female | <65 | I/II | Unknown | Unknown | SD |
| Page: 1 2 |
Top |
Related drugs of malignant transformation related genes |
| Identification of chemicals and drugs interact with genes involved in malignant transfromation |
| (DGIdb 4.0) |
| Entrez ID | Symbol | Category | Interaction Types | Drug Claim Name | Drug Name | PMIDs |
| Page: 1 |

Copyright 2023-Present -The University of Texas Health Science Center at Houston |