
|
|||||
|
 | |
| |
| |
| |
| |
| |
|
Gene: ING2 |
Gene summary for ING2 |
| Gene information | Species | Human | Gene symbol | ING2 | Gene ID | 3622 |
| Gene name | inhibitor of growth family member 2 | |
| Gene Alias | ING1L | |
| Cytomap | 4q35.1 | |
| Gene Type | protein-coding | GO ID | GO:0000003 | UniProtAcc | Q9H160 |
Top |
Malignant transformation analysis |
| Identification of the aberrant gene expression in precancerous and cancerous lesions by comparing the gene expression of stem-like cells in diseased tissues with normal stem cells |
| Entrez ID | Symbol | Replicates | Species | Organ | Tissue | Adj P-value | Log2FC | Malignancy |
| 3622 | ING2 | LZE4T | Human | Esophagus | ESCC | 2.75e-02 | 1.29e-01 | 0.0811 |
| 3622 | ING2 | LZE24T | Human | Esophagus | ESCC | 1.79e-08 | 2.38e-01 | 0.0596 |
| 3622 | ING2 | P1T-E | Human | Esophagus | ESCC | 1.29e-03 | 3.22e-01 | 0.0875 |
| 3622 | ING2 | P2T-E | Human | Esophagus | ESCC | 2.26e-20 | 4.31e-01 | 0.1177 |
| 3622 | ING2 | P4T-E | Human | Esophagus | ESCC | 2.40e-10 | 2.51e-01 | 0.1323 |
| 3622 | ING2 | P5T-E | Human | Esophagus | ESCC | 1.66e-11 | 3.51e-01 | 0.1327 |
| 3622 | ING2 | P8T-E | Human | Esophagus | ESCC | 1.13e-16 | 2.24e-01 | 0.0889 |
| 3622 | ING2 | P9T-E | Human | Esophagus | ESCC | 4.47e-03 | 9.25e-02 | 0.1131 |
| 3622 | ING2 | P10T-E | Human | Esophagus | ESCC | 3.35e-13 | 1.81e-01 | 0.116 |
| 3622 | ING2 | P11T-E | Human | Esophagus | ESCC | 2.87e-08 | 2.86e-01 | 0.1426 |
| 3622 | ING2 | P12T-E | Human | Esophagus | ESCC | 4.26e-37 | 8.68e-01 | 0.1122 |
| 3622 | ING2 | P15T-E | Human | Esophagus | ESCC | 2.28e-16 | 4.88e-01 | 0.1149 |
| 3622 | ING2 | P16T-E | Human | Esophagus | ESCC | 7.71e-12 | 2.68e-01 | 0.1153 |
| 3622 | ING2 | P17T-E | Human | Esophagus | ESCC | 3.59e-04 | 1.88e-01 | 0.1278 |
| 3622 | ING2 | P20T-E | Human | Esophagus | ESCC | 1.26e-07 | 1.83e-01 | 0.1124 |
| 3622 | ING2 | P21T-E | Human | Esophagus | ESCC | 4.71e-14 | 2.23e-01 | 0.1617 |
| 3622 | ING2 | P22T-E | Human | Esophagus | ESCC | 1.05e-03 | 1.15e-01 | 0.1236 |
| 3622 | ING2 | P23T-E | Human | Esophagus | ESCC | 2.45e-47 | 1.35e+00 | 0.108 |
| 3622 | ING2 | P24T-E | Human | Esophagus | ESCC | 2.44e-10 | 1.13e-01 | 0.1287 |
| 3622 | ING2 | P26T-E | Human | Esophagus | ESCC | 5.03e-23 | 5.31e-01 | 0.1276 |
| Page: 1 2 3 4 5 |
| Tissue | Expression Dynamics | Abbreviation |
| Esophagus | 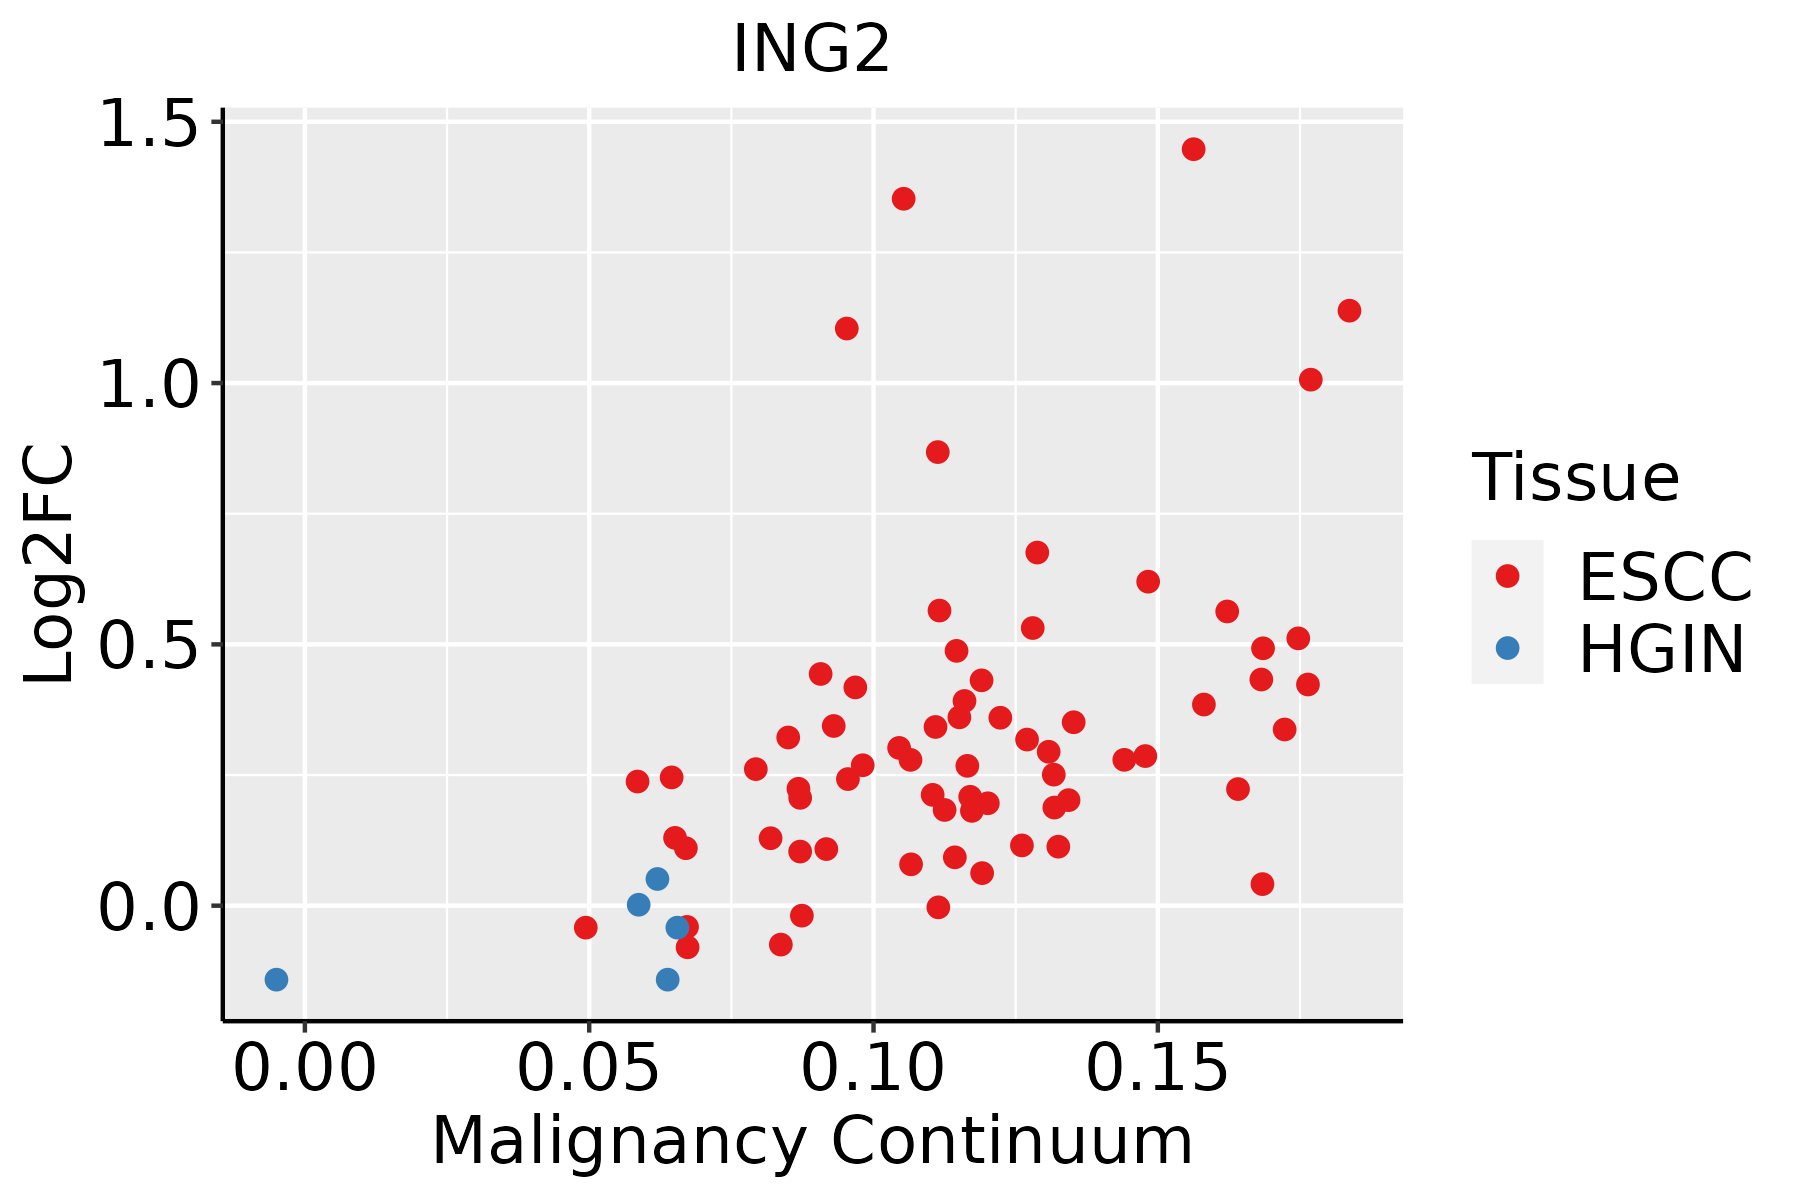 | ESCC: Esophageal squamous cell carcinoma |
| HGIN: High-grade intraepithelial neoplasias | ||
| LGIN: Low-grade intraepithelial neoplasias | ||
| Oral Cavity |  | EOLP: Erosive Oral lichen planus |
| LP: leukoplakia | ||
| NEOLP: Non-erosive oral lichen planus | ||
| OSCC: Oral squamous cell carcinoma | ||
| Skin | 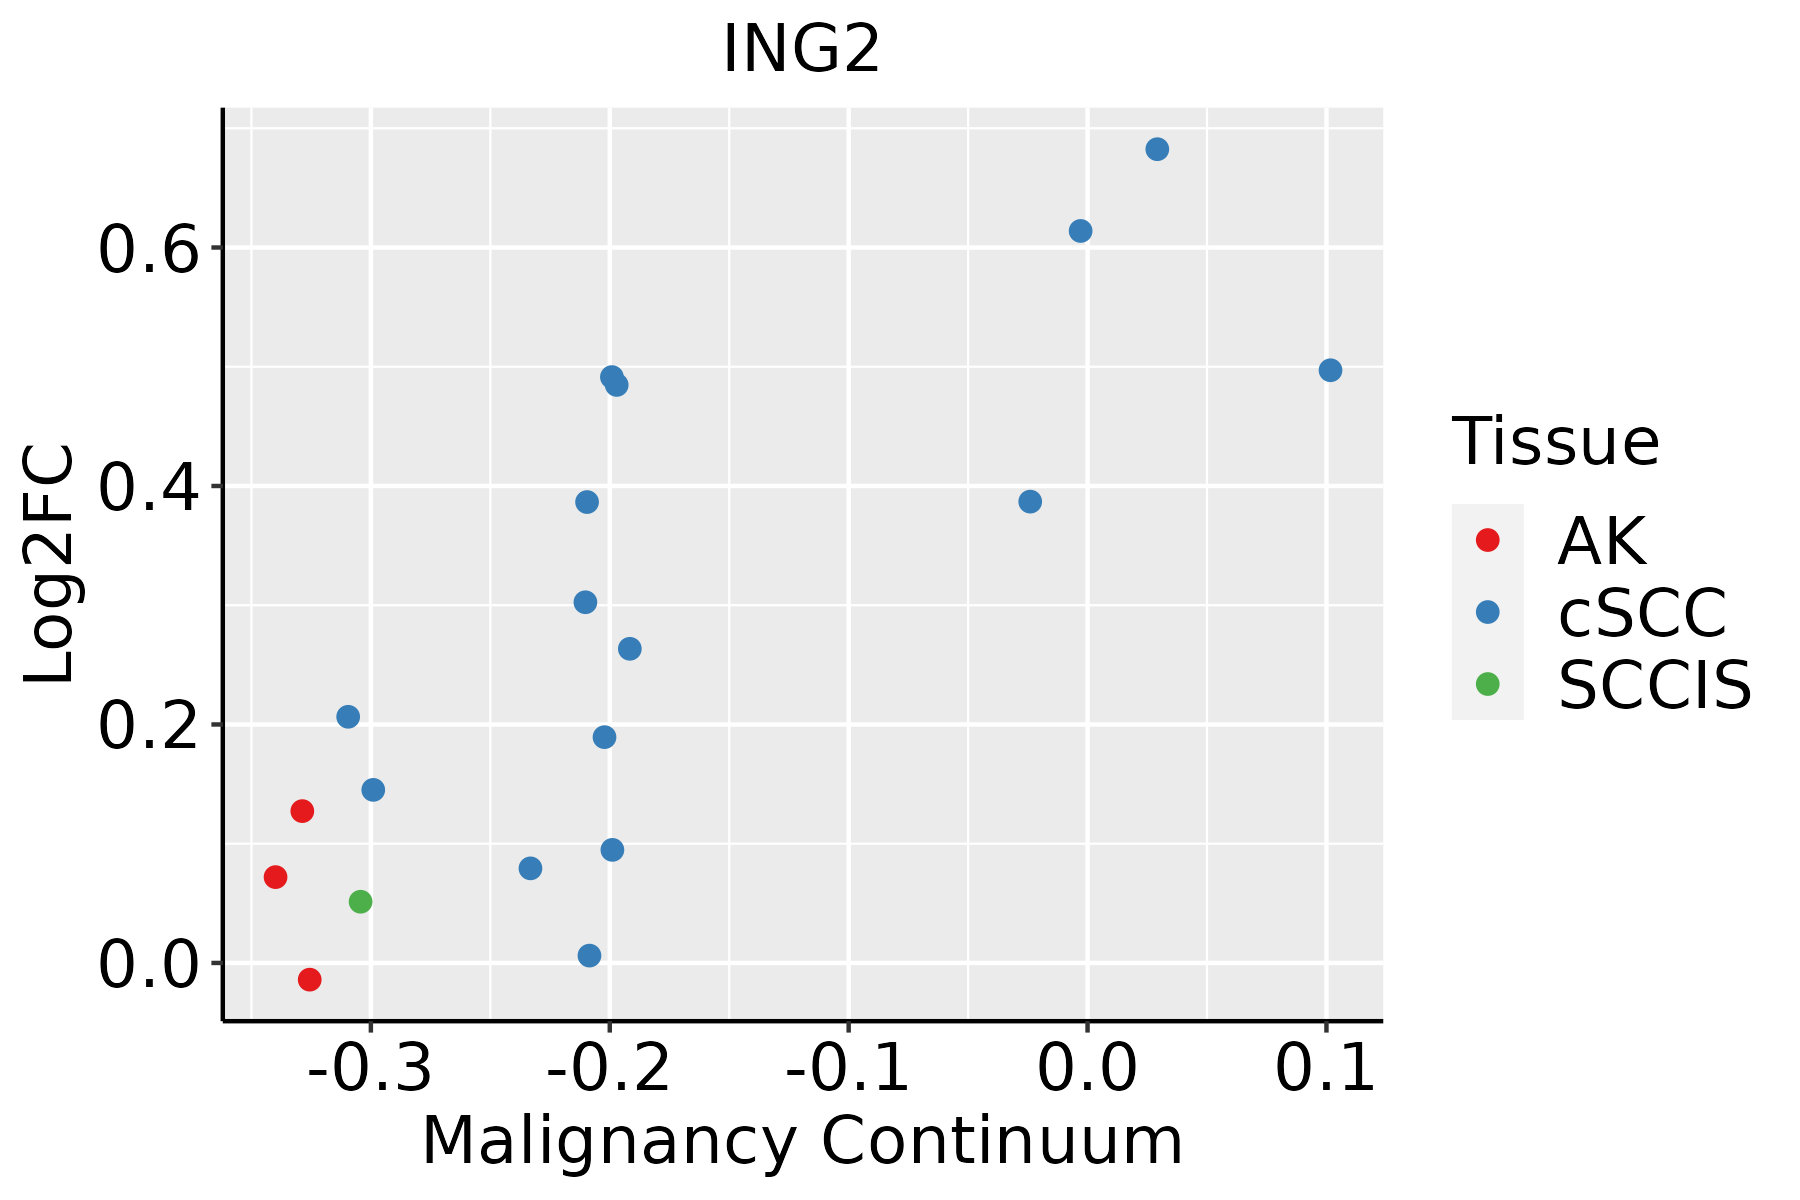 | AK: Actinic keratosis |
| cSCC: Cutaneous squamous cell carcinoma | ||
| SCCIS:squamous cell carcinoma in situ | ||
| Thyroid | 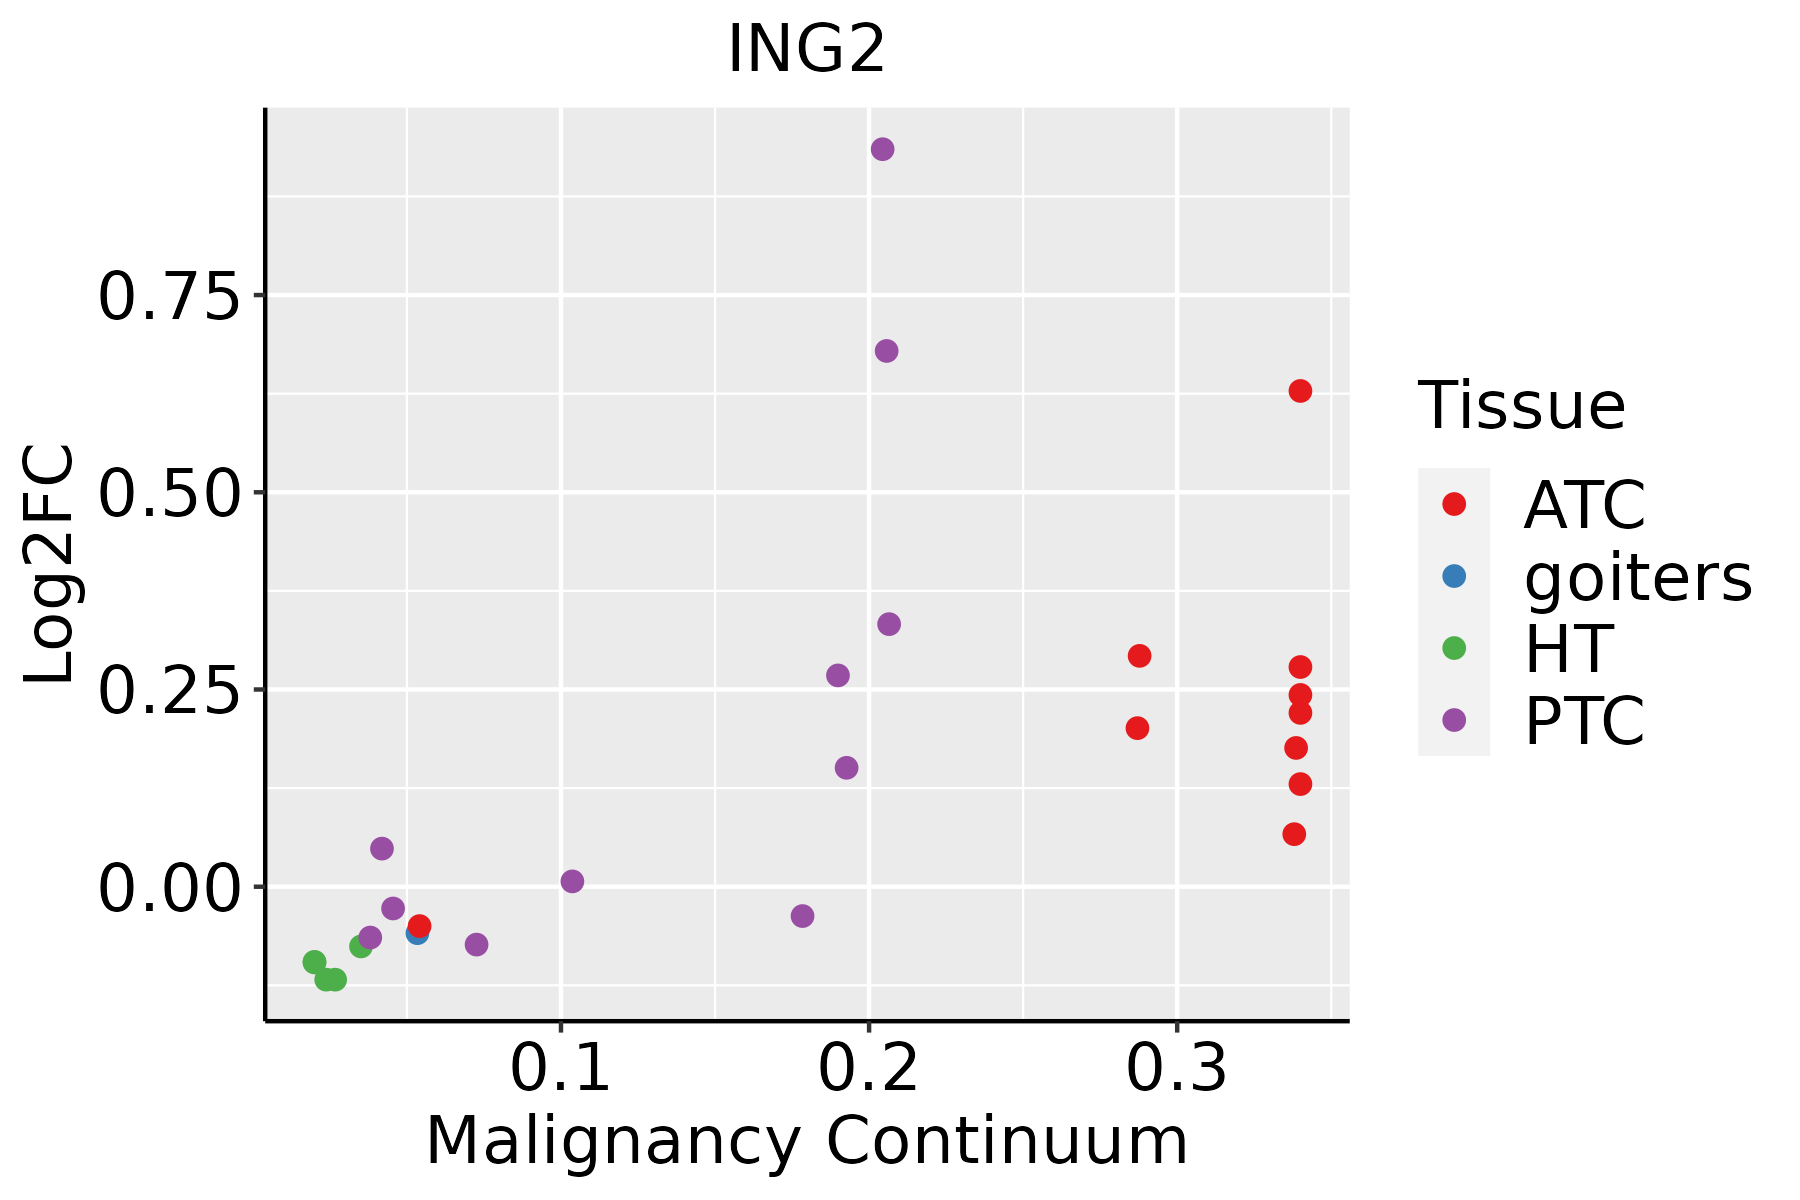 | ATC: Anaplastic thyroid cancer |
| HT: Hashimoto's thyroiditis | ||
| PTC: Papillary thyroid cancer |
| ∗log2FC in expression of this searched gene in stem-like cells from each diseased tissue sample relative to stem-like cells in normal samples in each tissue plotted against the malignancy continuum. Samples are colored based on if they are from different disease stage. |
Top |
Malignant transformation related pathway analysis |
| Find out the enriched GO biological processes and KEGG pathways involved in transition from healthy to precancer to cancer |
| Tissue | Disease Stage | Enriched GO biological Processes |
| Colorectum | AD |  |
| Colorectum | SER |  |
| Colorectum | MSS |  |
| Colorectum | MSI-H |  |
| Colorectum | FAP |  |
| ∗Top 15 enriched GO BP terms are showed in the bar plot of each disease state in each tissue. Each row represents a significant GO biological process which is colored according to the -log10(p.adjust). |
| Page: 1 2 3 4 5 6 7 8 9 |
| GO ID | Tissue | Disease Stage | Description | Gene Ratio | Bg Ratio | pvalue | p.adjust | Count |
| GO:0097193111 | Esophagus | ESCC | intrinsic apoptotic signaling pathway | 222/8552 | 288/18723 | 5.87e-28 | 2.02e-25 | 222 |
| GO:001657015 | Esophagus | ESCC | histone modification | 323/8552 | 463/18723 | 2.61e-26 | 7.88e-24 | 323 |
| GO:2001233111 | Esophagus | ESCC | regulation of apoptotic signaling pathway | 256/8552 | 356/18723 | 4.11e-24 | 1.04e-21 | 256 |
| GO:2001242111 | Esophagus | ESCC | regulation of intrinsic apoptotic signaling pathway | 128/8552 | 164/18723 | 1.75e-17 | 1.50e-15 | 128 |
| GO:2001234111 | Esophagus | ESCC | negative regulation of apoptotic signaling pathway | 161/8552 | 224/18723 | 1.24e-15 | 8.09e-14 | 161 |
| GO:0072331111 | Esophagus | ESCC | signal transduction by p53 class mediator | 121/8552 | 163/18723 | 9.61e-14 | 4.69e-12 | 121 |
| GO:00482853 | Esophagus | ESCC | organelle fission | 301/8552 | 488/18723 | 4.64e-13 | 2.12e-11 | 301 |
| GO:2001243111 | Esophagus | ESCC | negative regulation of intrinsic apoptotic signaling pathway | 78/8552 | 98/18723 | 5.50e-12 | 2.10e-10 | 78 |
| GO:00002802 | Esophagus | ESCC | nuclear division | 270/8552 | 439/18723 | 1.17e-11 | 4.24e-10 | 270 |
| GO:0008630110 | Esophagus | ESCC | intrinsic apoptotic signaling pathway in response to DNA damage | 78/8552 | 99/18723 | 1.43e-11 | 5.08e-10 | 78 |
| GO:2001020110 | Esophagus | ESCC | regulation of response to DNA damage stimulus | 145/8552 | 219/18723 | 5.97e-10 | 1.50e-08 | 145 |
| GO:003105614 | Esophagus | ESCC | regulation of histone modification | 106/8552 | 152/18723 | 1.52e-09 | 3.55e-08 | 106 |
| GO:1901796111 | Esophagus | ESCC | regulation of signal transduction by p53 class mediator | 70/8552 | 93/18723 | 5.69e-09 | 1.18e-07 | 70 |
| GO:0042771110 | Esophagus | ESCC | intrinsic apoptotic signaling pathway in response to DNA damage by p53 class mediator | 38/8552 | 43/18723 | 5.75e-09 | 1.18e-07 | 38 |
| GO:0072332111 | Esophagus | ESCC | intrinsic apoptotic signaling pathway by p53 class mediator | 59/8552 | 76/18723 | 1.22e-08 | 2.42e-07 | 59 |
| GO:000632517 | Esophagus | ESCC | chromatin organization | 240/8552 | 409/18723 | 6.52e-08 | 1.14e-06 | 240 |
| GO:00356015 | Esophagus | ESCC | protein deacylation | 79/8552 | 112/18723 | 8.30e-08 | 1.42e-06 | 79 |
| GO:0061458110 | Esophagus | ESCC | reproductive system development | 247/8552 | 427/18723 | 2.24e-07 | 3.42e-06 | 247 |
| GO:000756820 | Esophagus | ESCC | aging | 201/8552 | 339/18723 | 2.64e-07 | 3.94e-06 | 201 |
| GO:004860818 | Esophagus | ESCC | reproductive structure development | 245/8552 | 424/18723 | 2.82e-07 | 4.14e-06 | 245 |
| Page: 1 2 3 4 5 6 7 8 9 10 11 12 |
| Pathway ID | Tissue | Disease Stage | Description | Gene Ratio | Bg Ratio | pvalue | p.adjust | qvalue | Count |
| Page: 1 |
Top |
Cell-cell communication analysis |
| Identification of potential cell-cell interactions between two cell types and their ligand-receptor pairs for different disease states |
| Ligand | Receptor | LRpair | Pathway | Tissue | Disease Stage |
| Page: 1 |
Top |
Single-cell gene regulatory network inference analysis |
| Find out the significant the regulons (TFs) and the target genes of each regulon across cell types for different disease states |
| TF | Cell Type | Tissue | Disease Stage | Target Gene | RSS | Regulon Activity |
| ∗The dot plots of a searched regulon are shown for all cell subpopulations in each disease state of each tissue based on the regulon specific score inferred using pySCENIC and by calculating the average expression. |
| Page: 1 |
Top |
Somatic mutation of malignant transformation related genes |
| Annotation of somatic variants for genes involved in malignant transformation |
| Hugo Symbol | Variant Class | Variant Classification | dbSNP RS | HGVSc | HGVSp | HGVSp Short | SWISSPROT | BIOTYPE | SIFT | PolyPhen | Tumor Sample Barcode | Tissue | Histology | Sex | Age | Stage | Therapy Types | Drugs | Outcome |
| ING2 | SNV | Missense_Mutation | c.602C>T | p.Ser201Leu | p.S201L | Q9H160 | protein_coding | deleterious(0.03) | possibly_damaging(0.906) | TCGA-C8-A26Y-01 | Breast | breast invasive carcinoma | Female | >=65 | I/II | Unknown | Unknown | SD | |
| ING2 | SNV | Missense_Mutation | novel | c.400N>C | p.Ala134Pro | p.A134P | Q9H160 | protein_coding | tolerated(0.41) | benign(0) | TCGA-ZJ-AAXF-01 | Cervix | cervical & endocervical cancer | Female | <65 | I/II | Unknown | Unknown | SD |
| ING2 | SNV | Missense_Mutation | c.445T>C | p.Ser149Pro | p.S149P | Q9H160 | protein_coding | tolerated(0.16) | possibly_damaging(0.502) | TCGA-AA-3663-01 | Colorectum | colon adenocarcinoma | Male | <65 | I/II | Unknown | Unknown | SD | |
| ING2 | SNV | Missense_Mutation | novel | c.355N>A | p.Glu119Lys | p.E119K | Q9H160 | protein_coding | deleterious(0.01) | possibly_damaging(0.5) | TCGA-AA-3984-01 | Colorectum | colon adenocarcinoma | Female | <65 | I/II | Unknown | Unknown | SD |
| ING2 | SNV | Missense_Mutation | novel | c.679N>A | p.Gly227Arg | p.G227R | Q9H160 | protein_coding | deleterious(0.01) | probably_damaging(0.991) | TCGA-AZ-4315-01 | Colorectum | colon adenocarcinoma | Male | <65 | I/II | Unknown | Unknown | SD |
| ING2 | SNV | Missense_Mutation | c.202N>A | p.Glu68Lys | p.E68K | Q9H160 | protein_coding | deleterious(0.03) | probably_damaging(0.989) | TCGA-AG-A002-01 | Colorectum | rectum adenocarcinoma | Male | <65 | I/II | Unknown | Unknown | SD | |
| ING2 | SNV | Missense_Mutation | rs770426903 | c.521N>G | p.Asp174Gly | p.D174G | Q9H160 | protein_coding | tolerated(0.5) | benign(0) | TCGA-EI-6507-01 | Colorectum | rectum adenocarcinoma | Male | <65 | I/II | Unknown | Unknown | SD |
| ING2 | SNV | Missense_Mutation | novel | c.477N>C | p.Glu159Asp | p.E159D | Q9H160 | protein_coding | tolerated(0.19) | probably_damaging(0.956) | TCGA-AP-A1DV-01 | Endometrium | uterine corpus endometrioid carcinoma | Female | <65 | I/II | Unknown | Unknown | SD |
| ING2 | SNV | Missense_Mutation | c.202N>A | p.Glu68Lys | p.E68K | Q9H160 | protein_coding | deleterious(0.03) | probably_damaging(0.989) | TCGA-AX-A05Z-01 | Endometrium | uterine corpus endometrioid carcinoma | Female | <65 | III/IV | Chemotherapy | adriamycin | SD | |
| ING2 | SNV | Missense_Mutation | c.605N>T | p.Pro202Leu | p.P202L | Q9H160 | protein_coding | deleterious(0) | probably_damaging(0.997) | TCGA-B5-A0JR-01 | Endometrium | uterine corpus endometrioid carcinoma | Female | >=65 | I/II | Unknown | Unknown | SD |
| Page: 1 2 3 |
Top |
Related drugs of malignant transformation related genes |
| Identification of chemicals and drugs interact with genes involved in malignant transfromation |
| (DGIdb 4.0) |
| Entrez ID | Symbol | Category | Interaction Types | Drug Claim Name | Drug Name | PMIDs |
| Page: 1 |

Copyright 2023-Present -The University of Texas Health Science Center at Houston |