
|
|||||
|
 | |
| |
| |
| |
| |
| |
|
Gene: INF2 |
Gene summary for INF2 |
| Gene information | Species | Human | Gene symbol | INF2 | Gene ID | 64423 |
| Gene name | inverted formin 2 | |
| Gene Alias | C14orf151 | |
| Cytomap | 14q32.33 | |
| Gene Type | protein-coding | GO ID | GO:0000266 | UniProtAcc | Q27J81 |
Top |
Malignant transformation analysis |
| Identification of the aberrant gene expression in precancerous and cancerous lesions by comparing the gene expression of stem-like cells in diseased tissues with normal stem cells |
| Entrez ID | Symbol | Replicates | Species | Organ | Tissue | Adj P-value | Log2FC | Malignancy |
| 64423 | INF2 | LZE2T | Human | Esophagus | ESCC | 4.43e-02 | 3.13e-01 | 0.082 |
| 64423 | INF2 | LZE4T | Human | Esophagus | ESCC | 1.02e-06 | 9.03e-02 | 0.0811 |
| 64423 | INF2 | LZE20T | Human | Esophagus | ESCC | 3.78e-02 | 9.49e-02 | 0.0662 |
| 64423 | INF2 | LZE24T | Human | Esophagus | ESCC | 9.01e-06 | 1.17e-01 | 0.0596 |
| 64423 | INF2 | P1T-E | Human | Esophagus | ESCC | 1.65e-03 | 3.92e-01 | 0.0875 |
| 64423 | INF2 | P2T-E | Human | Esophagus | ESCC | 3.38e-09 | 1.01e-01 | 0.1177 |
| 64423 | INF2 | P4T-E | Human | Esophagus | ESCC | 2.81e-19 | 3.01e-01 | 0.1323 |
| 64423 | INF2 | P5T-E | Human | Esophagus | ESCC | 3.17e-28 | 3.41e-01 | 0.1327 |
| 64423 | INF2 | P8T-E | Human | Esophagus | ESCC | 8.14e-20 | 3.71e-01 | 0.0889 |
| 64423 | INF2 | P9T-E | Human | Esophagus | ESCC | 3.02e-08 | 1.38e-01 | 0.1131 |
| 64423 | INF2 | P10T-E | Human | Esophagus | ESCC | 3.79e-36 | 5.74e-01 | 0.116 |
| 64423 | INF2 | P11T-E | Human | Esophagus | ESCC | 1.41e-11 | 3.88e-01 | 0.1426 |
| 64423 | INF2 | P12T-E | Human | Esophagus | ESCC | 3.13e-20 | 3.53e-01 | 0.1122 |
| 64423 | INF2 | P15T-E | Human | Esophagus | ESCC | 4.13e-29 | 5.88e-01 | 0.1149 |
| 64423 | INF2 | P16T-E | Human | Esophagus | ESCC | 2.12e-07 | 1.38e-01 | 0.1153 |
| 64423 | INF2 | P17T-E | Human | Esophagus | ESCC | 1.60e-09 | 4.32e-01 | 0.1278 |
| 64423 | INF2 | P19T-E | Human | Esophagus | ESCC | 5.46e-07 | 6.42e-01 | 0.1662 |
| 64423 | INF2 | P20T-E | Human | Esophagus | ESCC | 2.71e-15 | 3.14e-01 | 0.1124 |
| 64423 | INF2 | P21T-E | Human | Esophagus | ESCC | 2.33e-25 | 4.71e-01 | 0.1617 |
| 64423 | INF2 | P22T-E | Human | Esophagus | ESCC | 3.13e-12 | 1.93e-01 | 0.1236 |
| Page: 1 2 3 4 5 6 7 |
| Tissue | Expression Dynamics | Abbreviation |
| Esophagus | 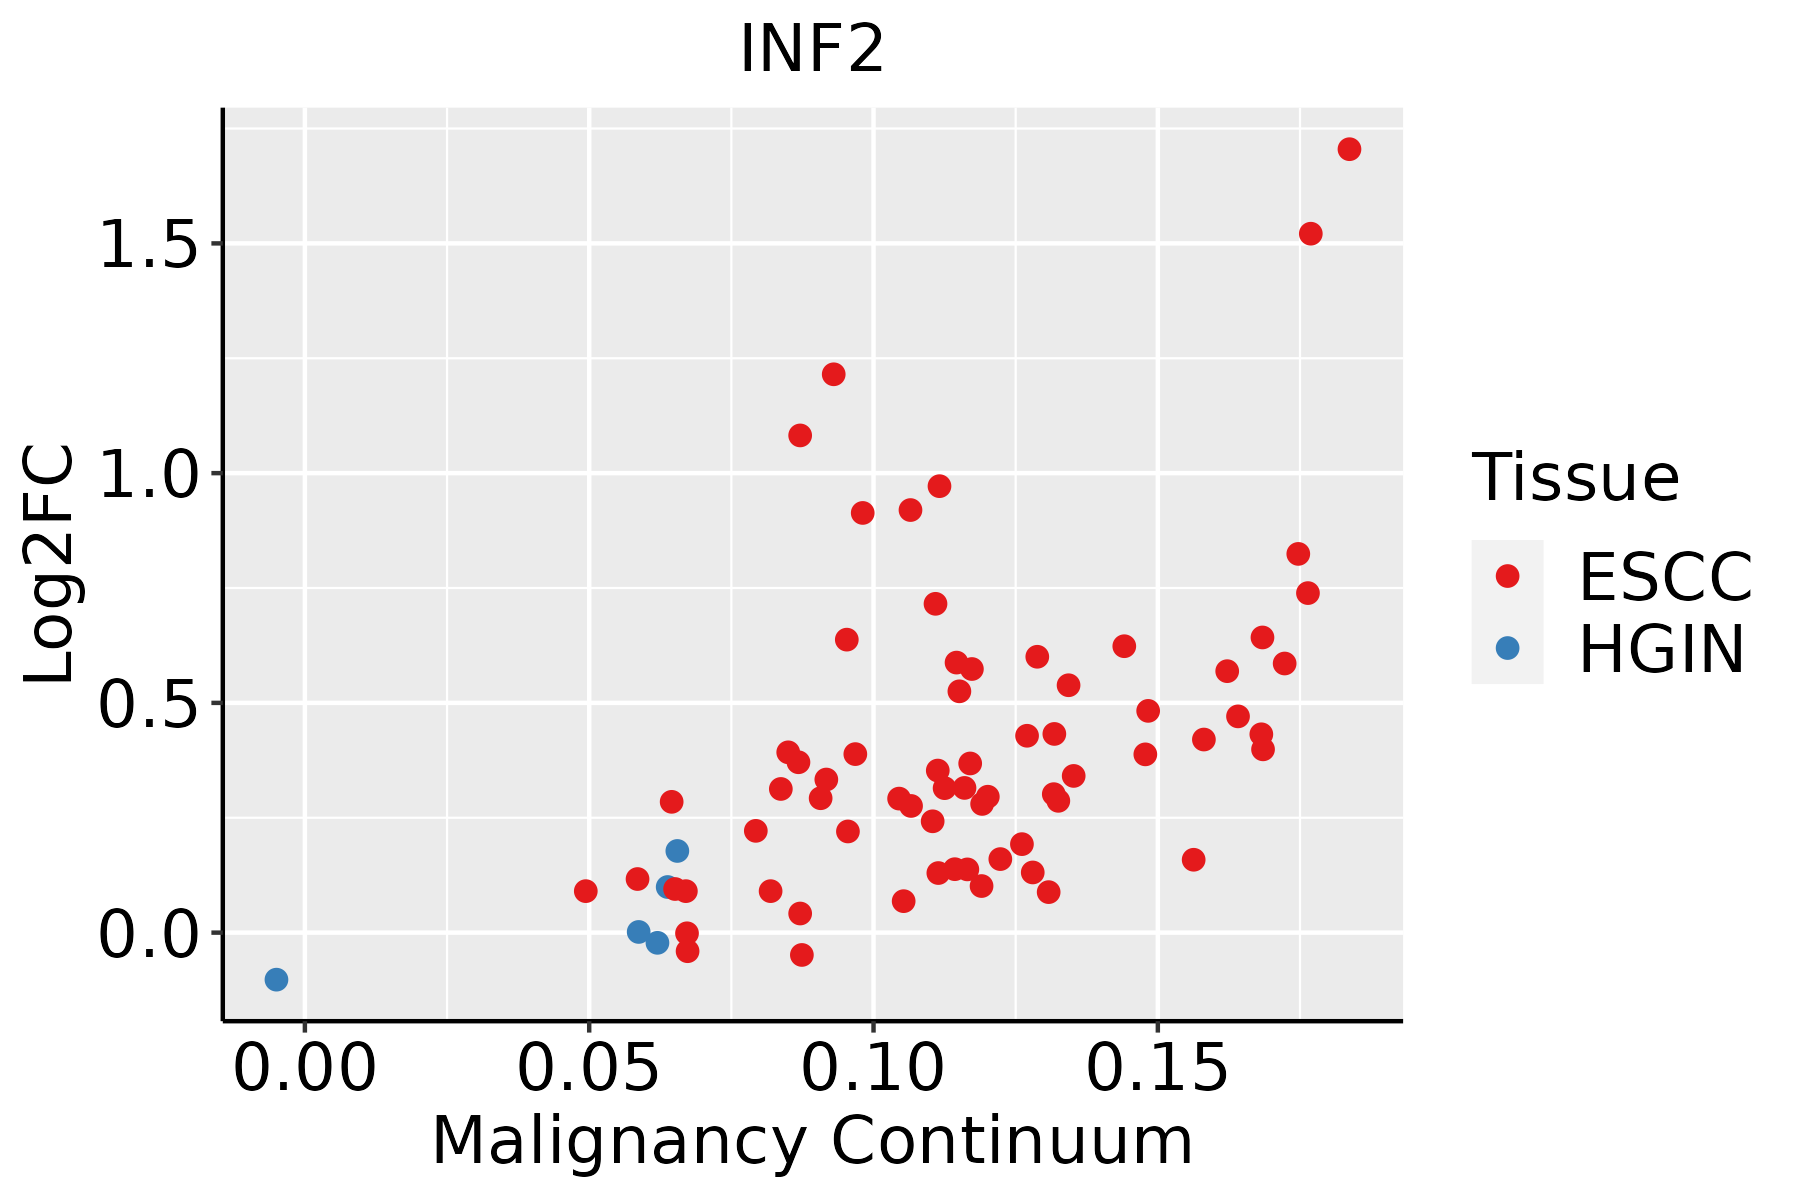 | ESCC: Esophageal squamous cell carcinoma |
| HGIN: High-grade intraepithelial neoplasias | ||
| LGIN: Low-grade intraepithelial neoplasias | ||
| GC |  | CAG: Chronic atrophic gastritis |
| CAG with IM: Chronic atrophic gastritis with intestinal metaplasia | ||
| CSG: Chronic superficial gastritis | ||
| GC: Gastric cancer | ||
| SIM: Severe intestinal metaplasia | ||
| WIM: Wild intestinal metaplasia | ||
| Liver | 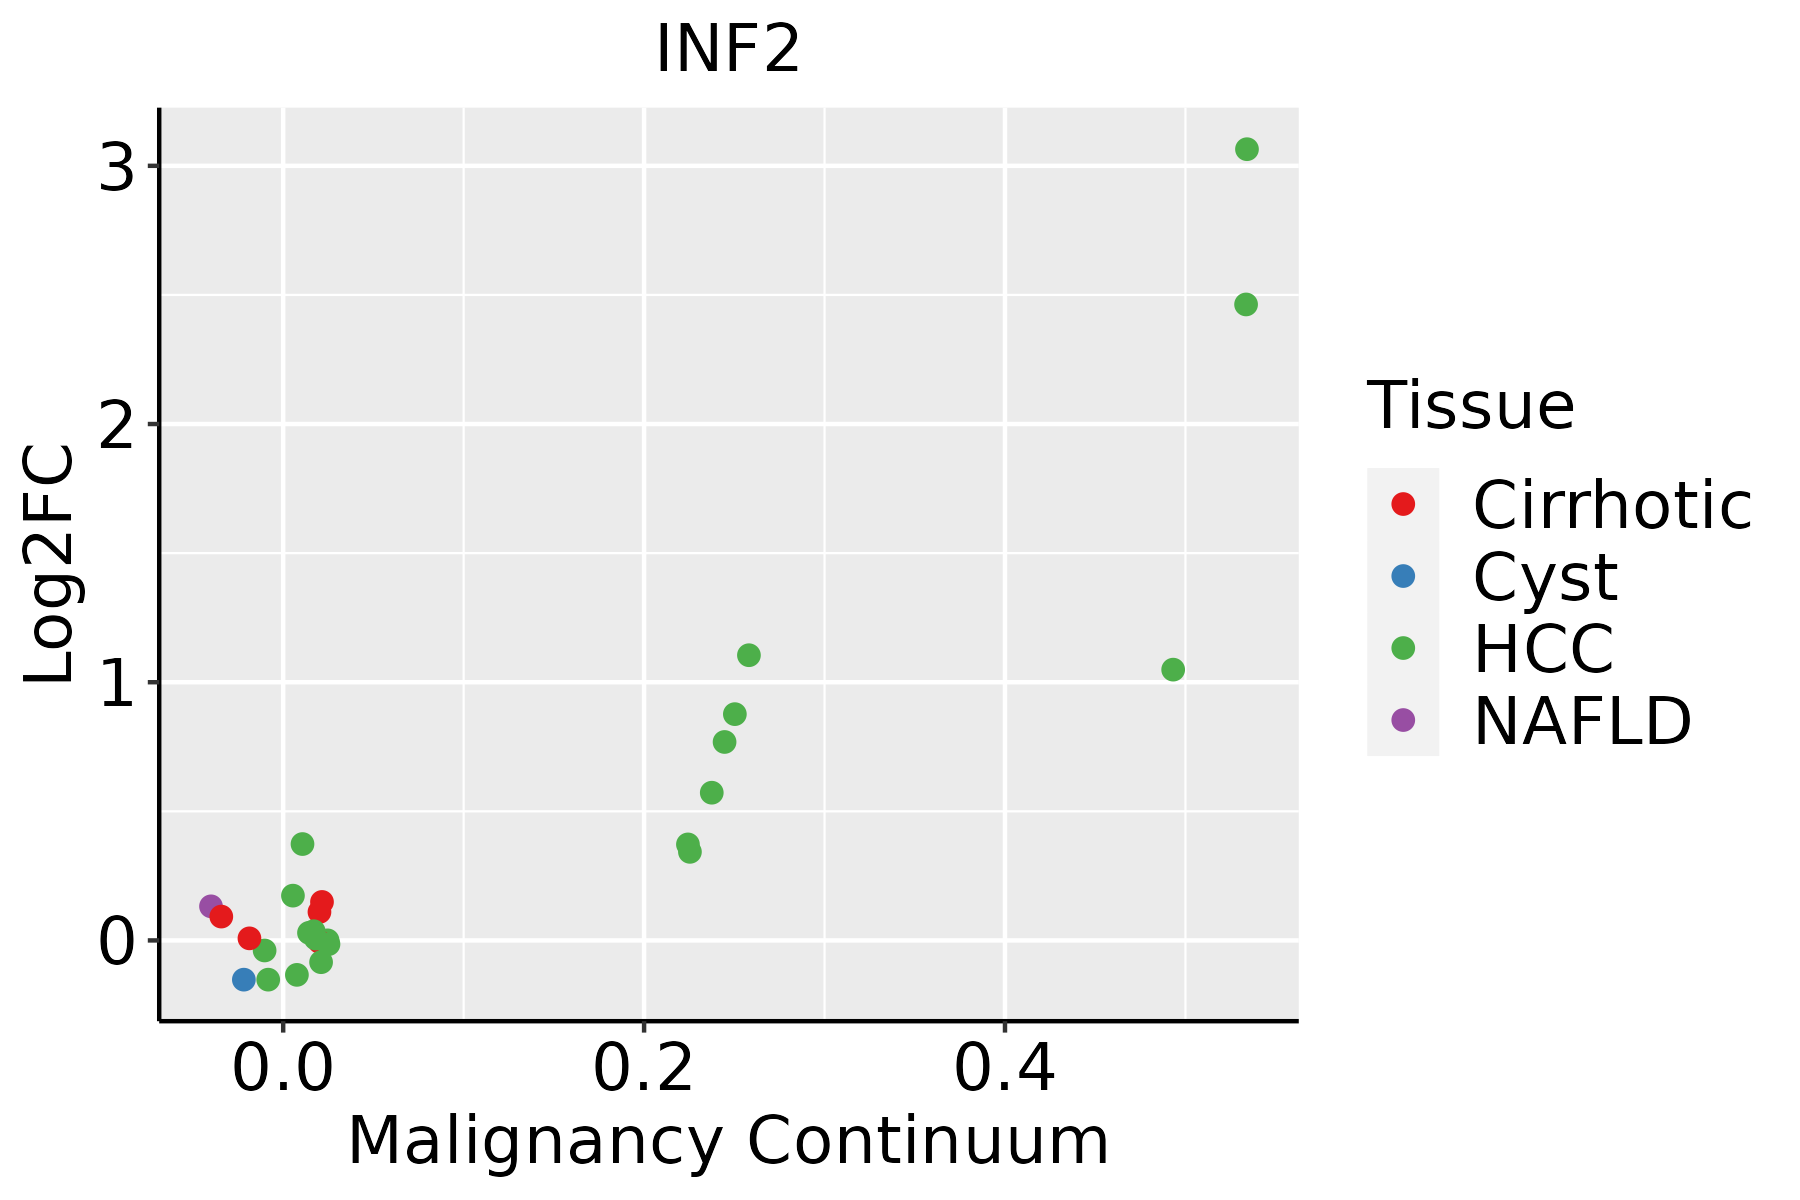 | HCC: Hepatocellular carcinoma |
| NAFLD: Non-alcoholic fatty liver disease | ||
| Oral Cavity | 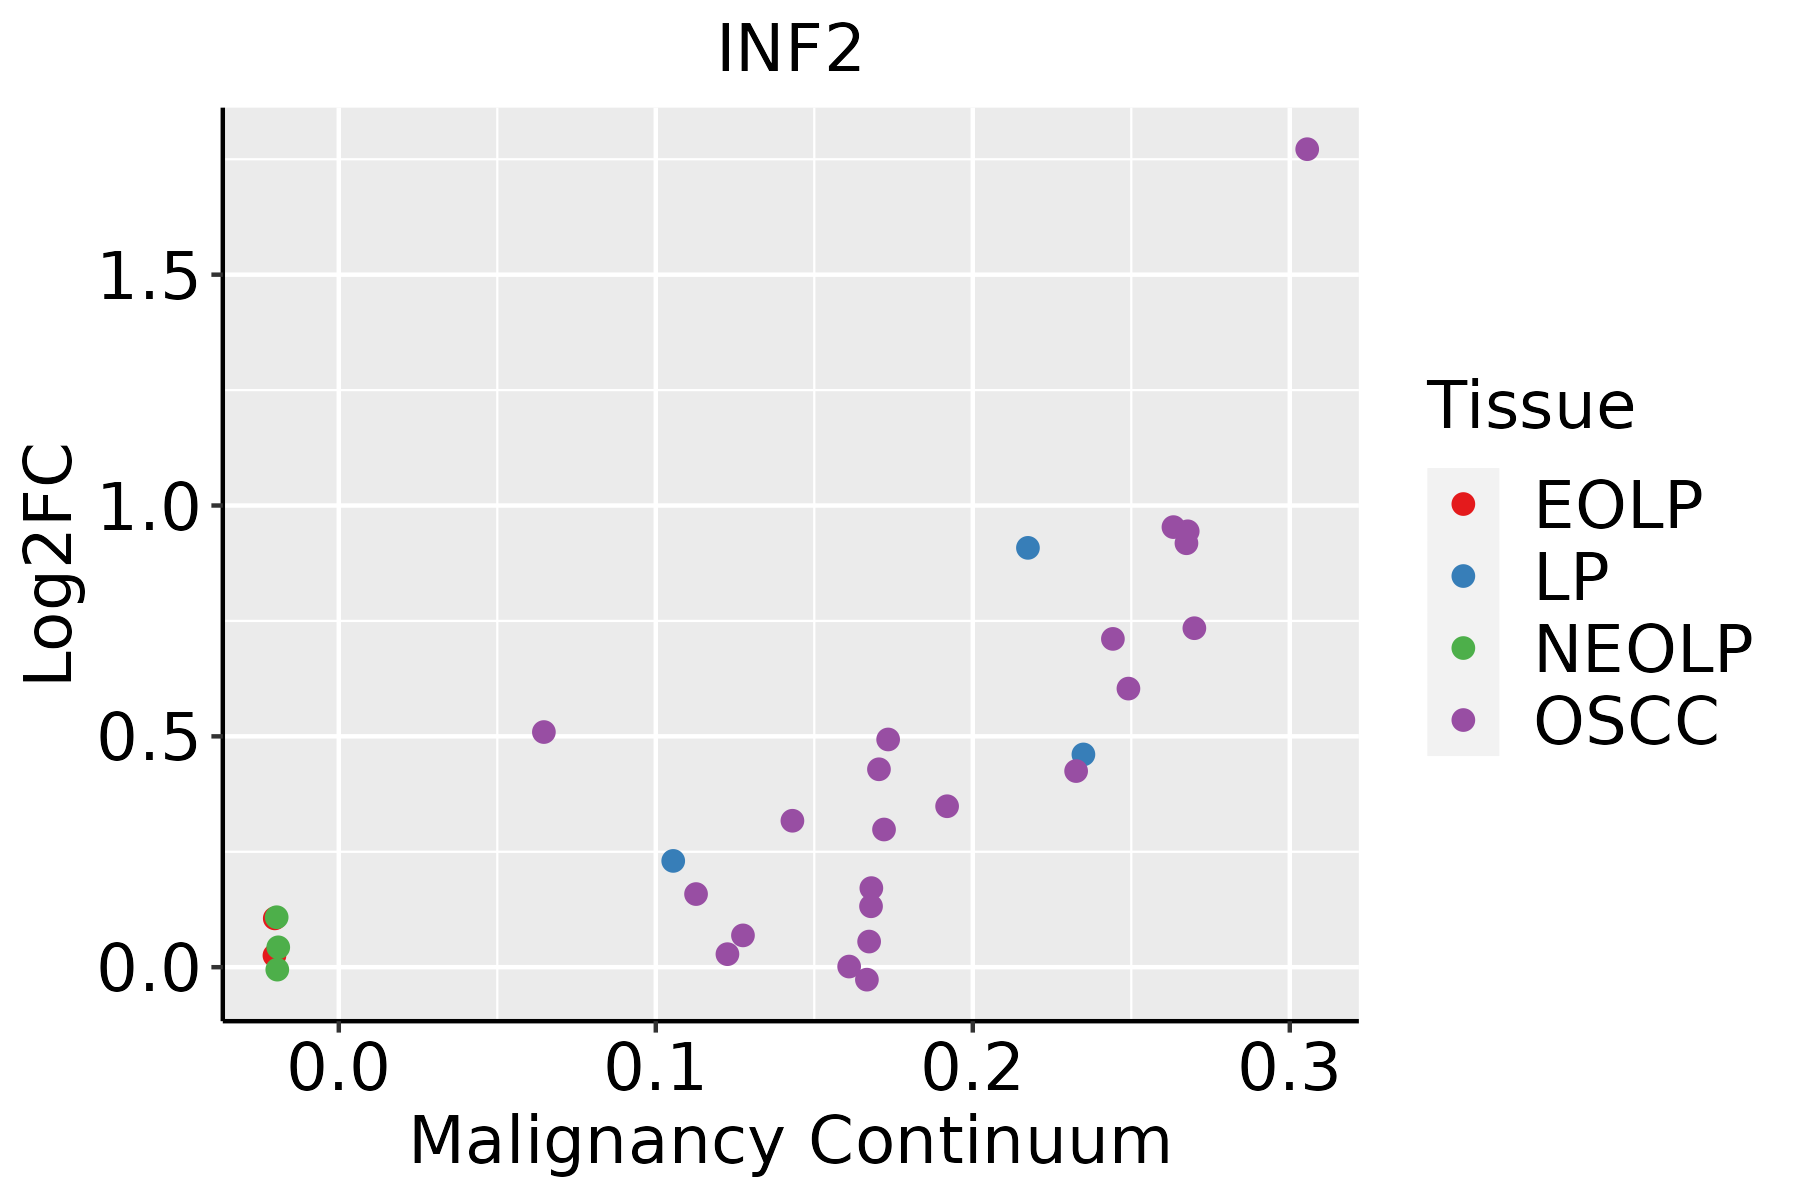 | EOLP: Erosive Oral lichen planus |
| LP: leukoplakia | ||
| NEOLP: Non-erosive oral lichen planus | ||
| OSCC: Oral squamous cell carcinoma | ||
| Skin | 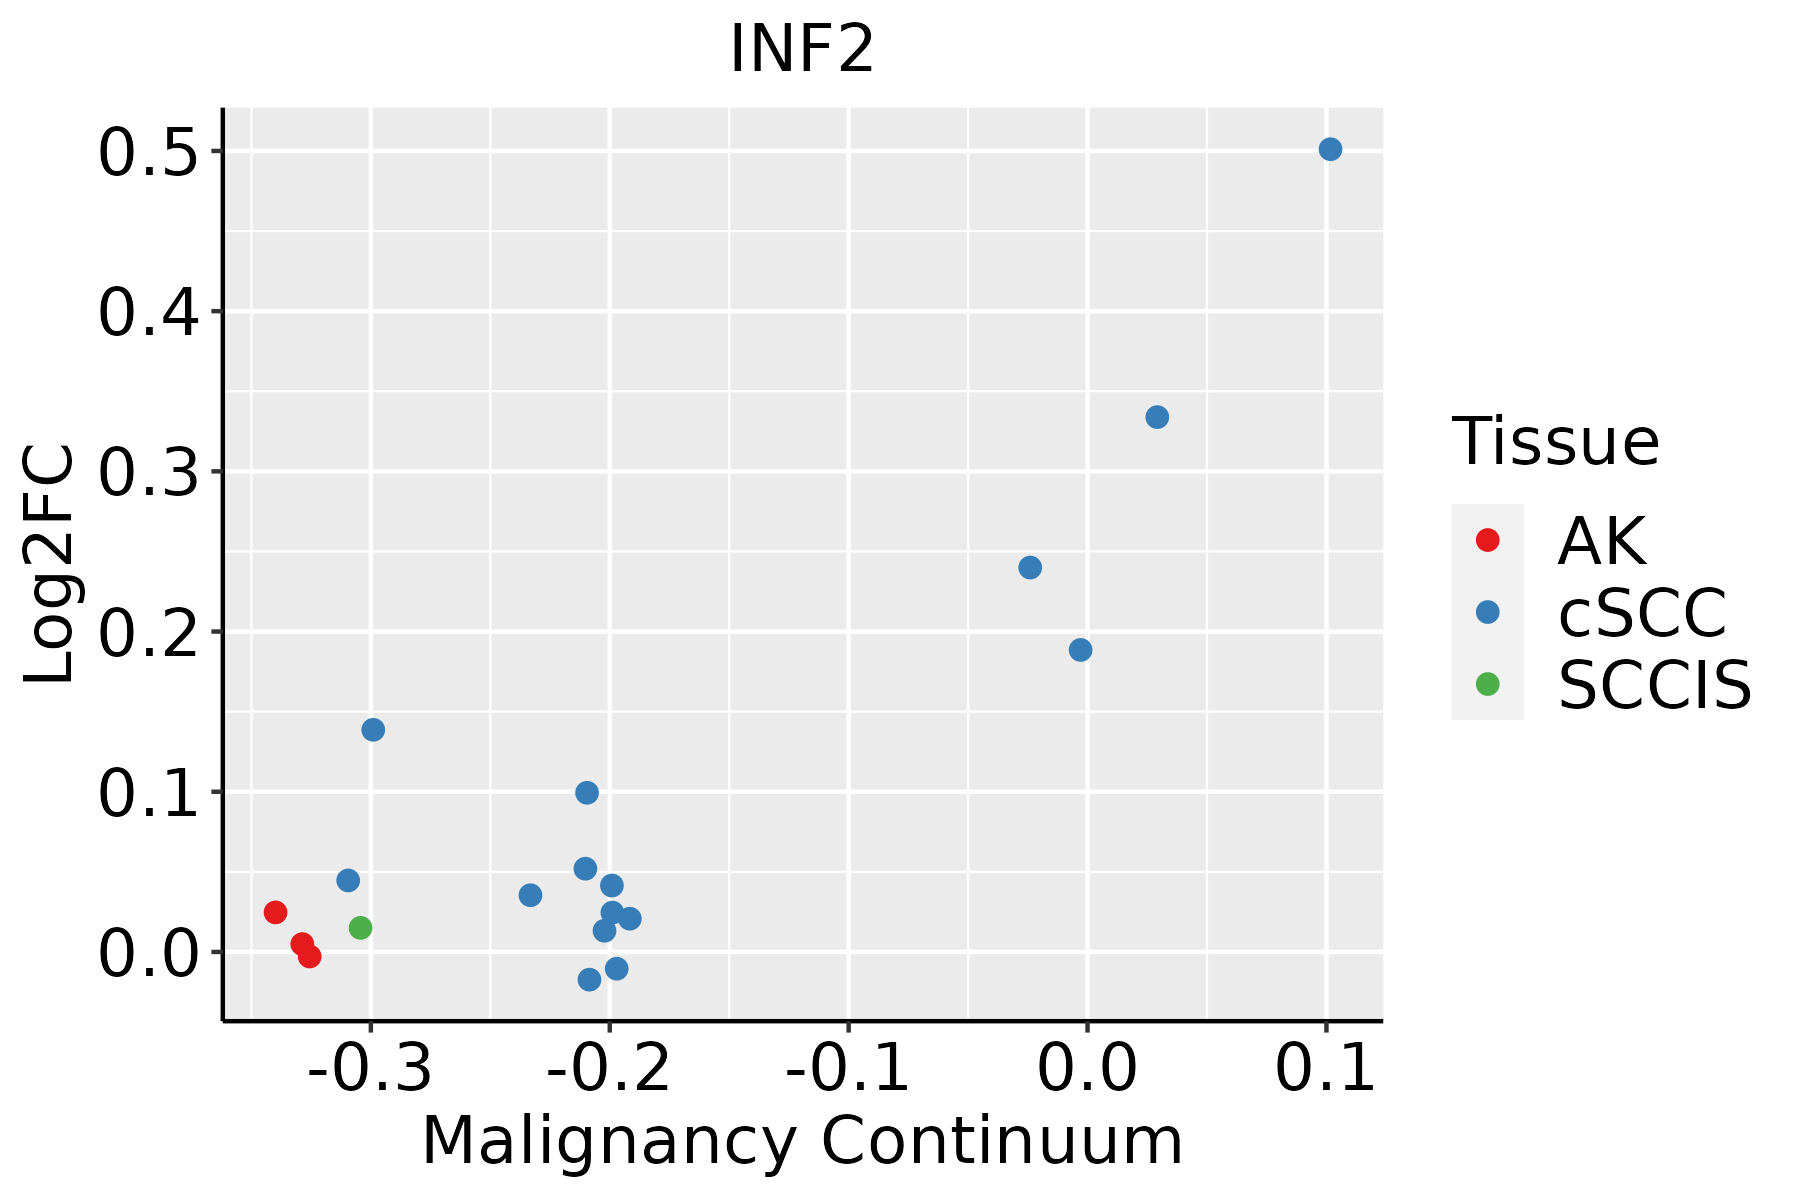 | AK: Actinic keratosis |
| cSCC: Cutaneous squamous cell carcinoma | ||
| SCCIS:squamous cell carcinoma in situ | ||
| Thyroid | 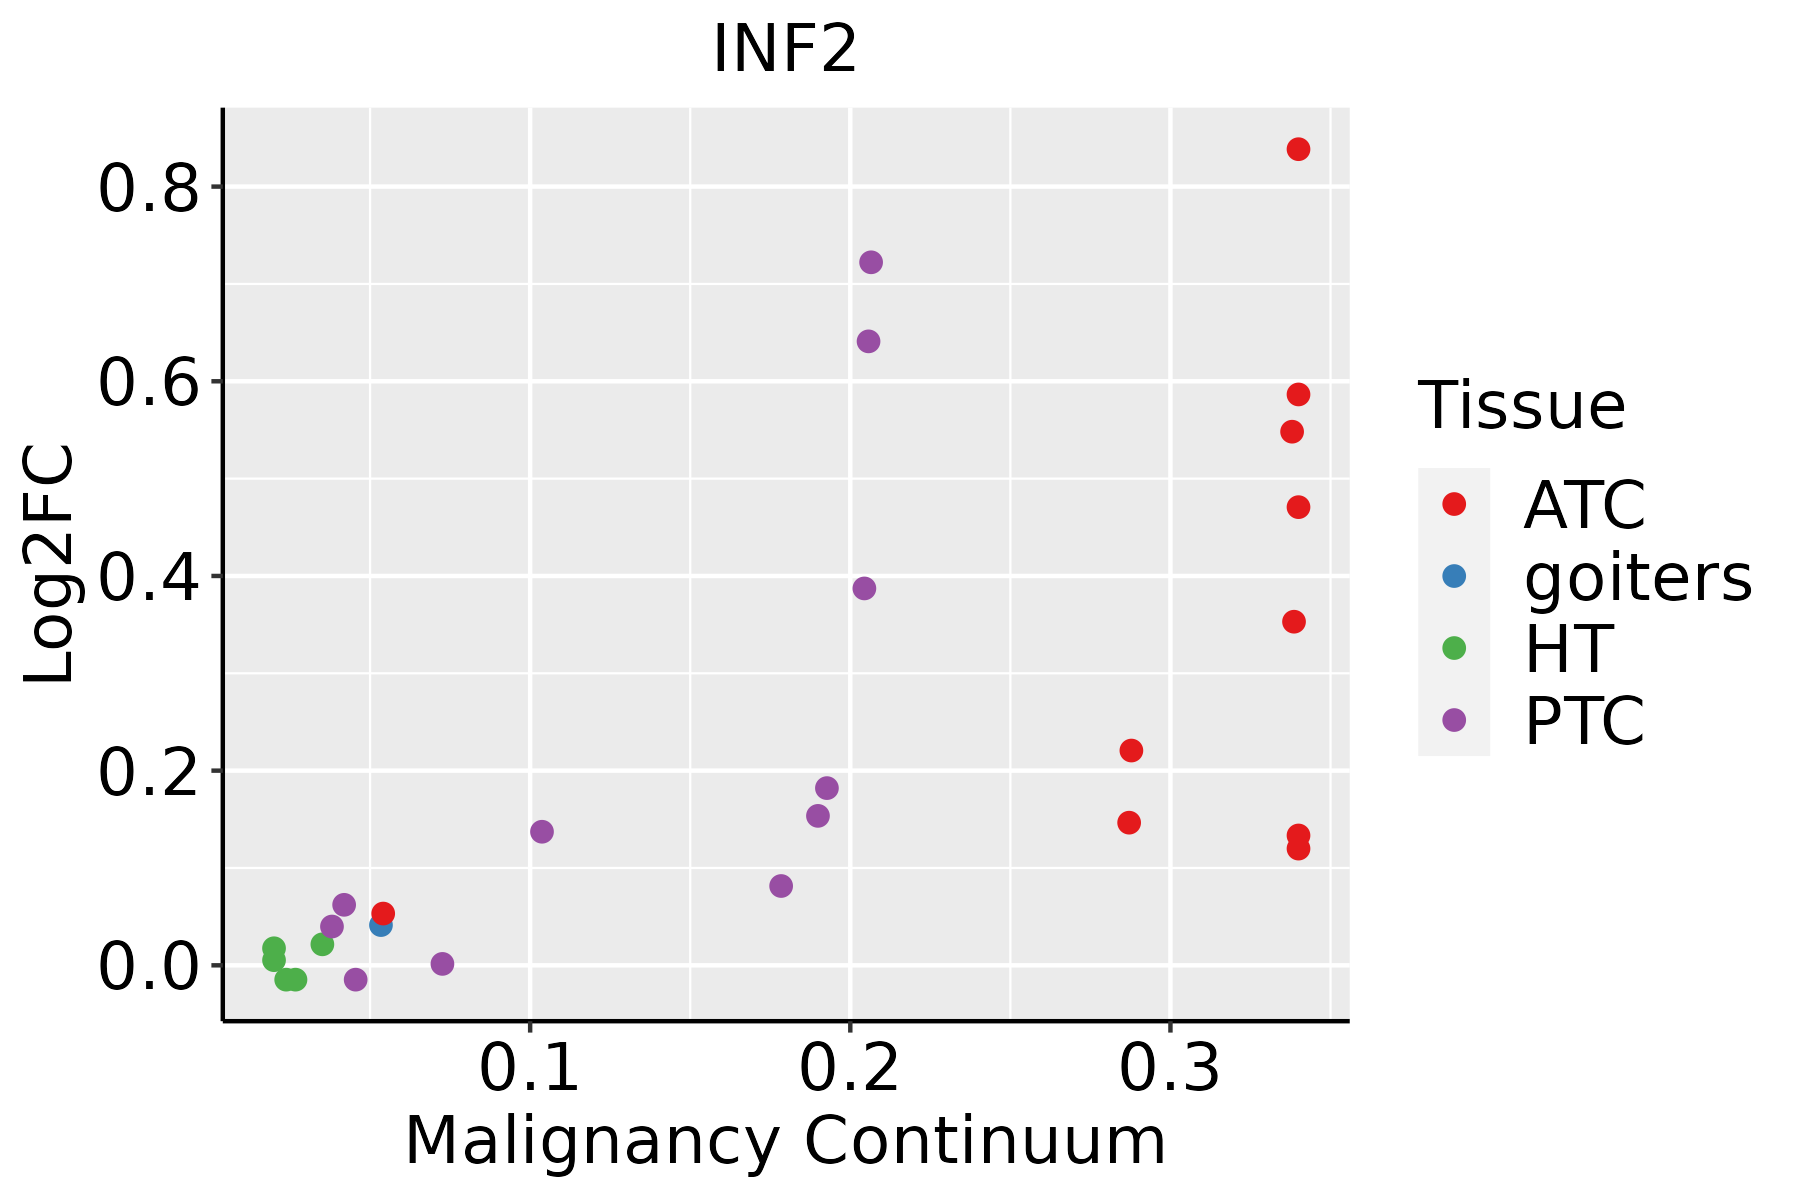 | ATC: Anaplastic thyroid cancer |
| HT: Hashimoto's thyroiditis | ||
| PTC: Papillary thyroid cancer |
| ∗log2FC in expression of this searched gene in stem-like cells from each diseased tissue sample relative to stem-like cells in normal samples in each tissue plotted against the malignancy continuum. Samples are colored based on if they are from different disease stage. |
Top |
Malignant transformation related pathway analysis |
| Find out the enriched GO biological processes and KEGG pathways involved in transition from healthy to precancer to cancer |
| Tissue | Disease Stage | Enriched GO biological Processes |
| Colorectum | AD |  |
| Colorectum | SER |  |
| Colorectum | MSS |  |
| Colorectum | MSI-H |  |
| Colorectum | FAP |  |
| ∗Top 15 enriched GO BP terms are showed in the bar plot of each disease state in each tissue. Each row represents a significant GO biological process which is colored according to the -log10(p.adjust). |
| Page: 1 2 3 4 5 6 7 8 9 |
| GO ID | Tissue | Disease Stage | Description | Gene Ratio | Bg Ratio | pvalue | p.adjust | Count |
| GO:003304416 | Esophagus | ESCC | regulation of chromosome organization | 145/8552 | 187/18723 | 3.80e-19 | 4.31e-17 | 145 |
| GO:005105215 | Esophagus | ESCC | regulation of DNA metabolic process | 232/8552 | 359/18723 | 2.40e-13 | 1.13e-11 | 232 |
| GO:00482853 | Esophagus | ESCC | organelle fission | 301/8552 | 488/18723 | 4.64e-13 | 2.12e-11 | 301 |
| GO:0010821110 | Esophagus | ESCC | regulation of mitochondrion organization | 107/8552 | 144/18723 | 2.31e-12 | 9.41e-11 | 107 |
| GO:000072319 | Esophagus | ESCC | telomere maintenance | 99/8552 | 131/18723 | 2.68e-12 | 1.08e-10 | 99 |
| GO:007189716 | Esophagus | ESCC | DNA biosynthetic process | 127/8552 | 180/18723 | 1.04e-11 | 3.85e-10 | 127 |
| GO:1902905111 | Esophagus | ESCC | positive regulation of supramolecular fiber organization | 142/8552 | 209/18723 | 5.51e-11 | 1.76e-09 | 142 |
| GO:003220417 | Esophagus | ESCC | regulation of telomere maintenance | 65/8552 | 80/18723 | 6.02e-11 | 1.90e-09 | 65 |
| GO:005160418 | Esophagus | ESCC | protein maturation | 189/8552 | 294/18723 | 7.64e-11 | 2.39e-09 | 189 |
| GO:1902903111 | Esophagus | ESCC | regulation of supramolecular fiber organization | 237/8552 | 383/18723 | 9.06e-11 | 2.75e-09 | 237 |
| GO:2000278110 | Esophagus | ESCC | regulation of DNA biosynthetic process | 81/8552 | 106/18723 | 9.81e-11 | 2.96e-09 | 81 |
| GO:0052547111 | Esophagus | ESCC | regulation of peptidase activity | 275/8552 | 461/18723 | 7.54e-10 | 1.88e-08 | 275 |
| GO:0010639110 | Esophagus | ESCC | negative regulation of organelle organization | 215/8552 | 348/18723 | 8.20e-10 | 2.01e-08 | 215 |
| GO:000700418 | Esophagus | ESCC | telomere maintenance via telomerase | 56/8552 | 69/18723 | 1.40e-09 | 3.30e-08 | 56 |
| GO:003450211 | Esophagus | ESCC | protein localization to chromosome | 70/8552 | 92/18723 | 2.54e-09 | 5.64e-08 | 70 |
| GO:005149520 | Esophagus | ESCC | positive regulation of cytoskeleton organization | 147/8552 | 226/18723 | 2.93e-09 | 6.38e-08 | 147 |
| GO:000701527 | Esophagus | ESCC | actin filament organization | 259/8552 | 442/18723 | 2.37e-08 | 4.50e-07 | 259 |
| GO:0052548111 | Esophagus | ESCC | regulation of endopeptidase activity | 253/8552 | 432/18723 | 3.68e-08 | 6.78e-07 | 253 |
| GO:004578527 | Esophagus | ESCC | positive regulation of cell adhesion | 255/8552 | 437/18723 | 5.07e-08 | 9.11e-07 | 255 |
| GO:001083319 | Esophagus | ESCC | telomere maintenance via telomere lengthening | 61/8552 | 81/18723 | 5.24e-08 | 9.37e-07 | 61 |
| Page: 1 2 3 4 5 6 7 8 9 10 11 12 13 14 15 16 17 18 19 20 21 |
| Pathway ID | Tissue | Disease Stage | Description | Gene Ratio | Bg Ratio | pvalue | p.adjust | qvalue | Count |
| Page: 1 |
Top |
Cell-cell communication analysis |
| Identification of potential cell-cell interactions between two cell types and their ligand-receptor pairs for different disease states |
| Ligand | Receptor | LRpair | Pathway | Tissue | Disease Stage |
| Page: 1 |
Top |
Single-cell gene regulatory network inference analysis |
| Find out the significant the regulons (TFs) and the target genes of each regulon across cell types for different disease states |
| TF | Cell Type | Tissue | Disease Stage | Target Gene | RSS | Regulon Activity |
| ∗The dot plots of a searched regulon are shown for all cell subpopulations in each disease state of each tissue based on the regulon specific score inferred using pySCENIC and by calculating the average expression. |
| Page: 1 |
Top |
Somatic mutation of malignant transformation related genes |
| Annotation of somatic variants for genes involved in malignant transformation |
| Hugo Symbol | Variant Class | Variant Classification | dbSNP RS | HGVSc | HGVSp | HGVSp Short | SWISSPROT | BIOTYPE | SIFT | PolyPhen | Tumor Sample Barcode | Tissue | Histology | Sex | Age | Stage | Therapy Types | Drugs | Outcome |
| INF2 | SNV | Missense_Mutation | novel | c.2173N>A | p.Glu725Lys | p.E725K | Q27J81 | protein_coding | deleterious(0) | probably_damaging(0.999) | TCGA-C8-A8HQ-01 | Breast | breast invasive carcinoma | Female | <65 | I/II | Unknown | Unknown | SD |
| INF2 | SNV | Missense_Mutation | c.571G>A | p.Val191Met | p.V191M | Q27J81 | protein_coding | deleterious(0.01) | probably_damaging(0.975) | TCGA-D8-A1J8-01 | Breast | breast invasive carcinoma | Female | >=65 | I/II | Hormone Therapy | nolvadex | SD | |
| INF2 | SNV | Missense_Mutation | c.1960N>A | p.Glu654Lys | p.E654K | Q27J81 | protein_coding | deleterious(0) | possibly_damaging(0.871) | TCGA-D8-A1J9-01 | Breast | breast invasive carcinoma | Female | <65 | I/II | Unknown | Unknown | SD | |
| INF2 | deletion | Frame_Shift_Del | novel | c.2256delN | p.Gln753SerfsTer8 | p.Q753Sfs*8 | Q27J81 | protein_coding | TCGA-D8-A27V-01 | Breast | breast invasive carcinoma | Female | <65 | I/II | Hormone Therapy | tamoxiphen | SD | ||
| INF2 | SNV | Missense_Mutation | novel | c.3022N>T | p.Pro1008Ser | p.P1008S | Q27J81 | protein_coding | tolerated_low_confidence(0.2) | benign(0.001) | TCGA-DS-A5RQ-01 | Cervix | cervical & endocervical cancer | Female | >=65 | I/II | Chemotherapy | cisplatin | CR |
| INF2 | SNV | Missense_Mutation | c.2619N>G | p.Ile873Met | p.I873M | Q27J81 | protein_coding | deleterious(0.04) | possibly_damaging(0.5) | TCGA-JW-A5VL-01 | Cervix | cervical & endocervical cancer | Female | <65 | I/II | Unknown | Unknown | SD | |
| INF2 | SNV | Missense_Mutation | rs752180110 | c.2789N>A | p.Arg930Gln | p.R930Q | Q27J81 | protein_coding | deleterious(0) | possibly_damaging(0.806) | TCGA-A6-2679-01 | Colorectum | colon adenocarcinoma | Female | >=65 | I/II | Unknown | Unknown | SD |
| INF2 | SNV | Missense_Mutation | rs771072587 | c.2041N>A | p.Glu681Lys | p.E681K | Q27J81 | protein_coding | deleterious(0) | probably_damaging(0.996) | TCGA-AA-3984-01 | Colorectum | colon adenocarcinoma | Female | <65 | I/II | Unknown | Unknown | SD |
| INF2 | SNV | Missense_Mutation | c.2356N>A | p.Leu786Met | p.L786M | Q27J81 | protein_coding | deleterious(0) | probably_damaging(0.999) | TCGA-AM-5821-01 | Colorectum | colon adenocarcinoma | Female | >=65 | I/II | Unknown | Unknown | SD | |
| INF2 | SNV | Missense_Mutation | c.319G>A | p.Ala107Thr | p.A107T | Q27J81 | protein_coding | tolerated(0.07) | probably_damaging(0.975) | TCGA-AZ-6601-01 | Colorectum | colon adenocarcinoma | Male | >=65 | I/II | Unknown | Unknown | PD |
| Page: 1 2 3 4 5 6 7 8 |
Top |
Related drugs of malignant transformation related genes |
| Identification of chemicals and drugs interact with genes involved in malignant transfromation |
| (DGIdb 4.0) |
| Entrez ID | Symbol | Category | Interaction Types | Drug Claim Name | Drug Name | PMIDs |
| Page: 1 |

Copyright 2023-Present -The University of Texas Health Science Center at Houston |