
|
|||||
|
 | |
| |
| |
| |
| |
| |
|
Gene: INCENP |
Gene summary for INCENP |
| Gene information | Species | Human | Gene symbol | INCENP | Gene ID | 3619 |
| Gene name | inner centromere protein | |
| Gene Alias | INCENP | |
| Cytomap | 11q12.3 | |
| Gene Type | protein-coding | GO ID | GO:0000003 | UniProtAcc | Q9NQS7 |
Top |
Malignant transformation analysis |
| Identification of the aberrant gene expression in precancerous and cancerous lesions by comparing the gene expression of stem-like cells in diseased tissues with normal stem cells |
| Entrez ID | Symbol | Replicates | Species | Organ | Tissue | Adj P-value | Log2FC | Malignancy |
| 3619 | INCENP | LZE24T | Human | Esophagus | ESCC | 2.65e-05 | 1.55e-01 | 0.0596 |
| 3619 | INCENP | P2T-E | Human | Esophagus | ESCC | 4.31e-06 | 2.07e-01 | 0.1177 |
| 3619 | INCENP | P4T-E | Human | Esophagus | ESCC | 7.93e-07 | 1.75e-01 | 0.1323 |
| 3619 | INCENP | P5T-E | Human | Esophagus | ESCC | 2.02e-06 | 1.45e-01 | 0.1327 |
| 3619 | INCENP | P8T-E | Human | Esophagus | ESCC | 8.56e-12 | 2.20e-01 | 0.0889 |
| 3619 | INCENP | P9T-E | Human | Esophagus | ESCC | 2.30e-02 | 1.34e-01 | 0.1131 |
| 3619 | INCENP | P10T-E | Human | Esophagus | ESCC | 3.75e-03 | 1.04e-01 | 0.116 |
| 3619 | INCENP | P11T-E | Human | Esophagus | ESCC | 4.74e-03 | 1.45e-01 | 0.1426 |
| 3619 | INCENP | P17T-E | Human | Esophagus | ESCC | 2.68e-03 | 2.21e-01 | 0.1278 |
| 3619 | INCENP | P21T-E | Human | Esophagus | ESCC | 1.88e-11 | 2.61e-01 | 0.1617 |
| 3619 | INCENP | P23T-E | Human | Esophagus | ESCC | 3.36e-03 | 1.25e-01 | 0.108 |
| 3619 | INCENP | P24T-E | Human | Esophagus | ESCC | 8.40e-04 | 1.38e-01 | 0.1287 |
| 3619 | INCENP | P26T-E | Human | Esophagus | ESCC | 3.50e-02 | 7.71e-02 | 0.1276 |
| 3619 | INCENP | P27T-E | Human | Esophagus | ESCC | 8.40e-04 | 1.28e-01 | 0.1055 |
| 3619 | INCENP | P28T-E | Human | Esophagus | ESCC | 4.24e-18 | 3.15e-01 | 0.1149 |
| 3619 | INCENP | P30T-E | Human | Esophagus | ESCC | 2.13e-03 | 1.60e-01 | 0.137 |
| 3619 | INCENP | P31T-E | Human | Esophagus | ESCC | 2.02e-06 | 1.34e-01 | 0.1251 |
| 3619 | INCENP | P32T-E | Human | Esophagus | ESCC | 1.96e-05 | 1.56e-01 | 0.1666 |
| 3619 | INCENP | P36T-E | Human | Esophagus | ESCC | 7.91e-07 | 2.35e-01 | 0.1187 |
| 3619 | INCENP | P37T-E | Human | Esophagus | ESCC | 4.27e-06 | 2.12e-01 | 0.1371 |
| Page: 1 2 3 |
| Tissue | Expression Dynamics | Abbreviation |
| Esophagus | 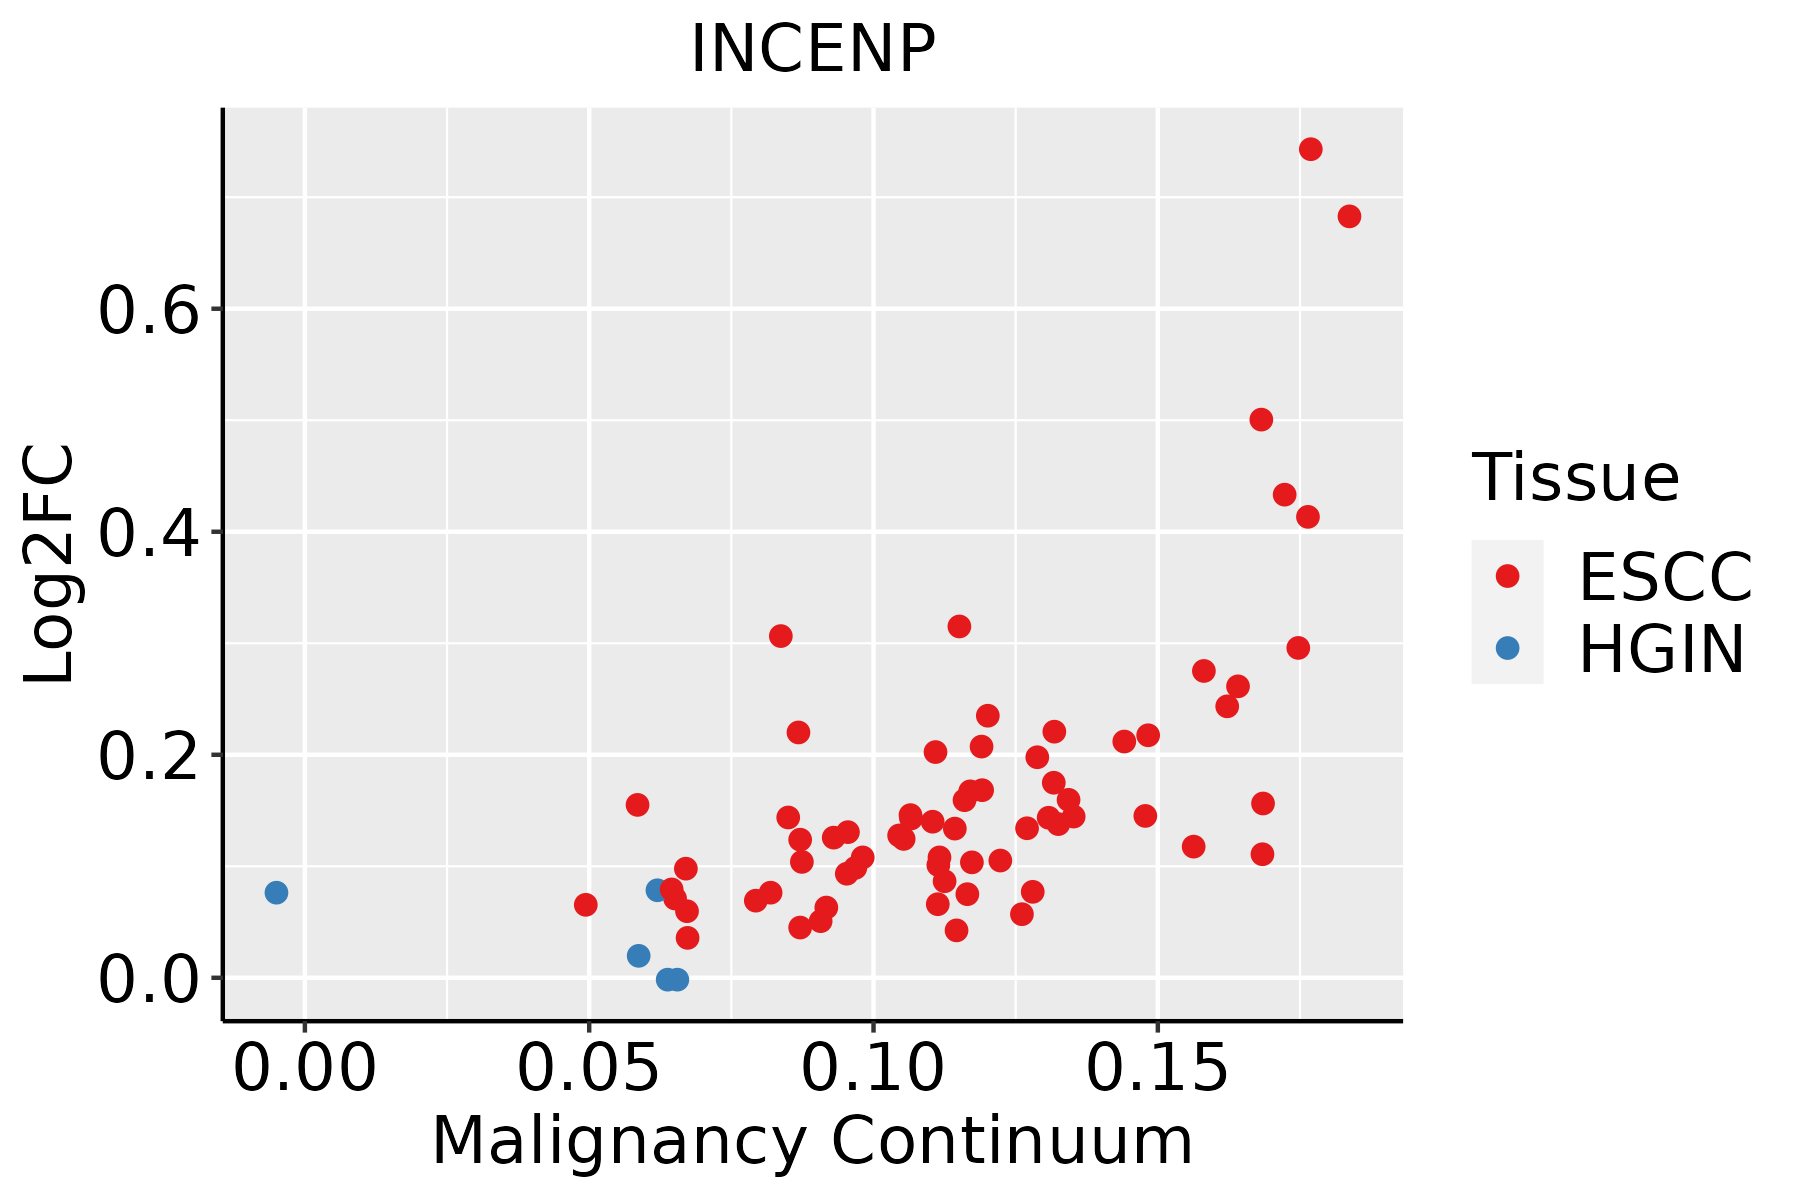 | ESCC: Esophageal squamous cell carcinoma |
| HGIN: High-grade intraepithelial neoplasias | ||
| LGIN: Low-grade intraepithelial neoplasias |
| ∗log2FC in expression of this searched gene in stem-like cells from each diseased tissue sample relative to stem-like cells in normal samples in each tissue plotted against the malignancy continuum. Samples are colored based on if they are from different disease stage. |
Top |
Malignant transformation related pathway analysis |
| Find out the enriched GO biological processes and KEGG pathways involved in transition from healthy to precancer to cancer |
| Tissue | Disease Stage | Enriched GO biological Processes |
| Colorectum | AD |  |
| Colorectum | SER |  |
| Colorectum | MSS |  |
| Colorectum | MSI-H |  |
| Colorectum | FAP |  |
| ∗Top 15 enriched GO BP terms are showed in the bar plot of each disease state in each tissue. Each row represents a significant GO biological process which is colored according to the -log10(p.adjust). |
| Page: 1 2 3 4 5 6 7 8 9 |
| GO ID | Tissue | Disease Stage | Description | Gene Ratio | Bg Ratio | pvalue | p.adjust | Count |
| GO:001657015 | Esophagus | ESCC | histone modification | 323/8552 | 463/18723 | 2.61e-26 | 7.88e-24 | 323 |
| GO:014001414 | Esophagus | ESCC | mitotic nuclear division | 218/8552 | 287/18723 | 6.17e-26 | 1.78e-23 | 218 |
| GO:005165617 | Esophagus | ESCC | establishment of organelle localization | 273/8552 | 390/18723 | 9.13e-23 | 1.81e-20 | 273 |
| GO:000007011 | Esophagus | ESCC | mitotic sister chromatid segregation | 138/8552 | 168/18723 | 1.37e-22 | 2.63e-20 | 138 |
| GO:00008194 | Esophagus | ESCC | sister chromatid segregation | 157/8552 | 202/18723 | 8.41e-21 | 1.33e-18 | 157 |
| GO:000705911 | Esophagus | ESCC | chromosome segregation | 238/8552 | 346/18723 | 1.72e-18 | 1.82e-16 | 238 |
| GO:000705114 | Esophagus | ESCC | spindle organization | 134/8552 | 184/18723 | 5.70e-14 | 2.87e-12 | 134 |
| GO:005131011 | Esophagus | ESCC | metaphase plate congression | 58/8552 | 65/18723 | 1.81e-13 | 8.63e-12 | 58 |
| GO:00482853 | Esophagus | ESCC | organelle fission | 301/8552 | 488/18723 | 4.64e-13 | 2.12e-11 | 301 |
| GO:00988133 | Esophagus | ESCC | nuclear chromosome segregation | 187/8552 | 281/18723 | 1.00e-12 | 4.36e-11 | 187 |
| GO:005130311 | Esophagus | ESCC | establishment of chromosome localization | 67/8552 | 80/18723 | 1.92e-12 | 8.09e-11 | 67 |
| GO:005000011 | Esophagus | ESCC | chromosome localization | 68/8552 | 82/18723 | 3.37e-12 | 1.32e-10 | 68 |
| GO:007190016 | Esophagus | ESCC | regulation of protein serine/threonine kinase activity | 227/8552 | 359/18723 | 1.12e-11 | 4.10e-10 | 227 |
| GO:00002802 | Esophagus | ESCC | nuclear division | 270/8552 | 439/18723 | 1.17e-11 | 4.24e-10 | 270 |
| GO:000028115 | Esophagus | ESCC | mitotic cytokinesis | 58/8552 | 71/18723 | 4.34e-10 | 1.15e-08 | 58 |
| GO:00512256 | Esophagus | ESCC | spindle assembly | 85/8552 | 117/18723 | 2.72e-09 | 5.98e-08 | 85 |
| GO:000091016 | Esophagus | ESCC | cytokinesis | 115/8552 | 173/18723 | 2.48e-08 | 4.68e-07 | 115 |
| GO:006164015 | Esophagus | ESCC | cytoskeleton-dependent cytokinesis | 72/8552 | 100/18723 | 8.10e-08 | 1.39e-06 | 72 |
| GO:00719029 | Esophagus | ESCC | positive regulation of protein serine/threonine kinase activity | 124/8552 | 200/18723 | 2.27e-06 | 2.61e-05 | 124 |
| GO:004586018 | Esophagus | ESCC | positive regulation of protein kinase activity | 219/8552 | 386/18723 | 6.91e-06 | 6.97e-05 | 219 |
| Page: 1 2 |
| Pathway ID | Tissue | Disease Stage | Description | Gene Ratio | Bg Ratio | pvalue | p.adjust | qvalue | Count |
| Page: 1 |
Top |
Cell-cell communication analysis |
| Identification of potential cell-cell interactions between two cell types and their ligand-receptor pairs for different disease states |
| Ligand | Receptor | LRpair | Pathway | Tissue | Disease Stage |
| Page: 1 |
Top |
Single-cell gene regulatory network inference analysis |
| Find out the significant the regulons (TFs) and the target genes of each regulon across cell types for different disease states |
| TF | Cell Type | Tissue | Disease Stage | Target Gene | RSS | Regulon Activity |
| ∗The dot plots of a searched regulon are shown for all cell subpopulations in each disease state of each tissue based on the regulon specific score inferred using pySCENIC and by calculating the average expression. |
| Page: 1 |
Top |
Somatic mutation of malignant transformation related genes |
| Annotation of somatic variants for genes involved in malignant transformation |
| Hugo Symbol | Variant Class | Variant Classification | dbSNP RS | HGVSc | HGVSp | HGVSp Short | SWISSPROT | BIOTYPE | SIFT | PolyPhen | Tumor Sample Barcode | Tissue | Histology | Sex | Age | Stage | Therapy Types | Drugs | Outcome |
| INCENP | SNV | Missense_Mutation | rs780988487 | c.2540N>A | p.Arg847Gln | p.R847Q | Q9NQS7 | protein_coding | tolerated(0.15) | possibly_damaging(0.895) | TCGA-5L-AAT1-01 | Breast | breast invasive carcinoma | Female | <65 | III/IV | Hormone Therapy | letrozol | SD |
| INCENP | SNV | Missense_Mutation | c.511A>G | p.Ile171Val | p.I171V | Q9NQS7 | protein_coding | tolerated(0.2) | benign(0.012) | TCGA-A8-A094-01 | Breast | breast invasive carcinoma | Female | >=65 | I/II | Unknown | Unknown | SD | |
| INCENP | SNV | Missense_Mutation | c.1442C>T | p.Ser481Leu | p.S481L | Q9NQS7 | protein_coding | deleterious(0) | benign(0) | TCGA-A8-A0A7-01 | Breast | breast invasive carcinoma | Female | <65 | I/II | Unknown | Unknown | SD | |
| INCENP | SNV | Missense_Mutation | c.1391N>G | p.Gln464Arg | p.Q464R | Q9NQS7 | protein_coding | deleterious(0.03) | benign(0.038) | TCGA-AO-A128-01 | Breast | breast invasive carcinoma | Female | <65 | I/II | Chemotherapy | doxorubicin | SD | |
| INCENP | SNV | Missense_Mutation | c.901N>G | p.Gln301Glu | p.Q301E | Q9NQS7 | protein_coding | deleterious(0.02) | benign(0.011) | TCGA-D8-A1JN-01 | Breast | breast invasive carcinoma | Female | >=65 | III/IV | Hormone Therapy | anastrozolum | SD | |
| INCENP | insertion | Frame_Shift_Ins | novel | c.1789_1790insTCAACTATTATGAAATAGTTGATATACACAATAGAATATATGT | p.Lys597IlefsTer18 | p.K597Ifs*18 | Q9NQS7 | protein_coding | TCGA-B6-A0I8-01 | Breast | breast invasive carcinoma | Female | <65 | I/II | Unknown | Unknown | PD | ||
| INCENP | insertion | Nonsense_Mutation | novel | c.1328_1329insGGGGGTAGCCAGGCCCTGGCATCTGTAGATTTGTATTTTTAGT | p.Pro444GlyfsTer9 | p.P444Gfs*9 | Q9NQS7 | protein_coding | TCGA-B6-A0RE-01 | Breast | breast invasive carcinoma | Female | <65 | I/II | Unknown | Unknown | SD | ||
| INCENP | deletion | Frame_Shift_Del | c.1132delN | p.Glu380ArgfsTer78 | p.E380Rfs*78 | Q9NQS7 | protein_coding | TCGA-BH-A18G-01 | Breast | breast invasive carcinoma | Female | >=65 | I/II | Unknown | Unknown | SD | |||
| INCENP | insertion | In_Frame_Ins | novel | c.2061_2062insGAGCGG | p.Gln687_Arg688insGluArg | p.Q687_R688insER | Q9NQS7 | protein_coding | TCGA-E2-A576-01 | Breast | breast invasive carcinoma | Female | >=65 | I/II | Chemotherapy | taxotere | SD | ||
| INCENP | SNV | Missense_Mutation | rs770503094 | c.1384G>A | p.Glu462Lys | p.E462K | Q9NQS7 | protein_coding | deleterious(0.01) | benign(0.34) | TCGA-C5-A8XK-01 | Cervix | cervical & endocervical cancer | Female | <65 | I/II | Chemotherapy | cisplatin | SD |
| Page: 1 2 3 4 5 6 7 8 9 |
Top |
Related drugs of malignant transformation related genes |
| Identification of chemicals and drugs interact with genes involved in malignant transfromation |
| (DGIdb 4.0) |
| Entrez ID | Symbol | Category | Interaction Types | Drug Claim Name | Drug Name | PMIDs |
| Page: 1 |

Copyright 2023-Present -The University of Texas Health Science Center at Houston |