
|
|||||
|
 | |
| |
| |
| |
| |
| |
|
Gene: IMPDH2 |
Gene summary for IMPDH2 |
| Gene information | Species | Human | Gene symbol | IMPDH2 | Gene ID | 3615 |
| Gene name | inosine monophosphate dehydrogenase 2 | |
| Gene Alias | IMPD2 | |
| Cytomap | 3p21.31 | |
| Gene Type | protein-coding | GO ID | GO:0001654 | UniProtAcc | P12268 |
Top |
Malignant transformation analysis |
| Identification of the aberrant gene expression in precancerous and cancerous lesions by comparing the gene expression of stem-like cells in diseased tissues with normal stem cells |
| Entrez ID | Symbol | Replicates | Species | Organ | Tissue | Adj P-value | Log2FC | Malignancy |
| 3615 | IMPDH2 | HTA11_3410_2000001011 | Human | Colorectum | AD | 1.02e-30 | 6.88e-01 | 0.0155 |
| 3615 | IMPDH2 | HTA11_2487_2000001011 | Human | Colorectum | SER | 4.46e-09 | 6.43e-01 | -0.1808 |
| 3615 | IMPDH2 | HTA11_2951_2000001011 | Human | Colorectum | AD | 1.37e-10 | 9.75e-01 | 0.0216 |
| 3615 | IMPDH2 | HTA11_1938_2000001011 | Human | Colorectum | AD | 1.40e-20 | 8.26e-01 | -0.0811 |
| 3615 | IMPDH2 | HTA11_78_2000001011 | Human | Colorectum | AD | 1.49e-18 | 7.23e-01 | -0.1088 |
| 3615 | IMPDH2 | HTA11_347_2000001011 | Human | Colorectum | AD | 8.22e-27 | 6.57e-01 | -0.1954 |
| 3615 | IMPDH2 | HTA11_411_2000001011 | Human | Colorectum | SER | 3.51e-06 | 8.61e-01 | -0.2602 |
| 3615 | IMPDH2 | HTA11_3361_2000001011 | Human | Colorectum | AD | 5.10e-12 | 7.81e-01 | -0.1207 |
| 3615 | IMPDH2 | HTA11_83_2000001011 | Human | Colorectum | SER | 2.73e-09 | 5.94e-01 | -0.1526 |
| 3615 | IMPDH2 | HTA11_696_2000001011 | Human | Colorectum | AD | 9.61e-54 | 9.92e-01 | -0.1464 |
| 3615 | IMPDH2 | HTA11_866_2000001011 | Human | Colorectum | AD | 1.56e-29 | 6.10e-01 | -0.1001 |
| 3615 | IMPDH2 | HTA11_1391_2000001011 | Human | Colorectum | AD | 1.73e-45 | 1.35e+00 | -0.059 |
| 3615 | IMPDH2 | HTA11_2992_2000001011 | Human | Colorectum | SER | 6.44e-08 | 6.89e-01 | -0.1706 |
| 3615 | IMPDH2 | HTA11_5216_2000001011 | Human | Colorectum | SER | 1.44e-08 | 8.13e-01 | -0.1462 |
| 3615 | IMPDH2 | HTA11_546_2000001011 | Human | Colorectum | AD | 2.53e-21 | 1.13e+00 | -0.0842 |
| 3615 | IMPDH2 | HTA11_9341_2000001011 | Human | Colorectum | SER | 2.96e-03 | 8.11e-01 | -0.00410000000000005 |
| 3615 | IMPDH2 | HTA11_7862_2000001011 | Human | Colorectum | AD | 3.24e-11 | 5.84e-01 | -0.0179 |
| 3615 | IMPDH2 | HTA11_866_3004761011 | Human | Colorectum | AD | 4.57e-59 | 1.43e+00 | 0.096 |
| 3615 | IMPDH2 | HTA11_4255_2000001011 | Human | Colorectum | SER | 1.87e-22 | 1.40e+00 | 0.0446 |
| 3615 | IMPDH2 | HTA11_9408_2000001011 | Human | Colorectum | AD | 2.56e-13 | 1.17e+00 | 0.0451 |
| Page: 1 2 3 4 5 6 7 8 9 10 11 |
| Tissue | Expression Dynamics | Abbreviation |
| Colorectum (GSE201348) |  | FAP: Familial adenomatous polyposis |
| CRC: Colorectal cancer | ||
| Colorectum (HTA11) |  | AD: Adenomas |
| SER: Sessile serrated lesions | ||
| MSI-H: Microsatellite-high colorectal cancer | ||
| MSS: Microsatellite stable colorectal cancer | ||
| Endometrium | 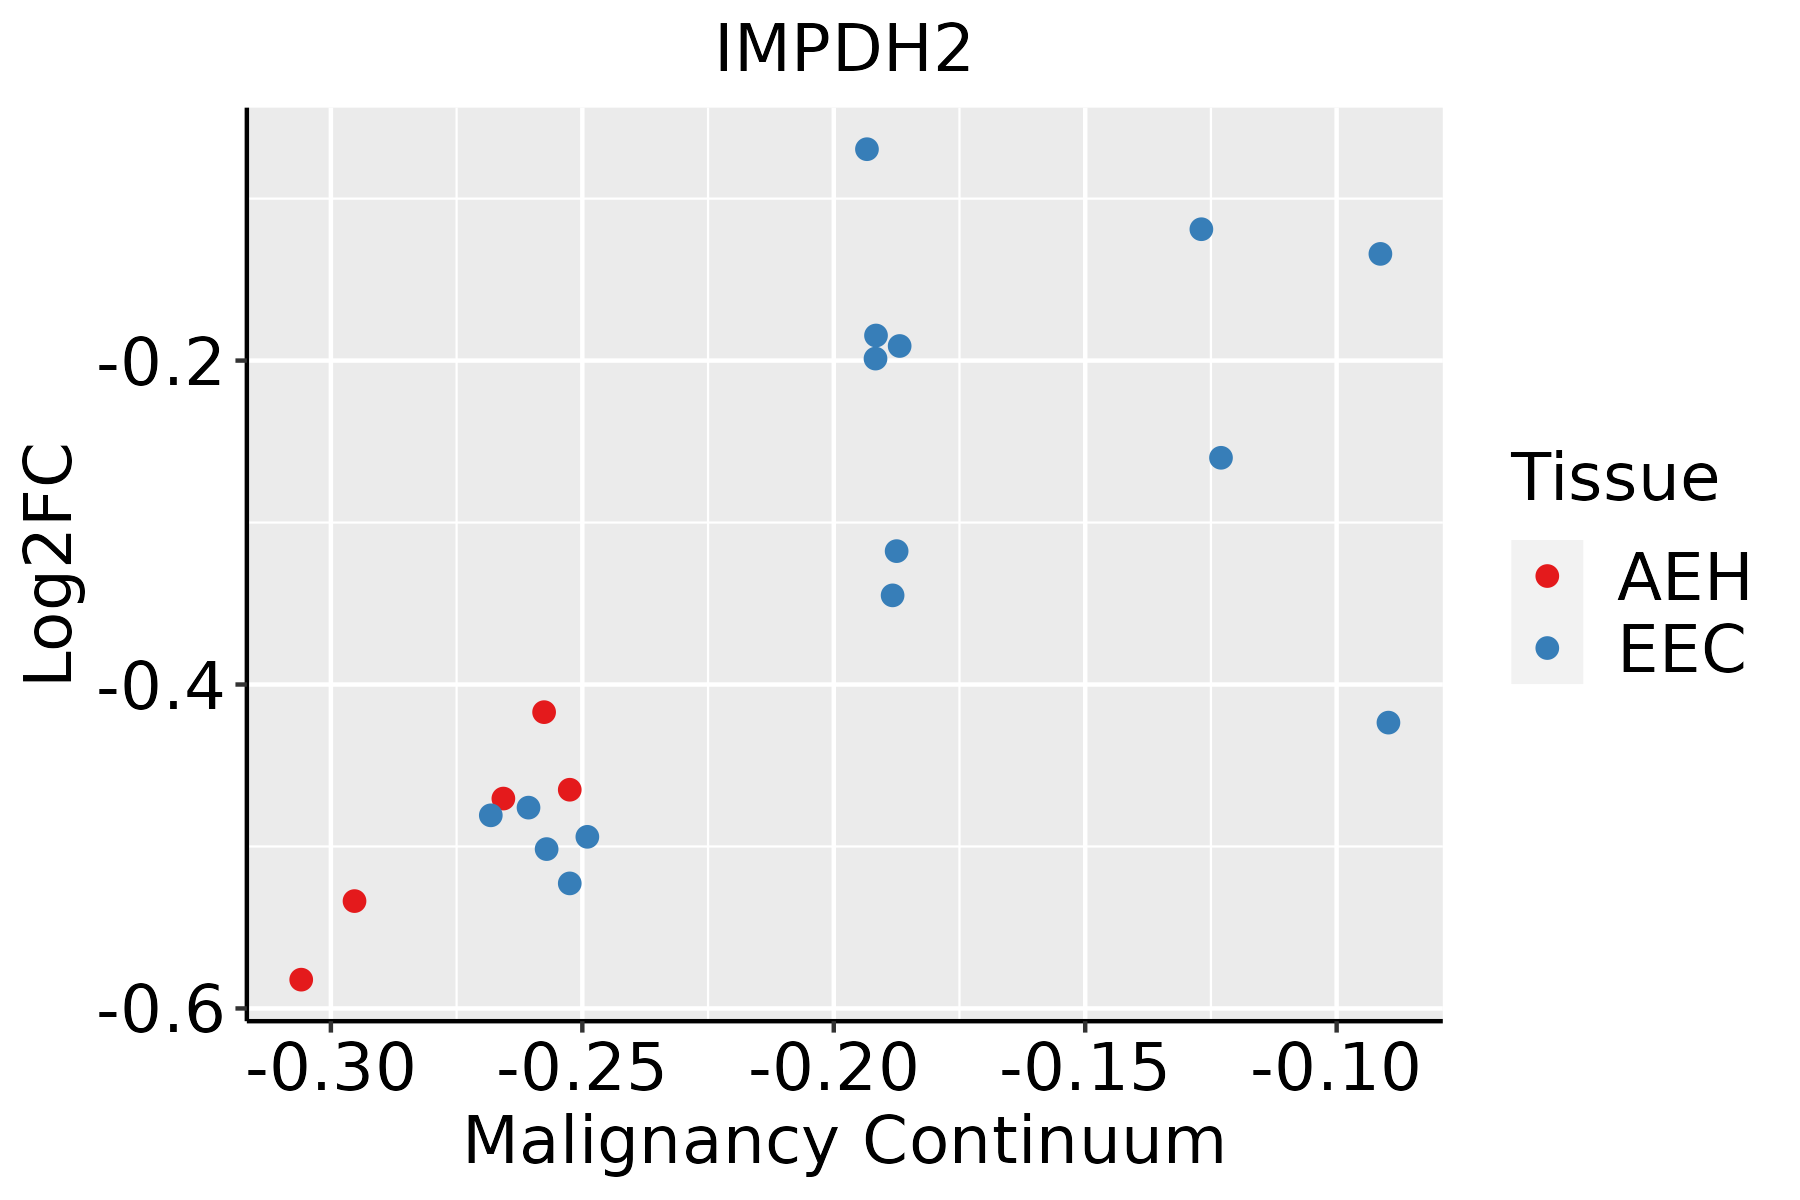 | AEH: Atypical endometrial hyperplasia |
| EEC: Endometrioid Cancer | ||
| Esophagus | 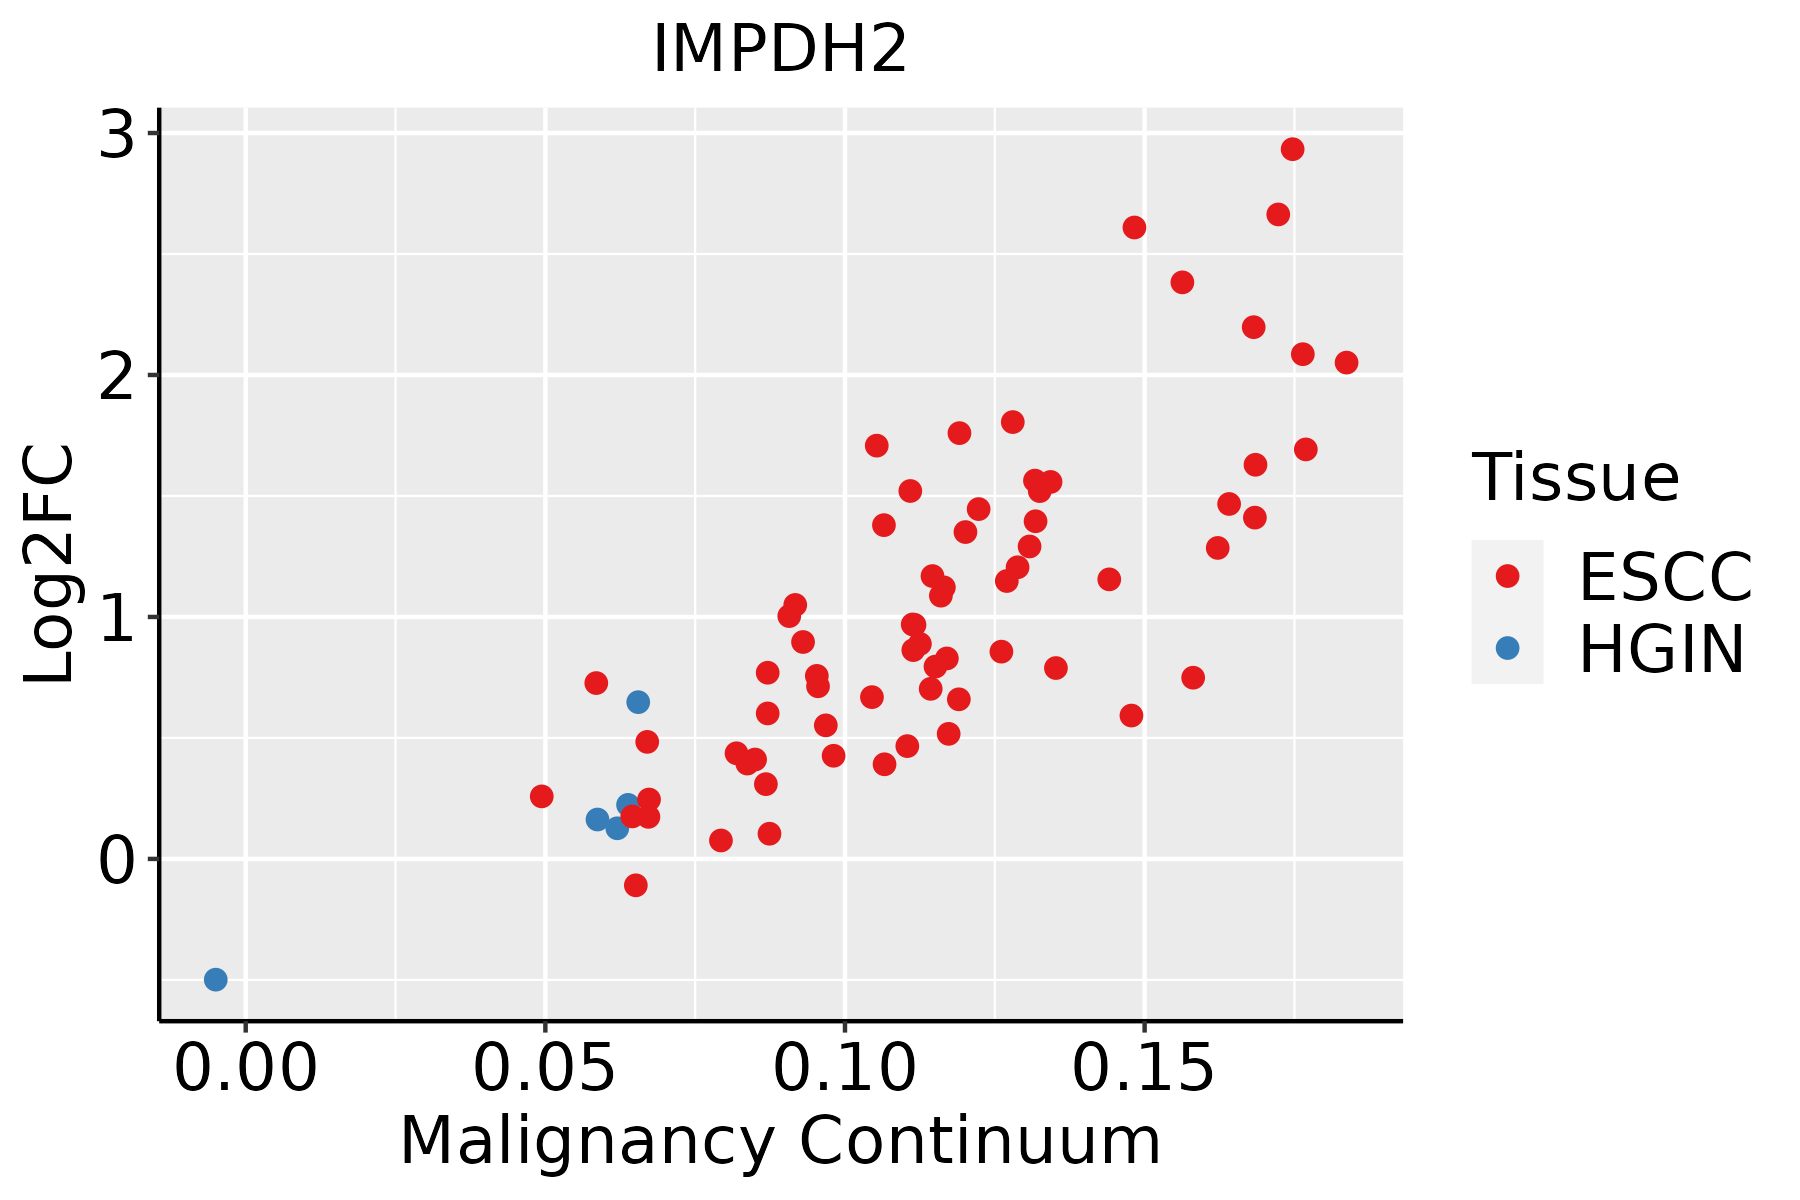 | ESCC: Esophageal squamous cell carcinoma |
| HGIN: High-grade intraepithelial neoplasias | ||
| LGIN: Low-grade intraepithelial neoplasias | ||
| Liver |  | HCC: Hepatocellular carcinoma |
| NAFLD: Non-alcoholic fatty liver disease | ||
| Oral Cavity | 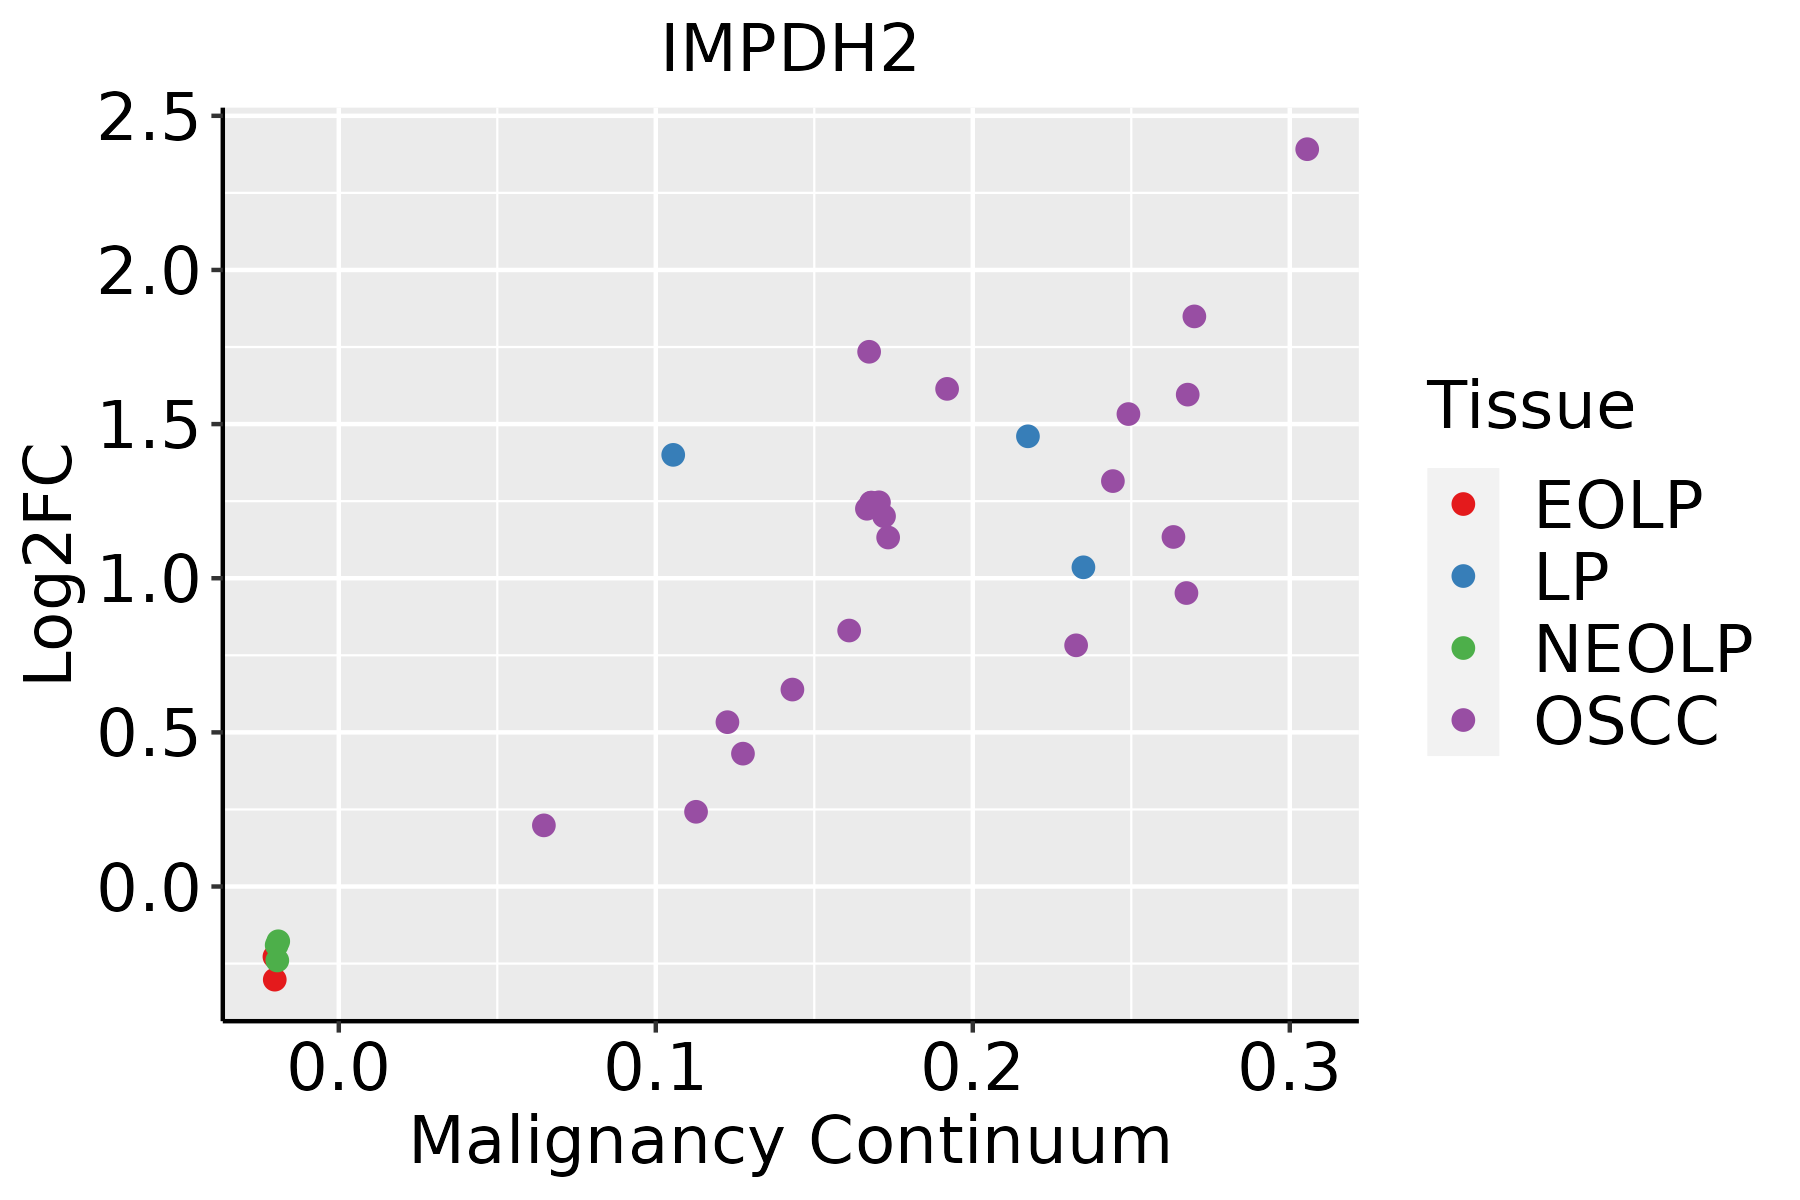 | EOLP: Erosive Oral lichen planus |
| LP: leukoplakia | ||
| NEOLP: Non-erosive oral lichen planus | ||
| OSCC: Oral squamous cell carcinoma | ||
| Prostate | 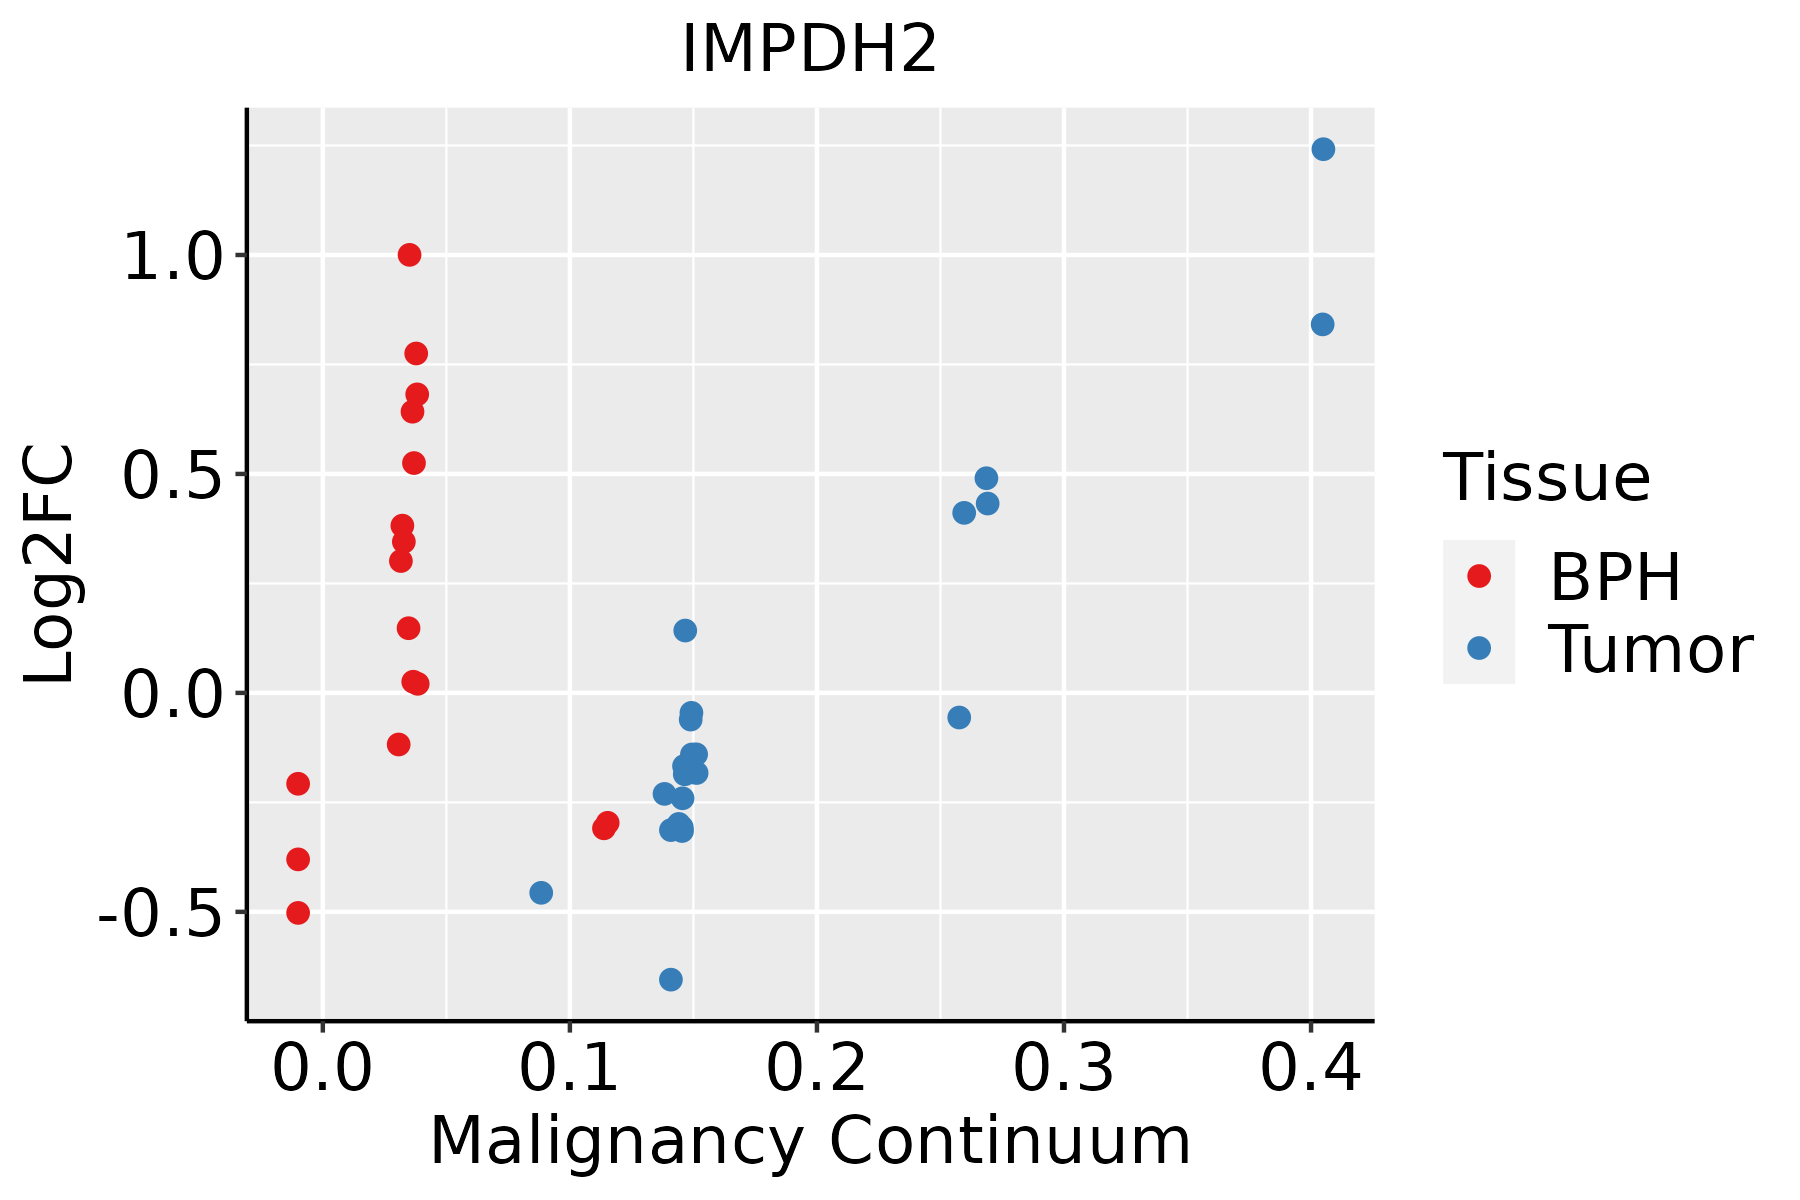 | BPH: Benign Prostatic Hyperplasia |
| Skin | 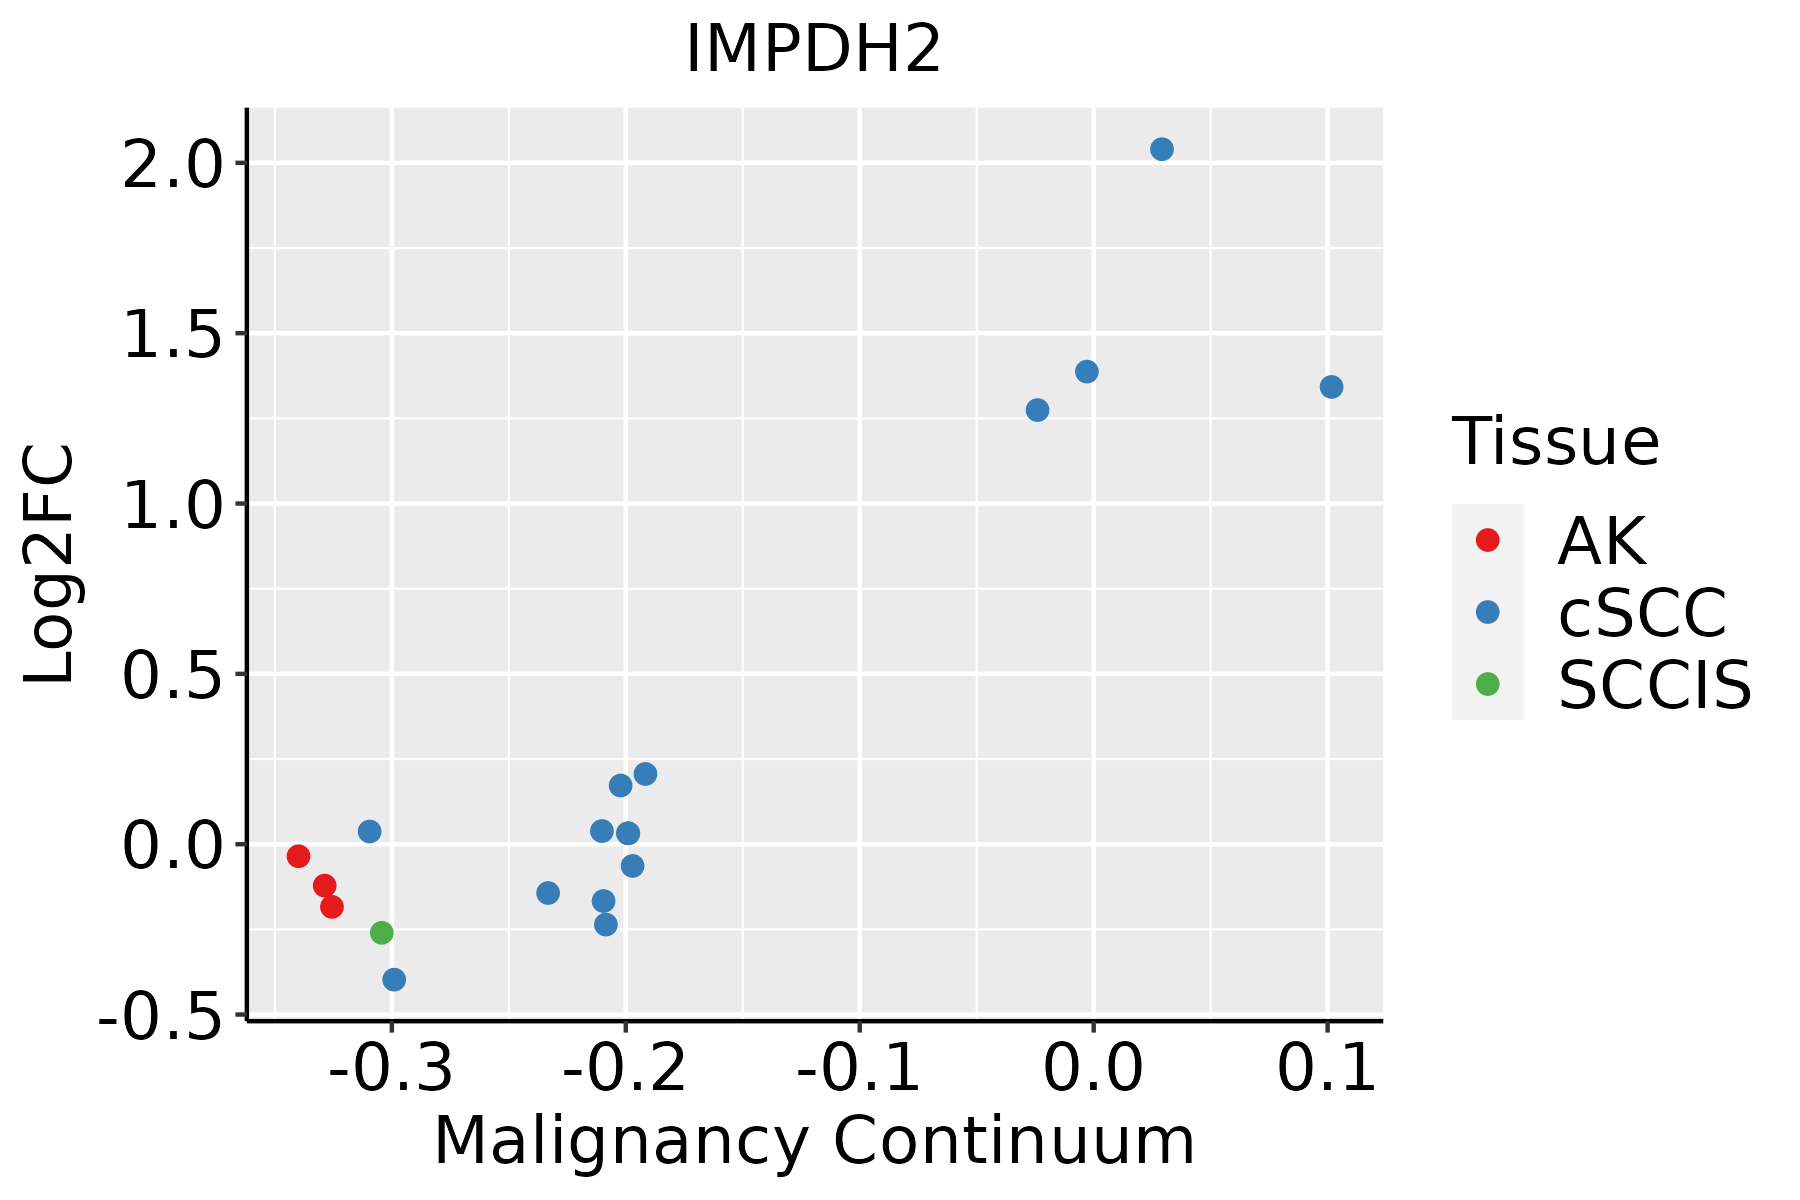 | AK: Actinic keratosis |
| cSCC: Cutaneous squamous cell carcinoma | ||
| SCCIS:squamous cell carcinoma in situ | ||
| Thyroid | 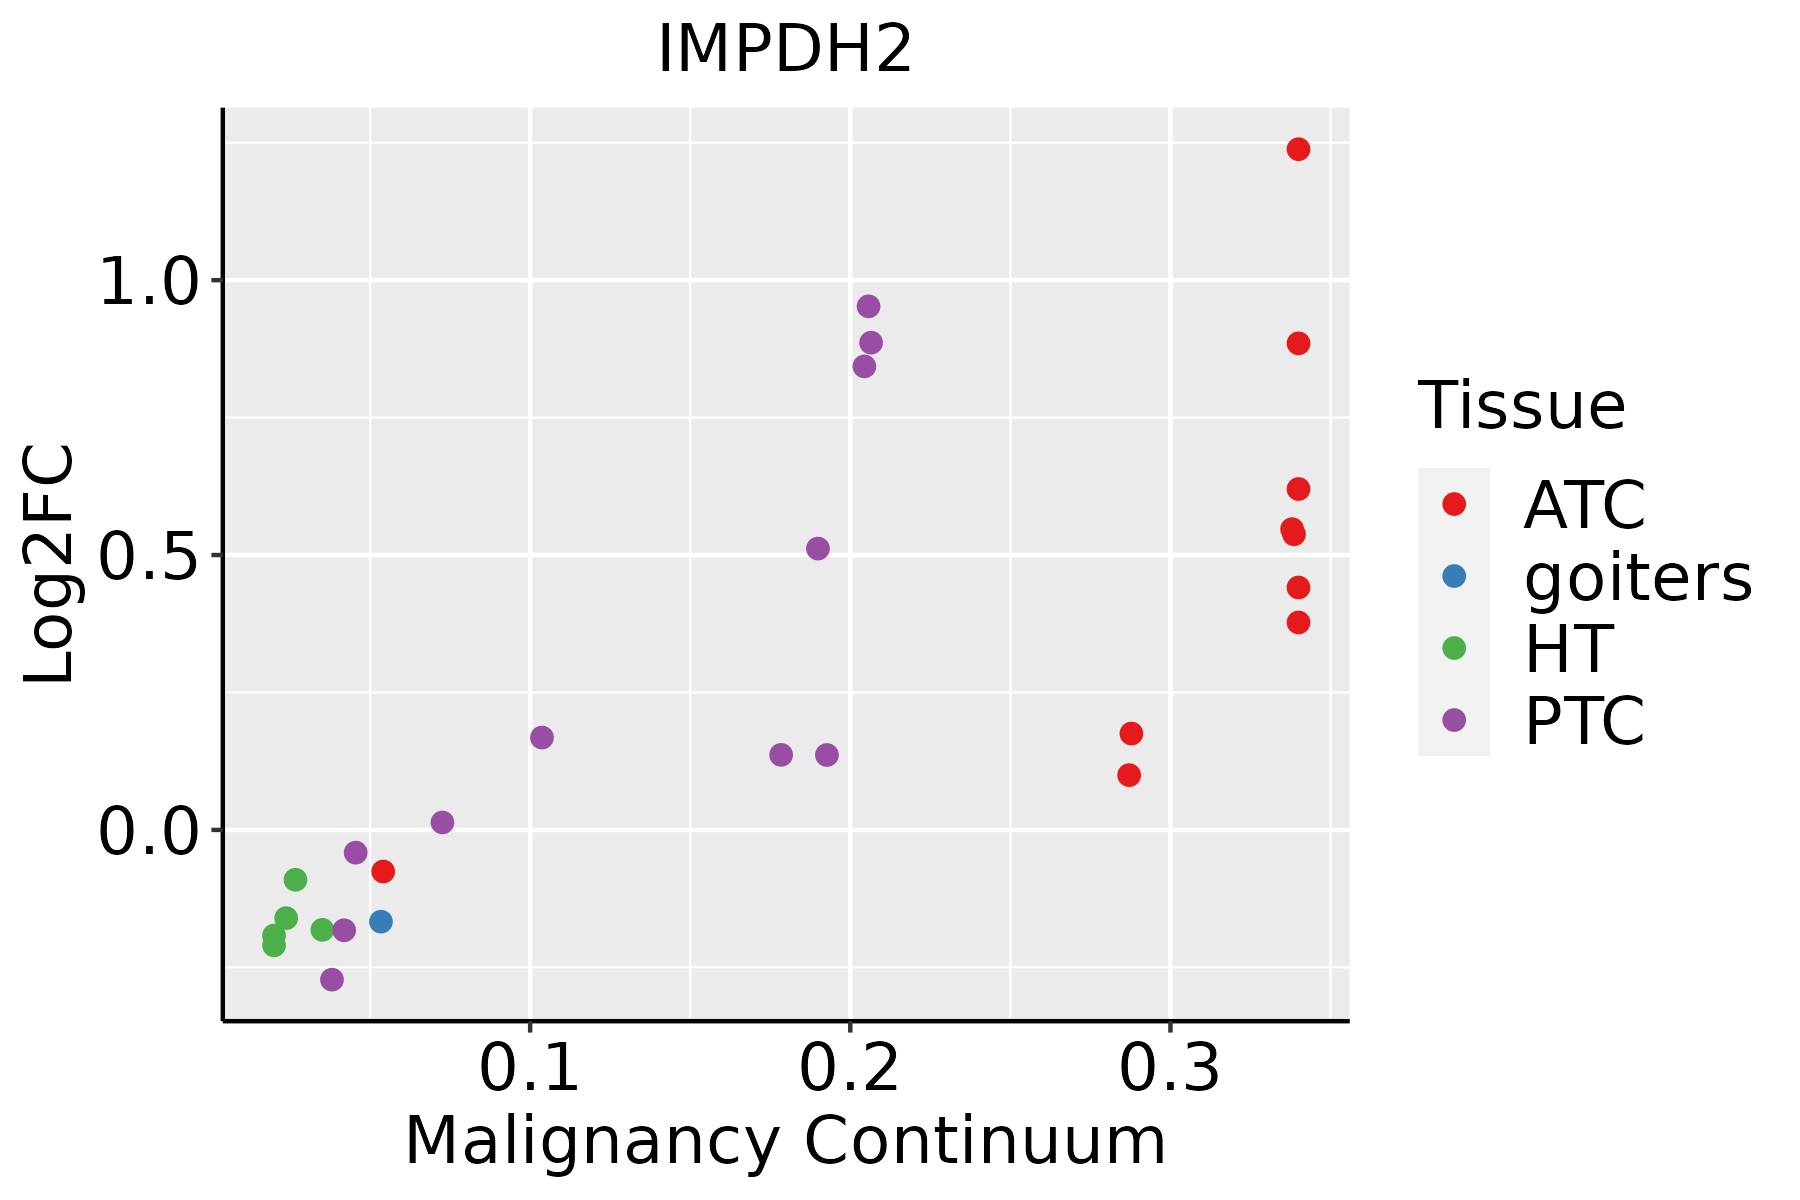 | ATC: Anaplastic thyroid cancer |
| HT: Hashimoto's thyroiditis | ||
| PTC: Papillary thyroid cancer |
| ∗log2FC in expression of this searched gene in stem-like cells from each diseased tissue sample relative to stem-like cells in normal samples in each tissue plotted against the malignancy continuum. Samples are colored based on if they are from different disease stage. |
Top |
Malignant transformation related pathway analysis |
| Find out the enriched GO biological processes and KEGG pathways involved in transition from healthy to precancer to cancer |
| Tissue | Disease Stage | Enriched GO biological Processes |
| Colorectum | AD |  |
| Colorectum | SER |  |
| Colorectum | MSS |  |
| Colorectum | MSI-H |  |
| Colorectum | FAP |  |
| ∗Top 15 enriched GO BP terms are showed in the bar plot of each disease state in each tissue. Each row represents a significant GO biological process which is colored according to the -log10(p.adjust). |
| Page: 1 2 3 4 5 6 7 8 9 |
| GO ID | Tissue | Disease Stage | Description | Gene Ratio | Bg Ratio | pvalue | p.adjust | Count |
| GO:0009150 | Colorectum | AD | purine ribonucleotide metabolic process | 142/3918 | 368/18723 | 4.29e-15 | 1.17e-12 | 142 |
| GO:0006163 | Colorectum | AD | purine nucleotide metabolic process | 149/3918 | 396/18723 | 1.08e-14 | 2.80e-12 | 149 |
| GO:0072521 | Colorectum | AD | purine-containing compound metabolic process | 153/3918 | 416/18723 | 4.34e-14 | 1.01e-11 | 153 |
| GO:0009259 | Colorectum | AD | ribonucleotide metabolic process | 144/3918 | 385/18723 | 5.25e-14 | 1.13e-11 | 144 |
| GO:0019693 | Colorectum | AD | ribose phosphate metabolic process | 145/3918 | 396/18723 | 3.01e-13 | 5.71e-11 | 145 |
| GO:0009117 | Colorectum | AD | nucleotide metabolic process | 168/3918 | 489/18723 | 2.20e-12 | 3.36e-10 | 168 |
| GO:0006753 | Colorectum | AD | nucleoside phosphate metabolic process | 169/3918 | 497/18723 | 4.99e-12 | 6.98e-10 | 169 |
| GO:0009144 | Colorectum | AD | purine nucleoside triphosphate metabolic process | 43/3918 | 88/18723 | 5.05e-09 | 3.19e-07 | 43 |
| GO:0009205 | Colorectum | AD | purine ribonucleoside triphosphate metabolic process | 39/3918 | 82/18723 | 6.58e-08 | 3.40e-06 | 39 |
| GO:0009141 | Colorectum | AD | nucleoside triphosphate metabolic process | 48/3918 | 112/18723 | 1.27e-07 | 6.02e-06 | 48 |
| GO:0009145 | Colorectum | AD | purine nucleoside triphosphate biosynthetic process | 34/3918 | 69/18723 | 1.54e-07 | 6.78e-06 | 34 |
| GO:0009199 | Colorectum | AD | ribonucleoside triphosphate metabolic process | 40/3918 | 89/18723 | 3.04e-07 | 1.21e-05 | 40 |
| GO:0009152 | Colorectum | AD | purine ribonucleotide biosynthetic process | 64/3918 | 169/18723 | 3.09e-07 | 1.22e-05 | 64 |
| GO:0009206 | Colorectum | AD | purine ribonucleoside triphosphate biosynthetic process | 33/3918 | 68/18723 | 3.68e-07 | 1.43e-05 | 33 |
| GO:0009201 | Colorectum | AD | ribonucleoside triphosphate biosynthetic process | 34/3918 | 74/18723 | 1.23e-06 | 4.01e-05 | 34 |
| GO:0009260 | Colorectum | AD | ribonucleotide biosynthetic process | 66/3918 | 182/18723 | 1.25e-06 | 4.02e-05 | 66 |
| GO:0009142 | Colorectum | AD | nucleoside triphosphate biosynthetic process | 37/3918 | 85/18723 | 2.16e-06 | 6.35e-05 | 37 |
| GO:0046390 | Colorectum | AD | ribose phosphate biosynthetic process | 67/3918 | 190/18723 | 3.21e-06 | 9.05e-05 | 67 |
| GO:0007623 | Colorectum | AD | circadian rhythm | 72/3918 | 210/18723 | 4.50e-06 | 1.21e-04 | 72 |
| GO:0006164 | Colorectum | AD | purine nucleotide biosynthetic process | 66/3918 | 191/18723 | 8.22e-06 | 1.97e-04 | 66 |
| Page: 1 2 3 4 5 6 7 8 9 10 11 12 13 14 15 16 17 18 19 20 21 22 23 |
| Pathway ID | Tissue | Disease Stage | Description | Gene Ratio | Bg Ratio | pvalue | p.adjust | qvalue | Count |
| hsa012325 | Esophagus | ESCC | Nucleotide metabolism | 59/4205 | 85/8465 | 1.67e-04 | 6.58e-04 | 3.37e-04 | 59 |
| hsa0123212 | Esophagus | ESCC | Nucleotide metabolism | 59/4205 | 85/8465 | 1.67e-04 | 6.58e-04 | 3.37e-04 | 59 |
| hsa01232 | Liver | Cirrhotic | Nucleotide metabolism | 39/2530 | 85/8465 | 1.27e-03 | 6.73e-03 | 4.15e-03 | 39 |
| hsa00983 | Liver | Cirrhotic | Drug metabolism - other enzymes | 34/2530 | 80/8465 | 1.08e-02 | 3.57e-02 | 2.20e-02 | 34 |
| hsa012321 | Liver | Cirrhotic | Nucleotide metabolism | 39/2530 | 85/8465 | 1.27e-03 | 6.73e-03 | 4.15e-03 | 39 |
| hsa009831 | Liver | Cirrhotic | Drug metabolism - other enzymes | 34/2530 | 80/8465 | 1.08e-02 | 3.57e-02 | 2.20e-02 | 34 |
| hsa012322 | Liver | HCC | Nucleotide metabolism | 59/4020 | 85/8465 | 3.30e-05 | 1.88e-04 | 1.04e-04 | 59 |
| hsa009832 | Liver | HCC | Drug metabolism - other enzymes | 54/4020 | 80/8465 | 2.25e-04 | 1.09e-03 | 6.08e-04 | 54 |
| hsa012323 | Liver | HCC | Nucleotide metabolism | 59/4020 | 85/8465 | 3.30e-05 | 1.88e-04 | 1.04e-04 | 59 |
| hsa009833 | Liver | HCC | Drug metabolism - other enzymes | 54/4020 | 80/8465 | 2.25e-04 | 1.09e-03 | 6.08e-04 | 54 |
| hsa012324 | Oral cavity | OSCC | Nucleotide metabolism | 54/3704 | 85/8465 | 1.78e-04 | 5.95e-04 | 3.03e-04 | 54 |
| hsa0123211 | Oral cavity | OSCC | Nucleotide metabolism | 54/3704 | 85/8465 | 1.78e-04 | 5.95e-04 | 3.03e-04 | 54 |
| hsa0123221 | Oral cavity | LP | Nucleotide metabolism | 42/2418 | 85/8465 | 3.62e-05 | 2.36e-04 | 1.52e-04 | 42 |
| hsa0123231 | Oral cavity | LP | Nucleotide metabolism | 42/2418 | 85/8465 | 3.62e-05 | 2.36e-04 | 1.52e-04 | 42 |
| Page: 1 |
Top |
Cell-cell communication analysis |
| Identification of potential cell-cell interactions between two cell types and their ligand-receptor pairs for different disease states |
| Ligand | Receptor | LRpair | Pathway | Tissue | Disease Stage |
| Page: 1 |
Top |
Single-cell gene regulatory network inference analysis |
| Find out the significant the regulons (TFs) and the target genes of each regulon across cell types for different disease states |
| TF | Cell Type | Tissue | Disease Stage | Target Gene | RSS | Regulon Activity |
| ∗The dot plots of a searched regulon are shown for all cell subpopulations in each disease state of each tissue based on the regulon specific score inferred using pySCENIC and by calculating the average expression. |
| Page: 1 |
Top |
Somatic mutation of malignant transformation related genes |
| Annotation of somatic variants for genes involved in malignant transformation |
| Hugo Symbol | Variant Class | Variant Classification | dbSNP RS | HGVSc | HGVSp | HGVSp Short | SWISSPROT | BIOTYPE | SIFT | PolyPhen | Tumor Sample Barcode | Tissue | Histology | Sex | Age | Stage | Therapy Types | Drugs | Outcome |
| IMPDH2 | SNV | Missense_Mutation | c.1283A>G | p.Asn428Ser | p.N428S | P12268 | protein_coding | tolerated(0.9) | benign(0.001) | TCGA-A7-A0CE-01 | Breast | breast invasive carcinoma | Female | <65 | I/II | Chemotherapy | adriamycin | SD | |
| IMPDH2 | deletion | Frame_Shift_Del | novel | c.586delN | p.Glu196ArgfsTer17 | p.E196Rfs*17 | P12268 | protein_coding | TCGA-EW-A2FV-01 | Breast | breast invasive carcinoma | Female | <65 | III/IV | Chemotherapy | docetaxel | SD | ||
| IMPDH2 | SNV | Missense_Mutation | novel | c.1220G>A | p.Arg407Gln | p.R407Q | P12268 | protein_coding | deleterious(0.02) | benign(0.382) | TCGA-2W-A8YY-01 | Cervix | cervical & endocervical cancer | Female | <65 | I/II | Chemotherapy | cisplatin | CR |
| IMPDH2 | SNV | Missense_Mutation | rs761002300 | c.608G>A | p.Arg203His | p.R203H | P12268 | protein_coding | deleterious(0.01) | benign(0.022) | TCGA-2W-A8YY-01 | Cervix | cervical & endocervical cancer | Female | <65 | I/II | Chemotherapy | cisplatin | CR |
| IMPDH2 | SNV | Missense_Mutation | c.1484C>T | p.Ser495Phe | p.S495F | P12268 | protein_coding | tolerated(0.36) | benign(0.094) | TCGA-Q1-A73O-01 | Cervix | cervical & endocervical cancer | Female | <65 | I/II | Chemotherapy | cisplatin | CR | |
| IMPDH2 | SNV | Missense_Mutation | c.1243G>T | p.Gly415Cys | p.G415C | P12268 | protein_coding | deleterious(0) | probably_damaging(0.999) | TCGA-A6-5661-01 | Colorectum | colon adenocarcinoma | Female | >=65 | I/II | Unknown | Unknown | SD | |
| IMPDH2 | SNV | Missense_Mutation | c.908N>T | p.Asn303Ile | p.N303I | P12268 | protein_coding | deleterious(0) | probably_damaging(0.999) | TCGA-AA-3663-01 | Colorectum | colon adenocarcinoma | Male | <65 | I/II | Unknown | Unknown | SD | |
| IMPDH2 | SNV | Missense_Mutation | novel | c.1061C>T | p.Ala354Val | p.A354V | P12268 | protein_coding | deleterious(0.01) | probably_damaging(0.96) | TCGA-AA-3950-01 | Colorectum | colon adenocarcinoma | Female | >=65 | I/II | Unknown | Unknown | SD |
| IMPDH2 | SNV | Missense_Mutation | c.188N>T | p.Thr63Ile | p.T63I | P12268 | protein_coding | tolerated(0.19) | probably_damaging(0.98) | TCGA-AD-6889-01 | Colorectum | colon adenocarcinoma | Male | >=65 | I/II | Chemotherapy | xeloda | PD | |
| IMPDH2 | SNV | Missense_Mutation | c.187N>G | p.Thr63Ala | p.T63A | P12268 | protein_coding | tolerated(0.31) | benign(0.035) | TCGA-AM-5821-01 | Colorectum | colon adenocarcinoma | Female | >=65 | I/II | Unknown | Unknown | SD |
| Page: 1 2 3 4 5 6 |
Top |
Related drugs of malignant transformation related genes |
| Identification of chemicals and drugs interact with genes involved in malignant transfromation |
| (DGIdb 4.0) |
| Entrez ID | Symbol | Category | Interaction Types | Drug Claim Name | Drug Name | PMIDs |
| 3615 | IMPDH2 | DRUGGABLE GENOME, ENZYME | MYCOPHENOLATE MOFETIL | |||
| 3615 | IMPDH2 | DRUGGABLE GENOME, ENZYME | 6-CL-PRT-BIOTIN | CHEMBL1683024 | 21295473 | |
| 3615 | IMPDH2 | DRUGGABLE GENOME, ENZYME | inhibitor | CHEMBL1456 | MYCOPHENOLATE MOFETIL | |
| 3615 | IMPDH2 | DRUGGABLE GENOME, ENZYME | cyclosporine | CYCLOSPORINE | 21996196,19770842,18444945,19617864,22960765 | |
| 3615 | IMPDH2 | DRUGGABLE GENOME, ENZYME | inhibitor | CHEMBL866 | MYCOPHENOLIC ACID | |
| 3615 | IMPDH2 | DRUGGABLE GENOME, ENZYME | Urea and carbamate bioisostere derivative 1 | |||
| 3615 | IMPDH2 | DRUGGABLE GENOME, ENZYME | Mycophenolate mofetil | |||
| 3615 | IMPDH2 | DRUGGABLE GENOME, ENZYME | MYCOPHENOLATE MOFETIL | |||
| 3615 | IMPDH2 | DRUGGABLE GENOME, ENZYME | inhibitor | 178103438 | ||
| 3615 | IMPDH2 | DRUGGABLE GENOME, ENZYME | inhibitor | 405067333 | MERIMEPODIB |
| Page: 1 2 |

Copyright 2023-Present -The University of Texas Health Science Center at Houston |