
|
|||||
|
 | |
| |
| |
| |
| |
| |
|
Gene: IMPDH1 |
Gene summary for IMPDH1 |
| Gene information | Species | Human | Gene symbol | IMPDH1 | Gene ID | 3614 |
| Gene name | inosine monophosphate dehydrogenase 1 | |
| Gene Alias | IMPD | |
| Cytomap | 7q32.1 | |
| Gene Type | protein-coding | GO ID | GO:0006139 | UniProtAcc | B3KRZ3 |
Top |
Malignant transformation analysis |
| Identification of the aberrant gene expression in precancerous and cancerous lesions by comparing the gene expression of stem-like cells in diseased tissues with normal stem cells |
| Entrez ID | Symbol | Replicates | Species | Organ | Tissue | Adj P-value | Log2FC | Malignancy |
| 3614 | IMPDH1 | LZE4T | Human | Esophagus | ESCC | 2.35e-07 | 1.92e-01 | 0.0811 |
| 3614 | IMPDH1 | LZE7T | Human | Esophagus | ESCC | 1.71e-05 | 2.75e-01 | 0.0667 |
| 3614 | IMPDH1 | LZE20T | Human | Esophagus | ESCC | 9.83e-05 | 2.01e-01 | 0.0662 |
| 3614 | IMPDH1 | LZE22D1 | Human | Esophagus | HGIN | 1.81e-03 | 1.60e-01 | 0.0595 |
| 3614 | IMPDH1 | LZE22T | Human | Esophagus | ESCC | 2.98e-11 | 7.77e-01 | 0.068 |
| 3614 | IMPDH1 | LZE24T | Human | Esophagus | ESCC | 3.86e-14 | 4.58e-01 | 0.0596 |
| 3614 | IMPDH1 | LZE6T | Human | Esophagus | ESCC | 1.71e-04 | 2.66e-01 | 0.0845 |
| 3614 | IMPDH1 | P1T-E | Human | Esophagus | ESCC | 1.81e-06 | 3.39e-01 | 0.0875 |
| 3614 | IMPDH1 | P2T-E | Human | Esophagus | ESCC | 4.98e-10 | 1.62e-01 | 0.1177 |
| 3614 | IMPDH1 | P4T-E | Human | Esophagus | ESCC | 1.01e-25 | 7.13e-01 | 0.1323 |
| 3614 | IMPDH1 | P5T-E | Human | Esophagus | ESCC | 9.24e-24 | 4.98e-01 | 0.1327 |
| 3614 | IMPDH1 | P8T-E | Human | Esophagus | ESCC | 5.63e-08 | 2.32e-01 | 0.0889 |
| 3614 | IMPDH1 | P9T-E | Human | Esophagus | ESCC | 6.11e-19 | 5.96e-01 | 0.1131 |
| 3614 | IMPDH1 | P10T-E | Human | Esophagus | ESCC | 1.20e-15 | 3.54e-01 | 0.116 |
| 3614 | IMPDH1 | P11T-E | Human | Esophagus | ESCC | 3.12e-11 | 2.35e-01 | 0.1426 |
| 3614 | IMPDH1 | P12T-E | Human | Esophagus | ESCC | 1.09e-20 | 5.65e-01 | 0.1122 |
| 3614 | IMPDH1 | P15T-E | Human | Esophagus | ESCC | 1.29e-38 | 9.47e-01 | 0.1149 |
| 3614 | IMPDH1 | P16T-E | Human | Esophagus | ESCC | 2.61e-11 | 3.05e-01 | 0.1153 |
| 3614 | IMPDH1 | P17T-E | Human | Esophagus | ESCC | 1.12e-09 | 4.36e-01 | 0.1278 |
| 3614 | IMPDH1 | P19T-E | Human | Esophagus | ESCC | 1.71e-07 | 1.16e+00 | 0.1662 |
| Page: 1 2 3 4 5 6 |
| Tissue | Expression Dynamics | Abbreviation |
| Esophagus |  | ESCC: Esophageal squamous cell carcinoma |
| HGIN: High-grade intraepithelial neoplasias | ||
| LGIN: Low-grade intraepithelial neoplasias | ||
| Liver | 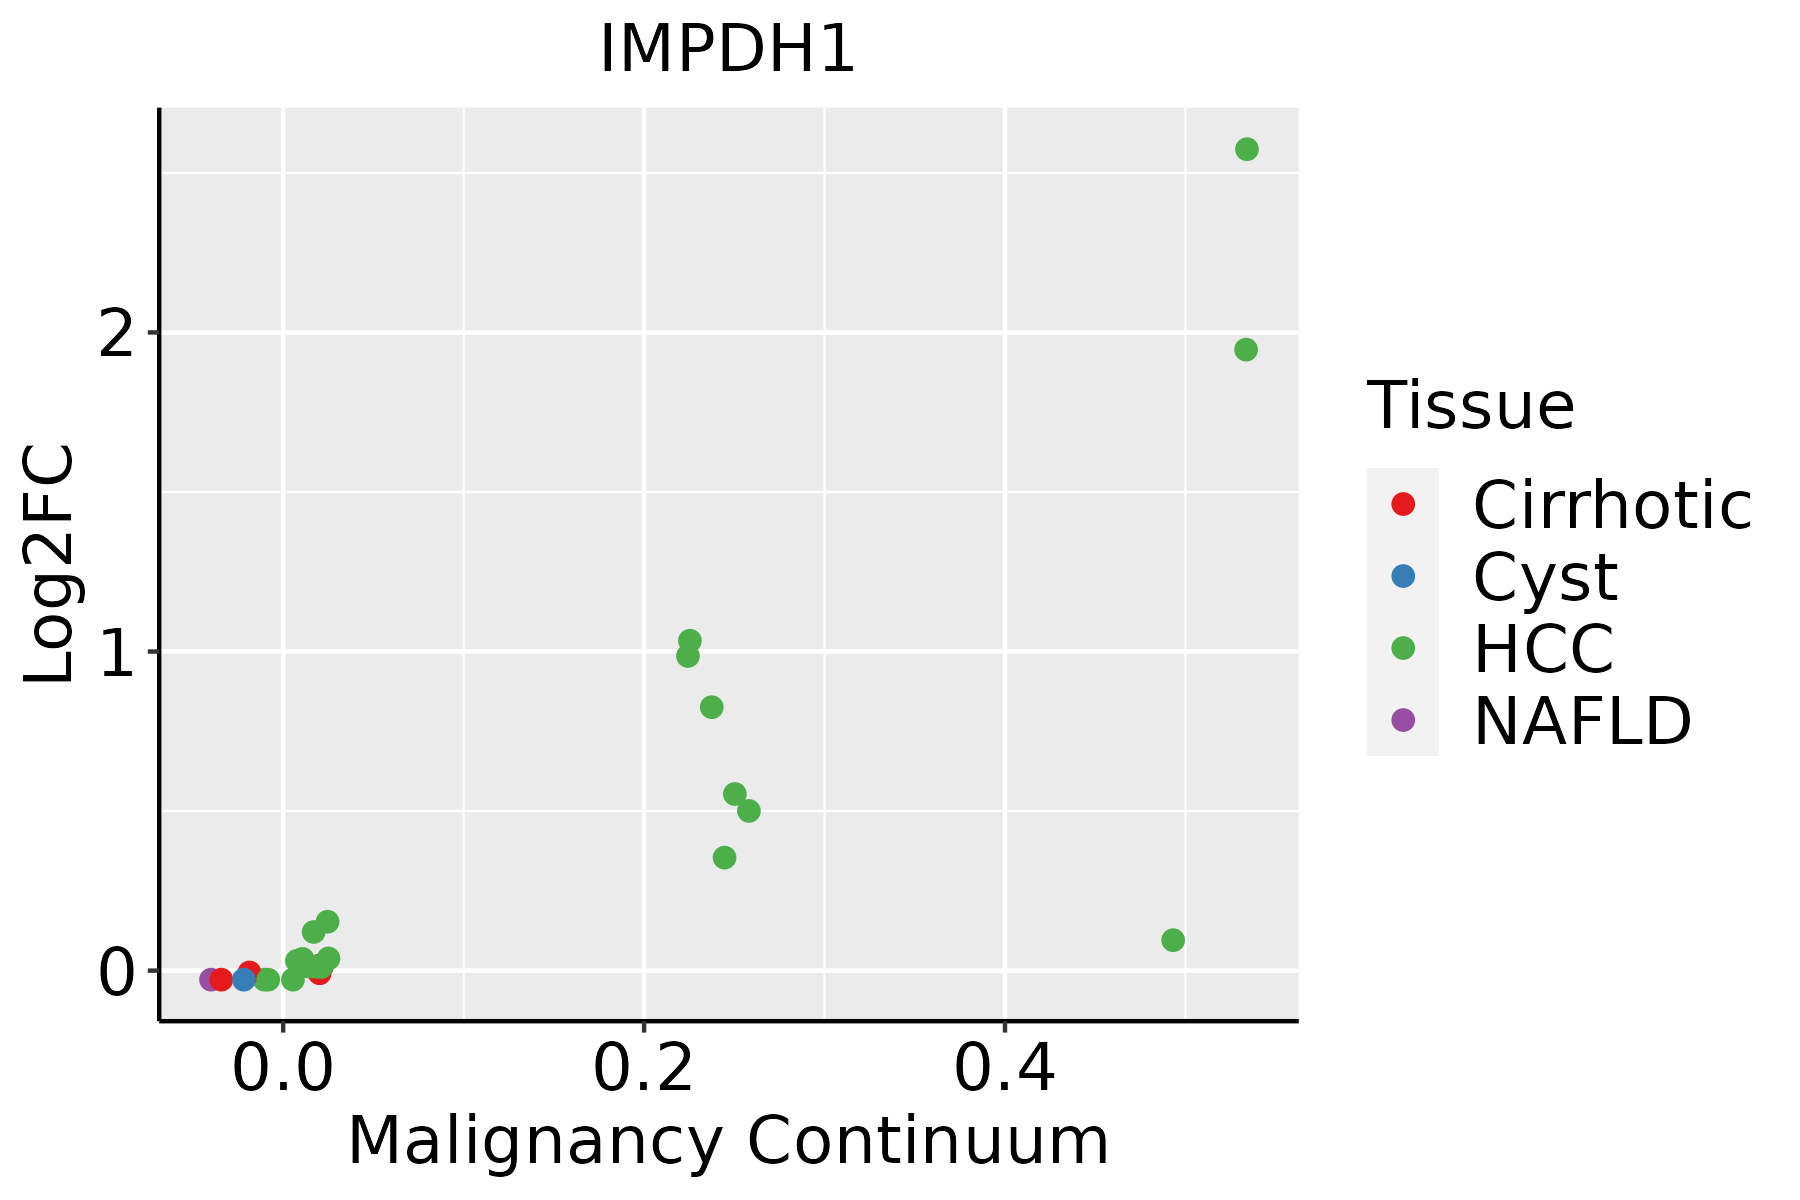 | HCC: Hepatocellular carcinoma |
| NAFLD: Non-alcoholic fatty liver disease | ||
| Oral Cavity |  | EOLP: Erosive Oral lichen planus |
| LP: leukoplakia | ||
| NEOLP: Non-erosive oral lichen planus | ||
| OSCC: Oral squamous cell carcinoma | ||
| Skin | 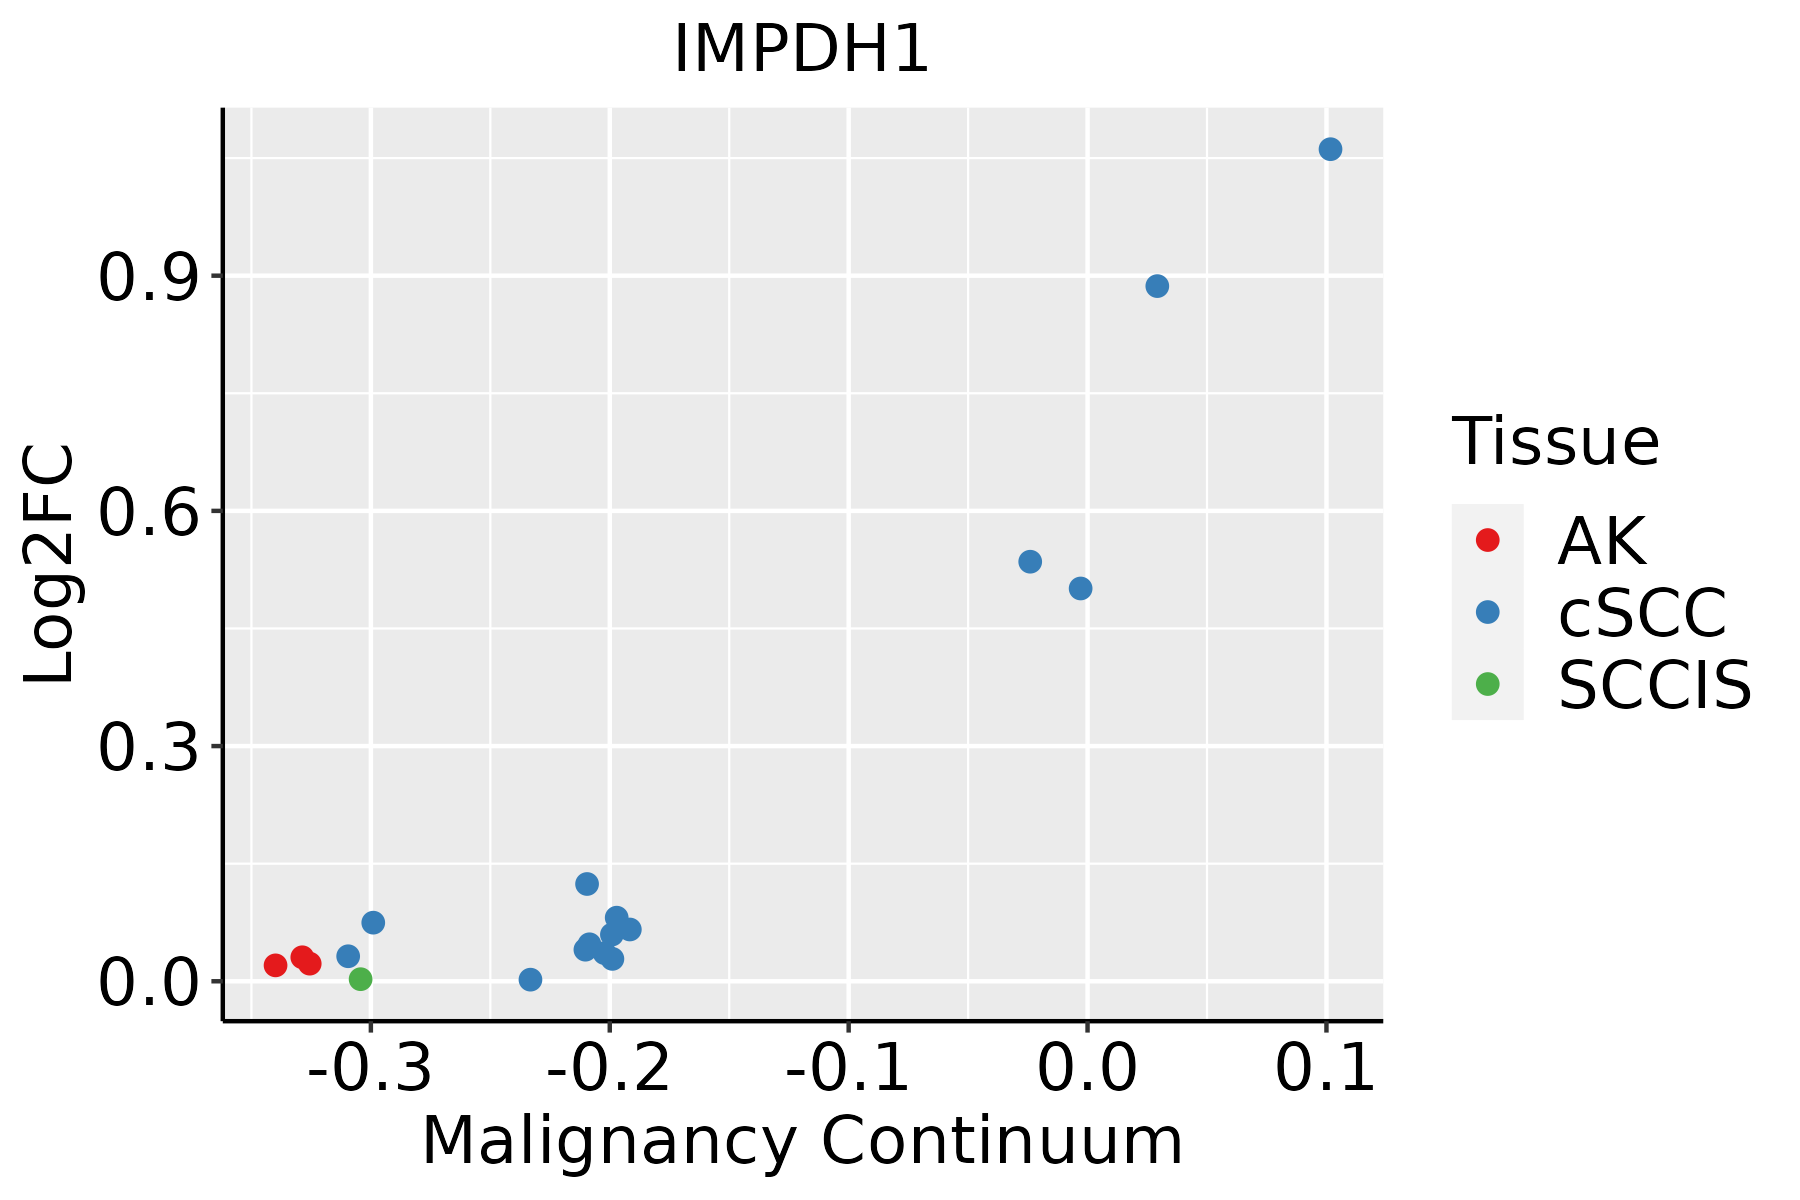 | AK: Actinic keratosis |
| cSCC: Cutaneous squamous cell carcinoma | ||
| SCCIS:squamous cell carcinoma in situ | ||
| Thyroid |  | ATC: Anaplastic thyroid cancer |
| HT: Hashimoto's thyroiditis | ||
| PTC: Papillary thyroid cancer |
| ∗log2FC in expression of this searched gene in stem-like cells from each diseased tissue sample relative to stem-like cells in normal samples in each tissue plotted against the malignancy continuum. Samples are colored based on if they are from different disease stage. |
Top |
Malignant transformation related pathway analysis |
| Find out the enriched GO biological processes and KEGG pathways involved in transition from healthy to precancer to cancer |
| Tissue | Disease Stage | Enriched GO biological Processes |
| Colorectum | AD |  |
| Colorectum | SER |  |
| Colorectum | MSS |  |
| Colorectum | MSI-H |  |
| Colorectum | FAP |  |
| ∗Top 15 enriched GO BP terms are showed in the bar plot of each disease state in each tissue. Each row represents a significant GO biological process which is colored according to the -log10(p.adjust). |
| Page: 1 2 3 4 5 6 7 8 9 |
| GO ID | Tissue | Disease Stage | Description | Gene Ratio | Bg Ratio | pvalue | p.adjust | Count |
| GO:000914419 | Esophagus | HGIN | purine nucleoside triphosphate metabolic process | 36/2587 | 88/18723 | 3.49e-10 | 3.05e-08 | 36 |
| GO:000914518 | Esophagus | HGIN | purine nucleoside triphosphate biosynthetic process | 31/2587 | 69/18723 | 3.51e-10 | 3.05e-08 | 31 |
| GO:000920618 | Esophagus | HGIN | purine ribonucleoside triphosphate biosynthetic process | 30/2587 | 68/18723 | 1.16e-09 | 9.27e-08 | 30 |
| GO:000920518 | Esophagus | HGIN | purine ribonucleoside triphosphate metabolic process | 33/2587 | 82/18723 | 3.10e-09 | 2.27e-07 | 33 |
| GO:000920117 | Esophagus | HGIN | ribonucleoside triphosphate biosynthetic process | 30/2587 | 74/18723 | 1.30e-08 | 8.15e-07 | 30 |
| GO:000914120 | Esophagus | HGIN | nucleoside triphosphate metabolic process | 39/2587 | 112/18723 | 1.56e-08 | 9.53e-07 | 39 |
| GO:000919917 | Esophagus | HGIN | ribonucleoside triphosphate metabolic process | 33/2587 | 89/18723 | 3.42e-08 | 1.97e-06 | 33 |
| GO:000914218 | Esophagus | HGIN | nucleoside triphosphate biosynthetic process | 32/2587 | 85/18723 | 3.61e-08 | 2.04e-06 | 32 |
| GO:000915219 | Esophagus | HGIN | purine ribonucleotide biosynthetic process | 43/2587 | 169/18723 | 3.94e-05 | 9.74e-04 | 43 |
| GO:004639019 | Esophagus | HGIN | ribose phosphate biosynthetic process | 46/2587 | 190/18723 | 8.06e-05 | 1.79e-03 | 46 |
| GO:007252216 | Esophagus | HGIN | purine-containing compound biosynthetic process | 47/2587 | 200/18723 | 1.46e-04 | 2.91e-03 | 47 |
| GO:000616416 | Esophagus | HGIN | purine nucleotide biosynthetic process | 45/2587 | 191/18723 | 1.87e-04 | 3.52e-03 | 45 |
| GO:000926019 | Esophagus | HGIN | ribonucleotide biosynthetic process | 43/2587 | 182/18723 | 2.41e-04 | 4.33e-03 | 43 |
| GO:000911720 | Esophagus | HGIN | nucleotide metabolic process | 92/2587 | 489/18723 | 1.11e-03 | 1.36e-02 | 92 |
| GO:00091659 | Esophagus | HGIN | nucleotide biosynthetic process | 53/2587 | 254/18723 | 1.24e-03 | 1.49e-02 | 53 |
| GO:000675320 | Esophagus | HGIN | nucleoside phosphate metabolic process | 93/2587 | 497/18723 | 1.25e-03 | 1.49e-02 | 93 |
| GO:19012939 | Esophagus | HGIN | nucleoside phosphate biosynthetic process | 53/2587 | 256/18723 | 1.49e-03 | 1.73e-02 | 53 |
| GO:000915026 | Esophagus | HGIN | purine ribonucleotide metabolic process | 71/2587 | 368/18723 | 2.00e-03 | 2.11e-02 | 71 |
| GO:000616325 | Esophagus | HGIN | purine nucleotide metabolic process | 75/2587 | 396/18723 | 2.53e-03 | 2.51e-02 | 75 |
| GO:001969320 | Esophagus | HGIN | ribose phosphate metabolic process | 75/2587 | 396/18723 | 2.53e-03 | 2.51e-02 | 75 |
| Page: 1 2 3 4 5 6 7 8 9 10 11 |
| Pathway ID | Tissue | Disease Stage | Description | Gene Ratio | Bg Ratio | pvalue | p.adjust | qvalue | Count |
| hsa012325 | Esophagus | ESCC | Nucleotide metabolism | 59/4205 | 85/8465 | 1.67e-04 | 6.58e-04 | 3.37e-04 | 59 |
| hsa0123212 | Esophagus | ESCC | Nucleotide metabolism | 59/4205 | 85/8465 | 1.67e-04 | 6.58e-04 | 3.37e-04 | 59 |
| hsa012322 | Liver | HCC | Nucleotide metabolism | 59/4020 | 85/8465 | 3.30e-05 | 1.88e-04 | 1.04e-04 | 59 |
| hsa009832 | Liver | HCC | Drug metabolism - other enzymes | 54/4020 | 80/8465 | 2.25e-04 | 1.09e-03 | 6.08e-04 | 54 |
| hsa012323 | Liver | HCC | Nucleotide metabolism | 59/4020 | 85/8465 | 3.30e-05 | 1.88e-04 | 1.04e-04 | 59 |
| hsa009833 | Liver | HCC | Drug metabolism - other enzymes | 54/4020 | 80/8465 | 2.25e-04 | 1.09e-03 | 6.08e-04 | 54 |
| hsa012324 | Oral cavity | OSCC | Nucleotide metabolism | 54/3704 | 85/8465 | 1.78e-04 | 5.95e-04 | 3.03e-04 | 54 |
| hsa0123211 | Oral cavity | OSCC | Nucleotide metabolism | 54/3704 | 85/8465 | 1.78e-04 | 5.95e-04 | 3.03e-04 | 54 |
| hsa0123221 | Oral cavity | LP | Nucleotide metabolism | 42/2418 | 85/8465 | 3.62e-05 | 2.36e-04 | 1.52e-04 | 42 |
| hsa0123231 | Oral cavity | LP | Nucleotide metabolism | 42/2418 | 85/8465 | 3.62e-05 | 2.36e-04 | 1.52e-04 | 42 |
| Page: 1 |
Top |
Cell-cell communication analysis |
| Identification of potential cell-cell interactions between two cell types and their ligand-receptor pairs for different disease states |
| Ligand | Receptor | LRpair | Pathway | Tissue | Disease Stage |
| Page: 1 |
Top |
Single-cell gene regulatory network inference analysis |
| Find out the significant the regulons (TFs) and the target genes of each regulon across cell types for different disease states |
| TF | Cell Type | Tissue | Disease Stage | Target Gene | RSS | Regulon Activity |
| ∗The dot plots of a searched regulon are shown for all cell subpopulations in each disease state of each tissue based on the regulon specific score inferred using pySCENIC and by calculating the average expression. |
| Page: 1 |
Top |
Somatic mutation of malignant transformation related genes |
| Annotation of somatic variants for genes involved in malignant transformation |
| Hugo Symbol | Variant Class | Variant Classification | dbSNP RS | HGVSc | HGVSp | HGVSp Short | SWISSPROT | BIOTYPE | SIFT | PolyPhen | Tumor Sample Barcode | Tissue | Histology | Sex | Age | Stage | Therapy Types | Drugs | Outcome |
| IMPDH1 | SNV | Missense_Mutation | novel | c.157G>A | p.Asp53Asn | p.D53N | P20839 | protein_coding | tolerated_low_confidence(0.97) | benign(0.003) | TCGA-AN-A046-01 | Breast | breast invasive carcinoma | Female | >=65 | I/II | Unknown | Unknown | SD |
| IMPDH1 | SNV | Missense_Mutation | c.410C>A | p.Thr137Asn | p.T137N | P20839 | protein_coding | tolerated(0.07) | benign(0.055) | TCGA-AR-A0U2-01 | Breast | breast invasive carcinoma | Female | <65 | III/IV | Hormone Therapy | tamoxiphen | PD | |
| IMPDH1 | SNV | Missense_Mutation | rs373444002 | c.1552G>A | p.Glu518Lys | p.E518K | P20839 | protein_coding | deleterious(0.01) | possibly_damaging(0.871) | TCGA-BH-A0HF-01 | Breast | breast invasive carcinoma | Female | >=65 | I/II | Hormone Therapy | arimidex | SD |
| IMPDH1 | SNV | Missense_Mutation | c.907N>G | p.Leu303Val | p.L303V | P20839 | protein_coding | tolerated(0.07) | possibly_damaging(0.773) | TCGA-BH-A18V-01 | Breast | breast invasive carcinoma | Female | <65 | I/II | Unknown | Unknown | SD | |
| IMPDH1 | insertion | Frame_Shift_Ins | novel | c.170_171insTGGGGGTGGTCTGGGGGAATTAG | p.Pro58GlyfsTer41 | p.P58Gfs*41 | P20839 | protein_coding | TCGA-B6-A0RE-01 | Breast | breast invasive carcinoma | Female | <65 | I/II | Unknown | Unknown | SD | ||
| IMPDH1 | SNV | Missense_Mutation | rs201071873 | c.737N>A | p.Arg246Gln | p.R246Q | P20839 | protein_coding | deleterious(0.02) | benign(0.426) | TCGA-DS-A5RQ-01 | Cervix | cervical & endocervical cancer | Female | >=65 | I/II | Chemotherapy | cisplatin | CR |
| IMPDH1 | SNV | Missense_Mutation | rs773472205 | c.1318N>T | p.Arg440Trp | p.R440W | P20839 | protein_coding | deleterious(0.02) | probably_damaging(0.931) | TCGA-EA-A410-01 | Cervix | cervical & endocervical cancer | Female | <65 | I/II | Unknown | Unknown | SD |
| IMPDH1 | SNV | Missense_Mutation | c.378N>G | p.Phe126Leu | p.F126L | P20839 | protein_coding | tolerated(0.07) | benign(0.029) | TCGA-JW-A5VJ-01 | Cervix | cervical & endocervical cancer | Female | <65 | I/II | Unknown | Unknown | PD | |
| IMPDH1 | SNV | Missense_Mutation | rs756300430 | c.1351G>A | p.Gly451Ser | p.G451S | P20839 | protein_coding | deleterious(0) | probably_damaging(0.953) | TCGA-VS-A94Z-01 | Cervix | cervical & endocervical cancer | Female | <65 | I/II | Chemotherapy | cisplatin | CR |
| IMPDH1 | SNV | Missense_Mutation | rs771930753 | c.661N>T | p.Arg221Trp | p.R221W | P20839 | protein_coding | deleterious(0.02) | possibly_damaging(0.849) | TCGA-AZ-4681-01 | Colorectum | colon adenocarcinoma | Female | >=65 | I/II | Unknown | Unknown | SD |
| Page: 1 2 3 4 5 6 |
Top |
Related drugs of malignant transformation related genes |
| Identification of chemicals and drugs interact with genes involved in malignant transfromation |
| (DGIdb 4.0) |
| Entrez ID | Symbol | Category | Interaction Types | Drug Claim Name | Drug Name | PMIDs |
| 3614 | IMPDH1 | ENZYME, DRUGGABLE GENOME | Ribavirin | RIBAVIRIN | ||
| 3614 | IMPDH1 | ENZYME, DRUGGABLE GENOME | Urea and carbamate bioisostere derivative 11 | |||
| 3614 | IMPDH1 | ENZYME, DRUGGABLE GENOME | PMID28074661-Compound-US20100022547C80 | |||
| 3614 | IMPDH1 | ENZYME, DRUGGABLE GENOME | PMID28074661-Compound-US20100022547C86 | |||
| 3614 | IMPDH1 | ENZYME, DRUGGABLE GENOME | PMID28074661-Compound-US20169447134C85 | |||
| 3614 | IMPDH1 | ENZYME, DRUGGABLE GENOME | Mycophenolic acid/nucleotide derivative 6 | |||
| 3614 | IMPDH1 | ENZYME, DRUGGABLE GENOME | Urea and carbamate bioisostere derivative 15 | |||
| 3614 | IMPDH1 | ENZYME, DRUGGABLE GENOME | VX-944 | |||
| 3614 | IMPDH1 | ENZYME, DRUGGABLE GENOME | Mercaptopurine | MERCAPTOPURINE | ||
| 3614 | IMPDH1 | ENZYME, DRUGGABLE GENOME | PMID28074661-Compound-US20128202889C90 |
| Page: 1 2 3 4 5 6 7 8 |

Copyright 2023-Present -The University of Texas Health Science Center at Houston |