
|
|||||
|
 | |
| |
| |
| |
| |
| |
|
Gene: IMPACT |
Gene summary for IMPACT |
| Gene information | Species | Human | Gene symbol | IMPACT | Gene ID | 55364 |
| Gene name | impact RWD domain protein | |
| Gene Alias | RWDD5 | |
| Cytomap | 18q11.2 | |
| Gene Type | protein-coding | GO ID | GO:0000122 | UniProtAcc | A0A024RC24 |
Top |
Malignant transformation analysis |
| Identification of the aberrant gene expression in precancerous and cancerous lesions by comparing the gene expression of stem-like cells in diseased tissues with normal stem cells |
| Entrez ID | Symbol | Replicates | Species | Organ | Tissue | Adj P-value | Log2FC | Malignancy |
| 55364 | IMPACT | LZE2T | Human | Esophagus | ESCC | 1.34e-05 | 7.14e-01 | 0.082 |
| 55364 | IMPACT | LZE4T | Human | Esophagus | ESCC | 7.96e-07 | 2.07e-01 | 0.0811 |
| 55364 | IMPACT | LZE5T | Human | Esophagus | ESCC | 2.22e-04 | 2.16e-01 | 0.0514 |
| 55364 | IMPACT | LZE7T | Human | Esophagus | ESCC | 3.32e-02 | 2.03e-01 | 0.0667 |
| 55364 | IMPACT | LZE8T | Human | Esophagus | ESCC | 1.28e-03 | 1.26e-01 | 0.067 |
| 55364 | IMPACT | LZE20T | Human | Esophagus | ESCC | 9.91e-04 | 1.44e-01 | 0.0662 |
| 55364 | IMPACT | LZE22T | Human | Esophagus | ESCC | 1.17e-02 | 2.16e-01 | 0.068 |
| 55364 | IMPACT | LZE24T | Human | Esophagus | ESCC | 7.27e-09 | 3.34e-01 | 0.0596 |
| 55364 | IMPACT | P1T-E | Human | Esophagus | ESCC | 3.45e-12 | 3.51e-01 | 0.0875 |
| 55364 | IMPACT | P2T-E | Human | Esophagus | ESCC | 1.60e-31 | 5.94e-01 | 0.1177 |
| 55364 | IMPACT | P4T-E | Human | Esophagus | ESCC | 8.47e-29 | 7.00e-01 | 0.1323 |
| 55364 | IMPACT | P5T-E | Human | Esophagus | ESCC | 9.40e-21 | 3.90e-01 | 0.1327 |
| 55364 | IMPACT | P8T-E | Human | Esophagus | ESCC | 3.37e-18 | 3.07e-01 | 0.0889 |
| 55364 | IMPACT | P9T-E | Human | Esophagus | ESCC | 1.02e-16 | 5.09e-01 | 0.1131 |
| 55364 | IMPACT | P10T-E | Human | Esophagus | ESCC | 2.61e-25 | 4.89e-01 | 0.116 |
| 55364 | IMPACT | P11T-E | Human | Esophagus | ESCC | 1.75e-03 | 1.29e-01 | 0.1426 |
| 55364 | IMPACT | P12T-E | Human | Esophagus | ESCC | 1.53e-19 | 3.95e-01 | 0.1122 |
| 55364 | IMPACT | P15T-E | Human | Esophagus | ESCC | 3.28e-27 | 5.70e-01 | 0.1149 |
| 55364 | IMPACT | P16T-E | Human | Esophagus | ESCC | 3.88e-28 | 5.50e-01 | 0.1153 |
| 55364 | IMPACT | P17T-E | Human | Esophagus | ESCC | 2.39e-06 | 4.06e-01 | 0.1278 |
| Page: 1 2 3 4 5 6 |
| Tissue | Expression Dynamics | Abbreviation |
| Esophagus | 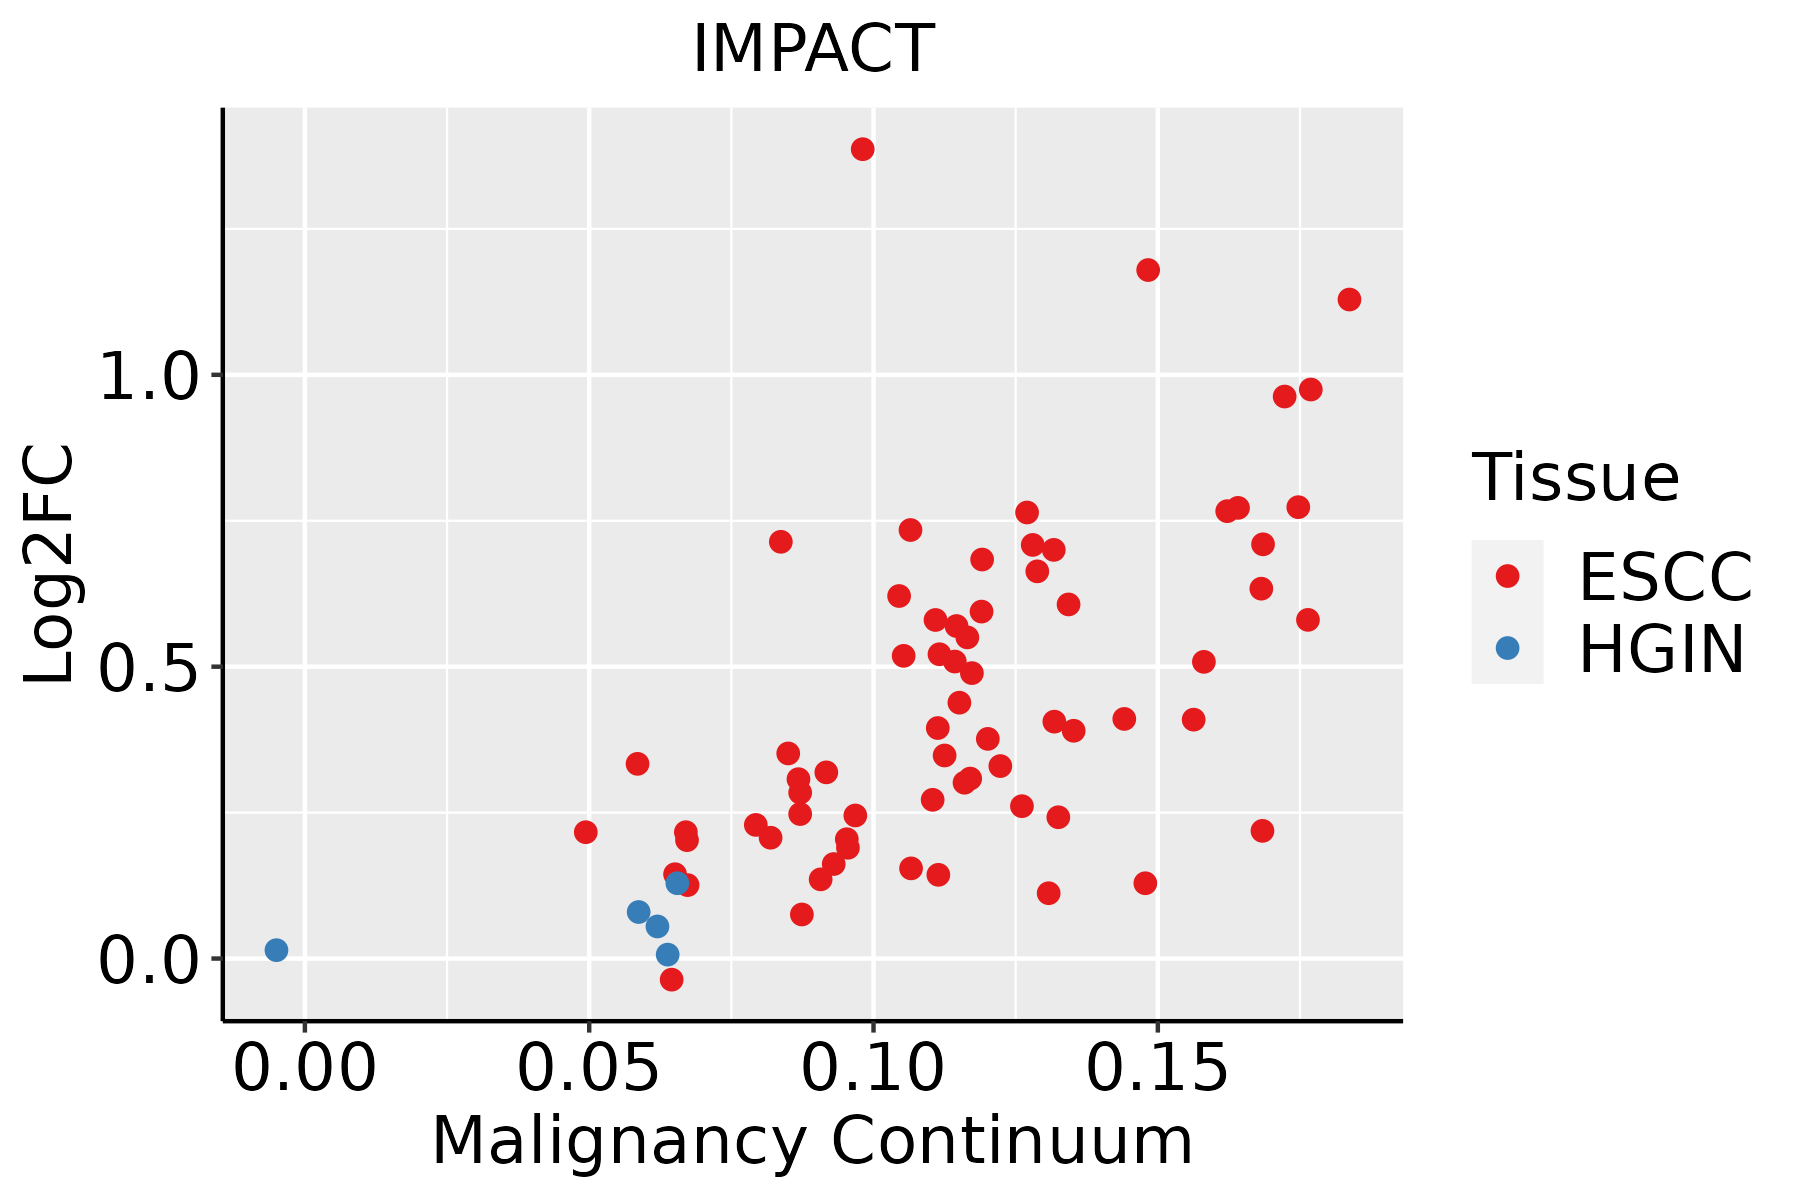 | ESCC: Esophageal squamous cell carcinoma |
| HGIN: High-grade intraepithelial neoplasias | ||
| LGIN: Low-grade intraepithelial neoplasias | ||
| Liver | 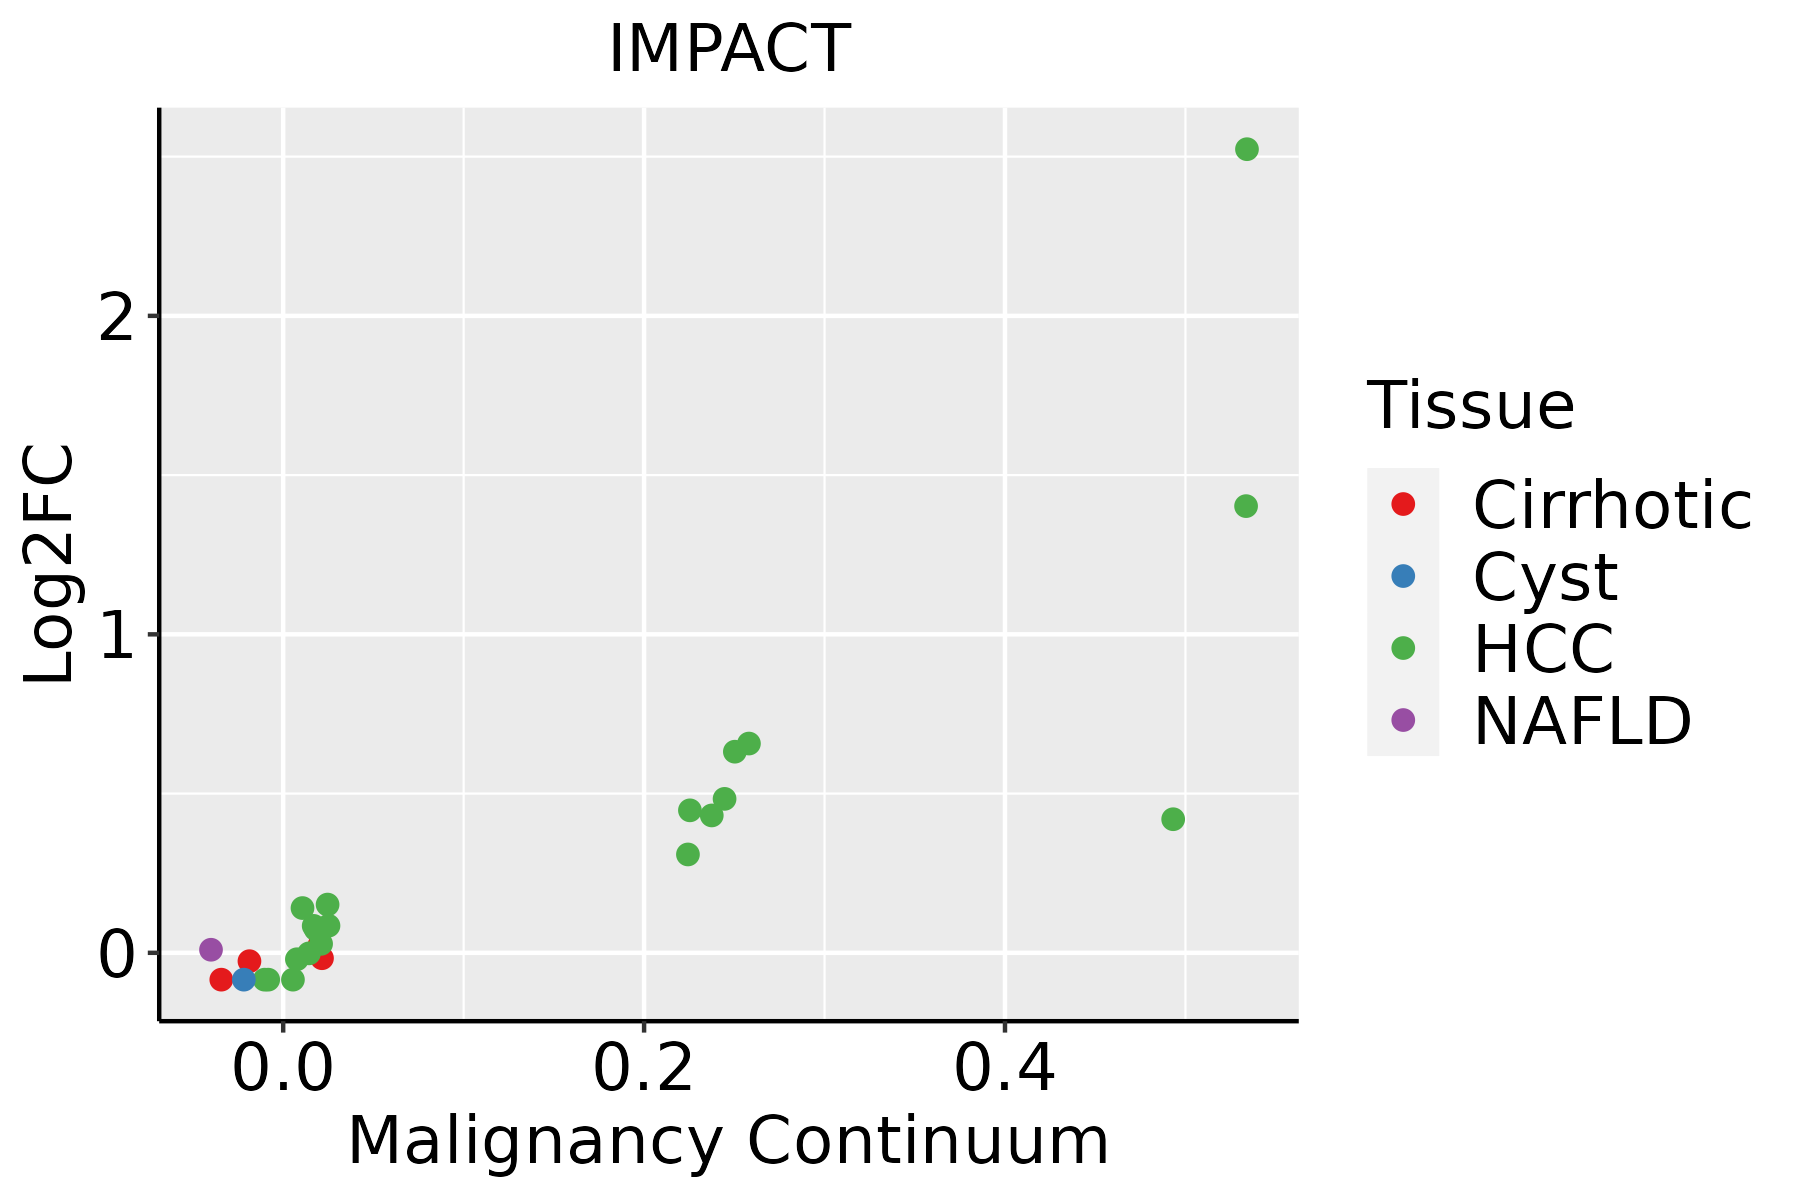 | HCC: Hepatocellular carcinoma |
| NAFLD: Non-alcoholic fatty liver disease | ||
| Oral Cavity | 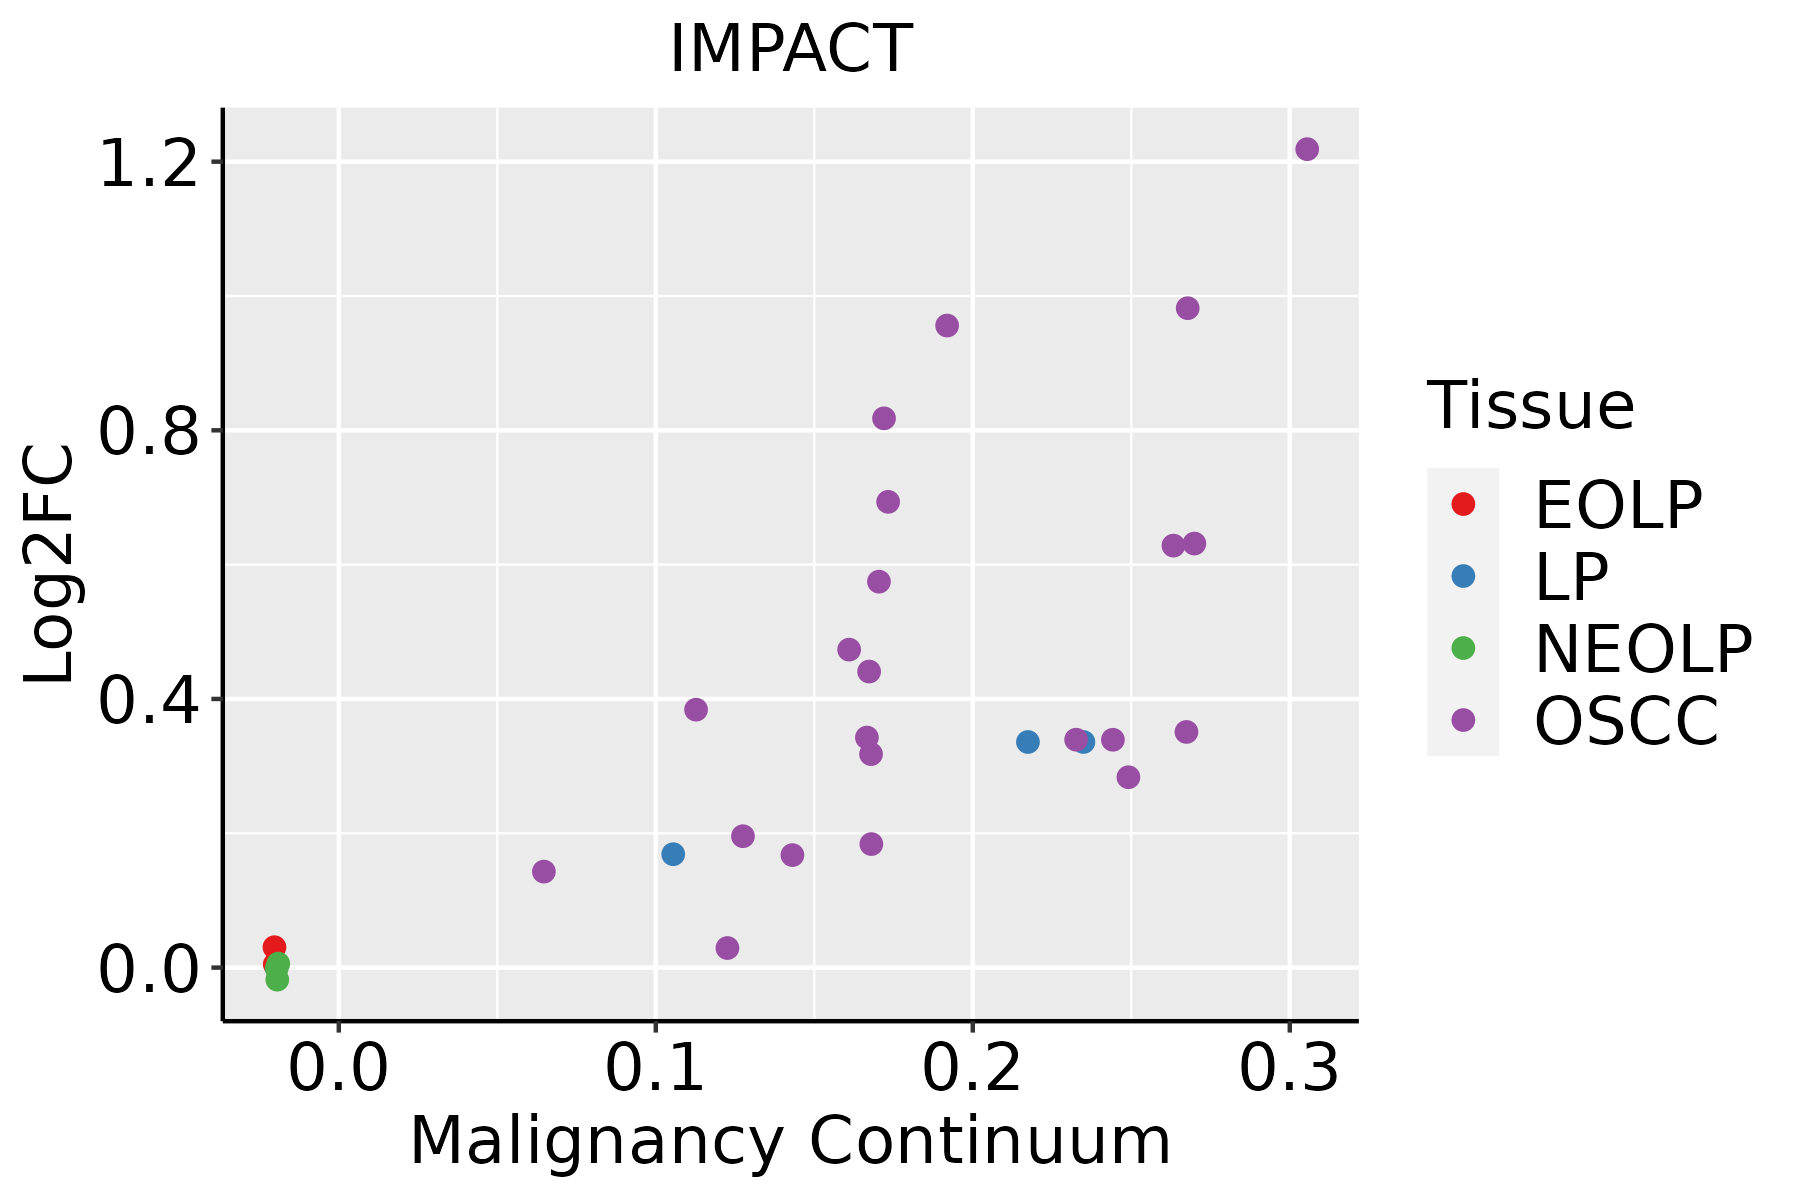 | EOLP: Erosive Oral lichen planus |
| LP: leukoplakia | ||
| NEOLP: Non-erosive oral lichen planus | ||
| OSCC: Oral squamous cell carcinoma | ||
| Skin | 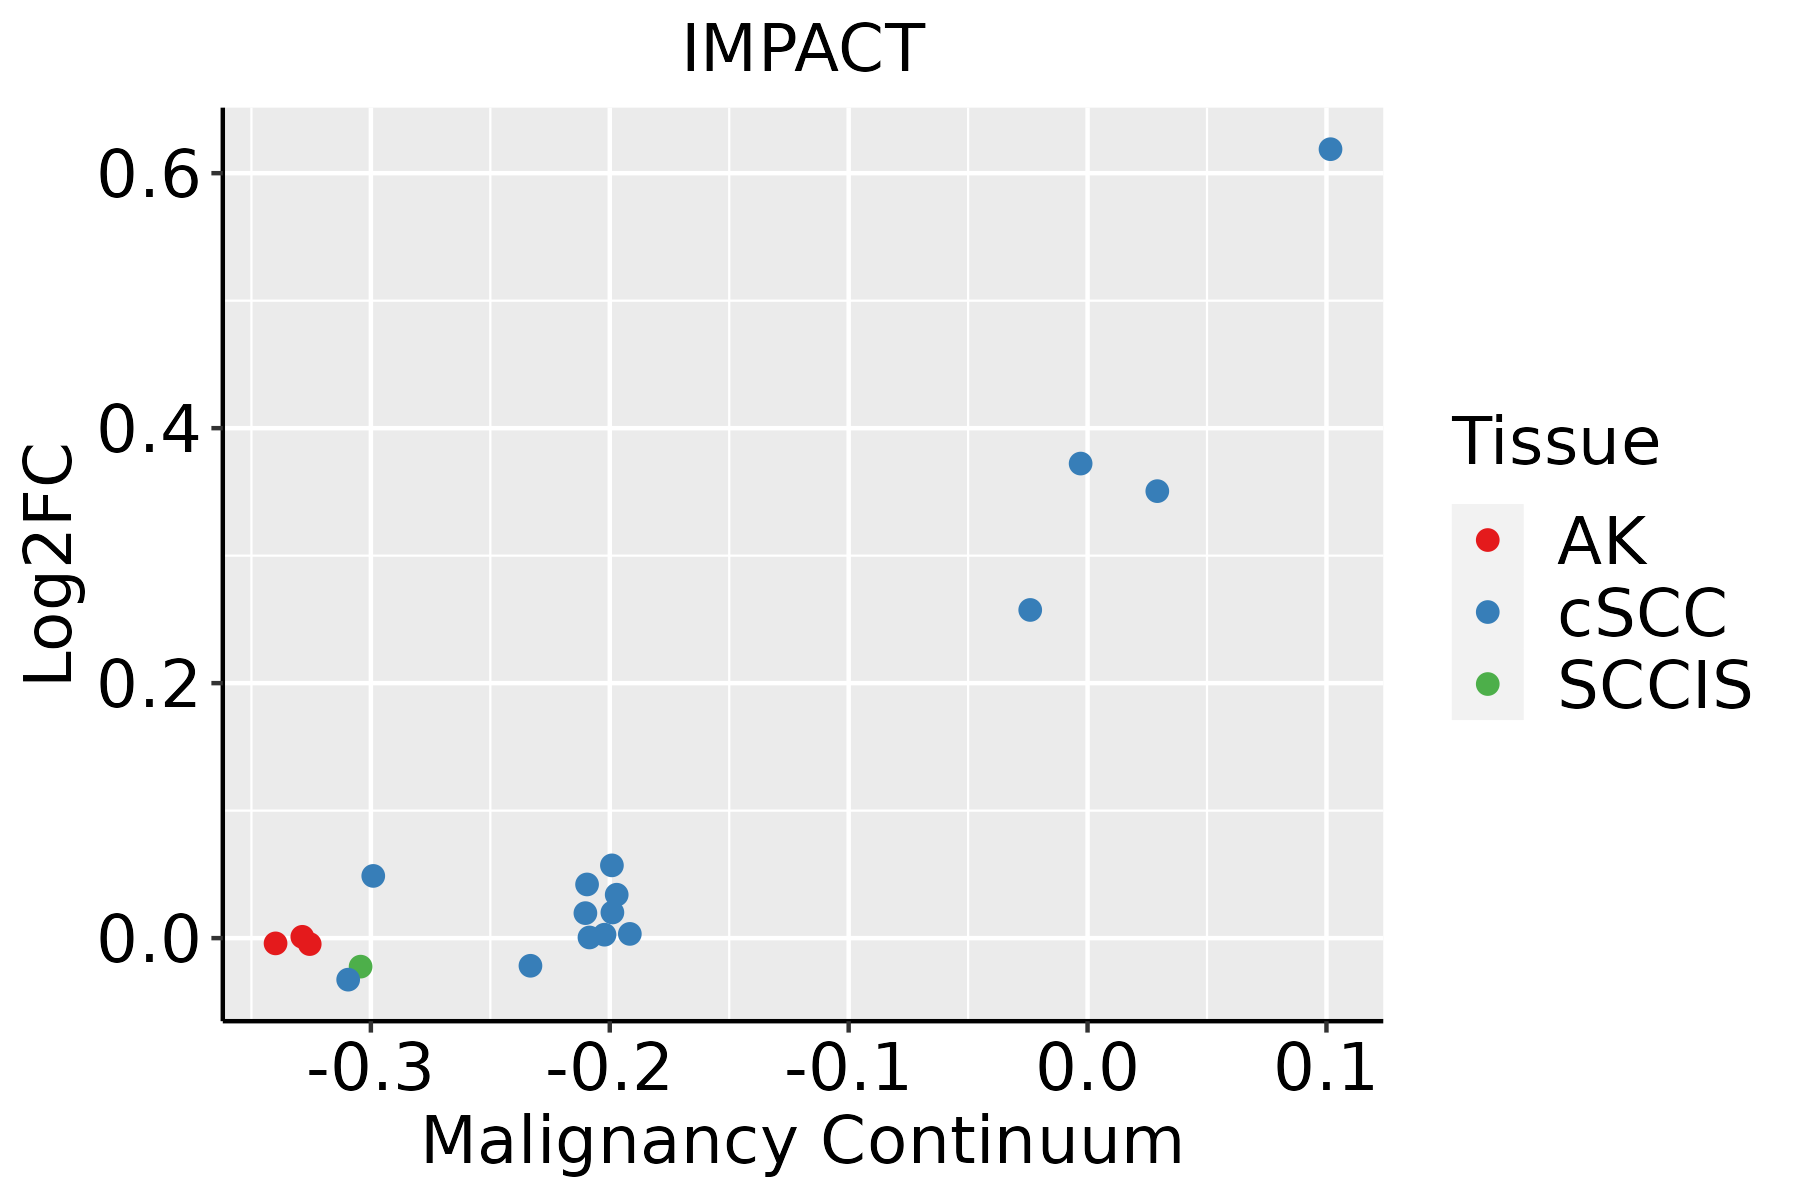 | AK: Actinic keratosis |
| cSCC: Cutaneous squamous cell carcinoma | ||
| SCCIS:squamous cell carcinoma in situ | ||
| Thyroid | 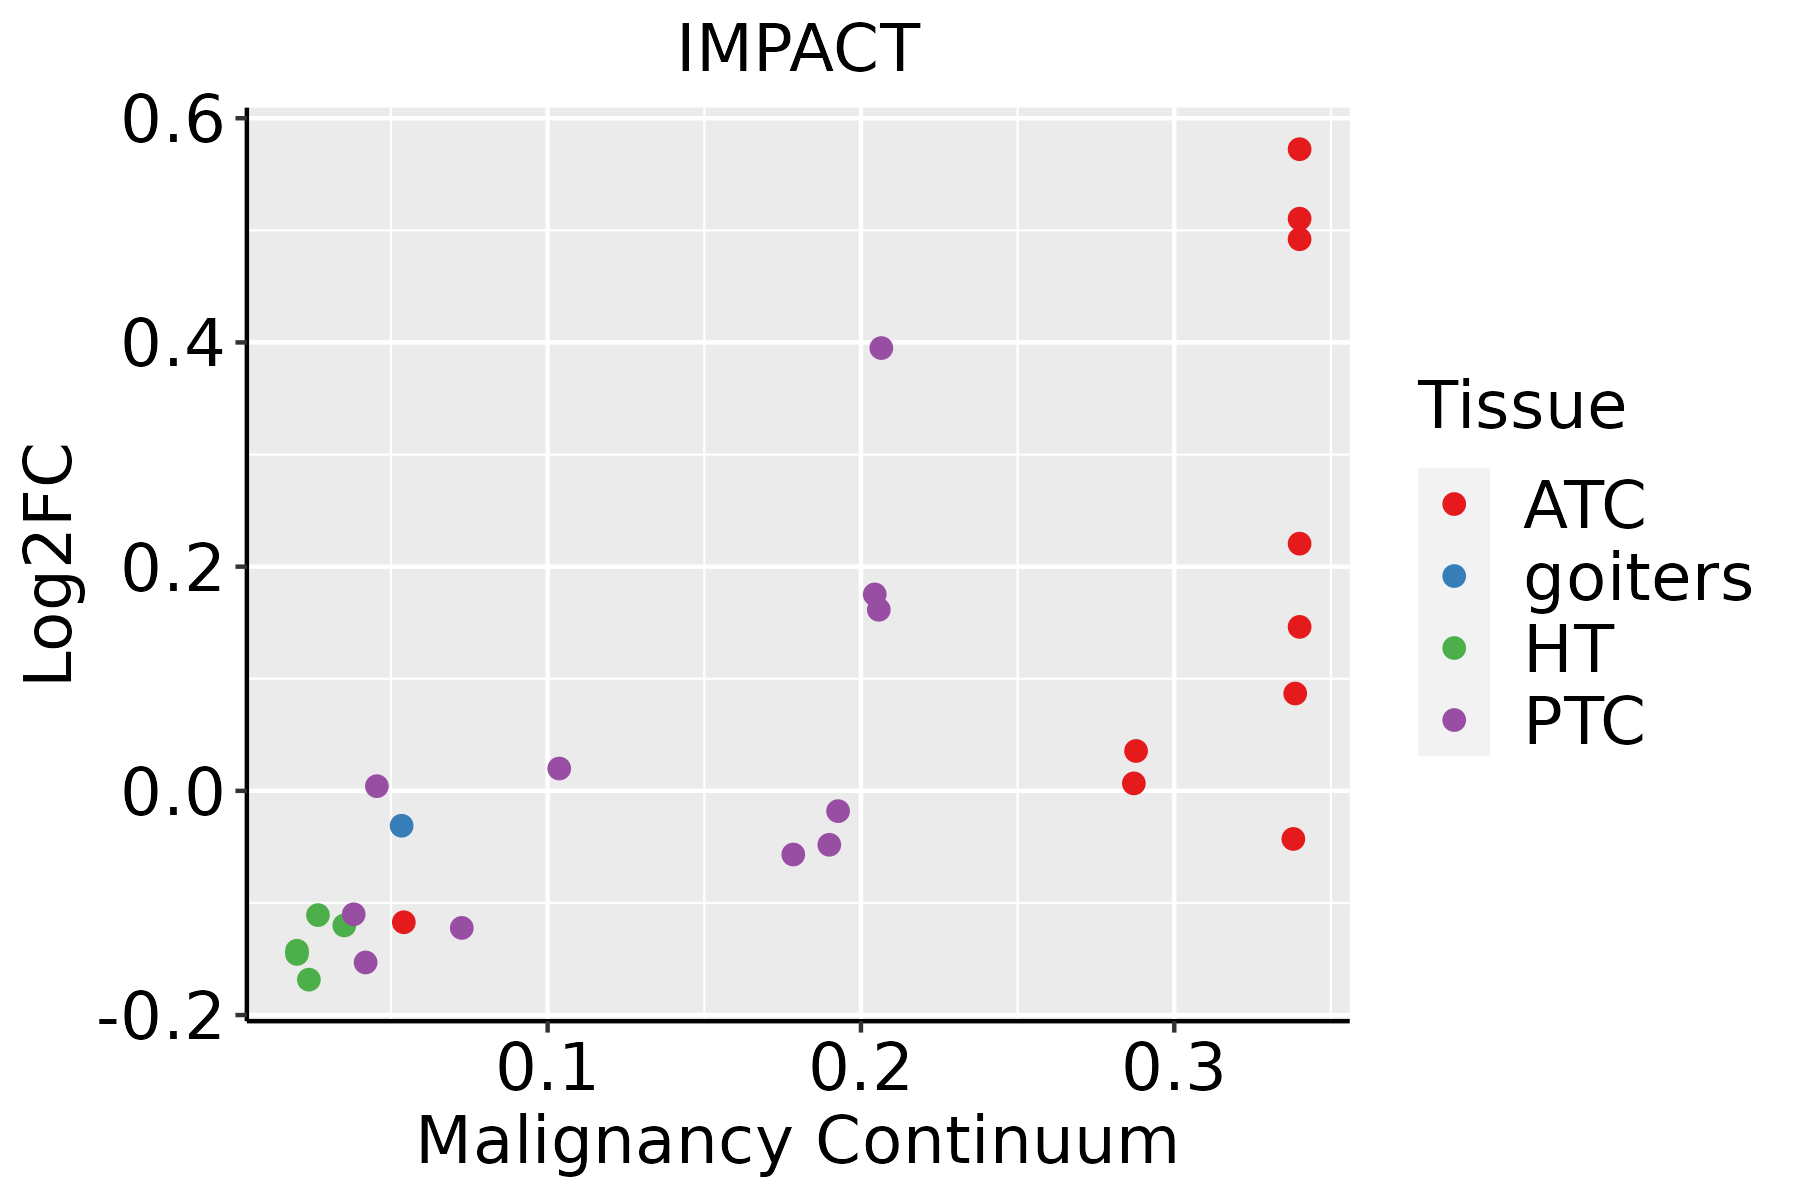 | ATC: Anaplastic thyroid cancer |
| HT: Hashimoto's thyroiditis | ||
| PTC: Papillary thyroid cancer |
| ∗log2FC in expression of this searched gene in stem-like cells from each diseased tissue sample relative to stem-like cells in normal samples in each tissue plotted against the malignancy continuum. Samples are colored based on if they are from different disease stage. |
Top |
Malignant transformation related pathway analysis |
| Find out the enriched GO biological processes and KEGG pathways involved in transition from healthy to precancer to cancer |
| Tissue | Disease Stage | Enriched GO biological Processes |
| Colorectum | AD |  |
| Colorectum | SER |  |
| Colorectum | MSS |  |
| Colorectum | MSI-H |  |
| Colorectum | FAP |  |
| ∗Top 15 enriched GO BP terms are showed in the bar plot of each disease state in each tissue. Each row represents a significant GO biological process which is colored according to the -log10(p.adjust). |
| Page: 1 2 3 4 5 6 7 8 9 |
| GO ID | Tissue | Disease Stage | Description | Gene Ratio | Bg Ratio | pvalue | p.adjust | Count |
| GO:0006979111 | Esophagus | ESCC | response to oxidative stress | 303/8552 | 446/18723 | 7.15e-22 | 1.30e-19 | 303 |
| GO:0062197111 | Esophagus | ESCC | cellular response to chemical stress | 234/8552 | 337/18723 | 5.37e-19 | 5.97e-17 | 234 |
| GO:0006413110 | Esophagus | ESCC | translational initiation | 100/8552 | 118/18723 | 1.16e-18 | 1.25e-16 | 100 |
| GO:0006417111 | Esophagus | ESCC | regulation of translation | 304/8552 | 468/18723 | 1.53e-17 | 1.33e-15 | 304 |
| GO:0043254111 | Esophagus | ESCC | regulation of protein-containing complex assembly | 278/8552 | 428/18723 | 3.81e-16 | 2.77e-14 | 278 |
| GO:0045727111 | Esophagus | ESCC | positive regulation of translation | 107/8552 | 136/18723 | 2.79e-15 | 1.68e-13 | 107 |
| GO:000941113 | Esophagus | ESCC | response to UV | 115/8552 | 149/18723 | 3.29e-15 | 1.93e-13 | 115 |
| GO:0034250111 | Esophagus | ESCC | positive regulation of cellular amide metabolic process | 123/8552 | 162/18723 | 3.32e-15 | 1.93e-13 | 123 |
| GO:0034599111 | Esophagus | ESCC | cellular response to oxidative stress | 197/8552 | 288/18723 | 3.76e-15 | 2.15e-13 | 197 |
| GO:0071496111 | Esophagus | ESCC | cellular response to external stimulus | 215/8552 | 320/18723 | 4.29e-15 | 2.43e-13 | 215 |
| GO:0031668111 | Esophagus | ESCC | cellular response to extracellular stimulus | 168/8552 | 246/18723 | 4.93e-13 | 2.23e-11 | 168 |
| GO:0010563111 | Esophagus | ESCC | negative regulation of phosphorus metabolic process | 274/8552 | 442/18723 | 2.32e-12 | 9.41e-11 | 274 |
| GO:0045936111 | Esophagus | ESCC | negative regulation of phosphate metabolic process | 273/8552 | 441/18723 | 3.18e-12 | 1.25e-10 | 273 |
| GO:0031669110 | Esophagus | ESCC | cellular response to nutrient levels | 148/8552 | 215/18723 | 4.58e-12 | 1.76e-10 | 148 |
| GO:0031667111 | Esophagus | ESCC | response to nutrient levels | 289/8552 | 474/18723 | 9.25e-12 | 3.47e-10 | 289 |
| GO:000644617 | Esophagus | ESCC | regulation of translational initiation | 65/8552 | 79/18723 | 2.04e-11 | 7.07e-10 | 65 |
| GO:0000302111 | Esophagus | ESCC | response to reactive oxygen species | 150/8552 | 222/18723 | 3.06e-11 | 1.02e-09 | 150 |
| GO:000931419 | Esophagus | ESCC | response to radiation | 277/8552 | 456/18723 | 4.42e-11 | 1.43e-09 | 277 |
| GO:0016049110 | Esophagus | ESCC | cell growth | 289/8552 | 482/18723 | 1.29e-10 | 3.77e-09 | 289 |
| GO:0042326111 | Esophagus | ESCC | negative regulation of phosphorylation | 237/8552 | 385/18723 | 1.86e-10 | 5.33e-09 | 237 |
| Page: 1 2 3 4 5 6 7 8 9 10 11 12 13 14 15 16 |
| Pathway ID | Tissue | Disease Stage | Description | Gene Ratio | Bg Ratio | pvalue | p.adjust | qvalue | Count |
| Page: 1 |
Top |
Cell-cell communication analysis |
| Identification of potential cell-cell interactions between two cell types and their ligand-receptor pairs for different disease states |
| Ligand | Receptor | LRpair | Pathway | Tissue | Disease Stage |
| Page: 1 |
Top |
Single-cell gene regulatory network inference analysis |
| Find out the significant the regulons (TFs) and the target genes of each regulon across cell types for different disease states |
| TF | Cell Type | Tissue | Disease Stage | Target Gene | RSS | Regulon Activity |
| ∗The dot plots of a searched regulon are shown for all cell subpopulations in each disease state of each tissue based on the regulon specific score inferred using pySCENIC and by calculating the average expression. |
| Page: 1 |
Top |
Somatic mutation of malignant transformation related genes |
| Annotation of somatic variants for genes involved in malignant transformation |
| Hugo Symbol | Variant Class | Variant Classification | dbSNP RS | HGVSc | HGVSp | HGVSp Short | SWISSPROT | BIOTYPE | SIFT | PolyPhen | Tumor Sample Barcode | Tissue | Histology | Sex | Age | Stage | Therapy Types | Drugs | Outcome |
| IMPACT | SNV | Missense_Mutation | c.365N>G | p.Pro122Arg | p.P122R | Q9P2X3 | protein_coding | deleterious(0.03) | benign(0.074) | TCGA-A8-A075-01 | Breast | breast invasive carcinoma | Female | <65 | I/II | Chemotherapy | epirubicin | CR | |
| IMPACT | SNV | Missense_Mutation | c.76N>C | p.Glu26Gln | p.E26Q | Q9P2X3 | protein_coding | deleterious(0.01) | possibly_damaging(0.861) | TCGA-A8-A09G-01 | Breast | breast invasive carcinoma | Female | >=65 | III/IV | Unknown | Unknown | SD | |
| IMPACT | SNV | Missense_Mutation | novel | c.748N>T | p.His250Tyr | p.H250Y | Q9P2X3 | protein_coding | deleterious(0.03) | possibly_damaging(0.585) | TCGA-AC-A3TM-01 | Breast | breast invasive carcinoma | Female | <65 | III/IV | Chemotherapy | cytoxan | CR |
| IMPACT | deletion | Frame_Shift_Del | novel | c.435delN | p.Gln146SerfsTer20 | p.Q146Sfs*20 | Q9P2X3 | protein_coding | TCGA-EW-A2FV-01 | Breast | breast invasive carcinoma | Female | <65 | III/IV | Chemotherapy | docetaxel | SD | ||
| IMPACT | SNV | Missense_Mutation | c.130N>A | p.Asp44Asn | p.D44N | Q9P2X3 | protein_coding | tolerated(0.43) | benign(0.015) | TCGA-2W-A8YY-01 | Cervix | cervical & endocervical cancer | Female | <65 | I/II | Chemotherapy | cisplatin | CR | |
| IMPACT | SNV | Missense_Mutation | c.690N>T | p.Gln230His | p.Q230H | Q9P2X3 | protein_coding | tolerated(0.26) | benign(0.015) | TCGA-AA-3977-01 | Colorectum | colon adenocarcinoma | Male | >=65 | I/II | Unknown | Unknown | SD | |
| IMPACT | SNV | Missense_Mutation | c.171N>A | p.Met57Ile | p.M57I | Q9P2X3 | protein_coding | tolerated(1) | benign(0.003) | TCGA-AA-A00N-01 | Colorectum | colon adenocarcinoma | Male | >=65 | I/II | Unknown | Unknown | PD | |
| IMPACT | SNV | Missense_Mutation | c.941N>G | p.Asp314Gly | p.D314G | Q9P2X3 | protein_coding | deleterious_low_confidence(0.04) | benign(0.001) | TCGA-AA-A00N-01 | Colorectum | colon adenocarcinoma | Male | >=65 | I/II | Unknown | Unknown | PD | |
| IMPACT | SNV | Missense_Mutation | rs777647033 | c.541N>A | p.Asp181Asn | p.D181N | Q9P2X3 | protein_coding | deleterious(0) | probably_damaging(0.997) | TCGA-AZ-4315-01 | Colorectum | colon adenocarcinoma | Male | <65 | I/II | Unknown | Unknown | SD |
| IMPACT | SNV | Missense_Mutation | novel | c.542N>G | p.Asp181Gly | p.D181G | Q9P2X3 | protein_coding | deleterious(0) | probably_damaging(0.998) | TCGA-CA-6717-01 | Colorectum | colon adenocarcinoma | Male | <65 | I/II | Chemotherapy | oxaliplatin | CR |
| Page: 1 2 3 4 |
Top |
Related drugs of malignant transformation related genes |
| Identification of chemicals and drugs interact with genes involved in malignant transfromation |
| (DGIdb 4.0) |
| Entrez ID | Symbol | Category | Interaction Types | Drug Claim Name | Drug Name | PMIDs |
| Page: 1 |

Copyright 2023-Present -The University of Texas Health Science Center at Houston |