| Tissue | Expression Dynamics | Abbreviation |
| Colorectum (GSE201348) |  | FAP: Familial adenomatous polyposis |
| CRC: Colorectal cancer |
| Colorectum (HTA11) | 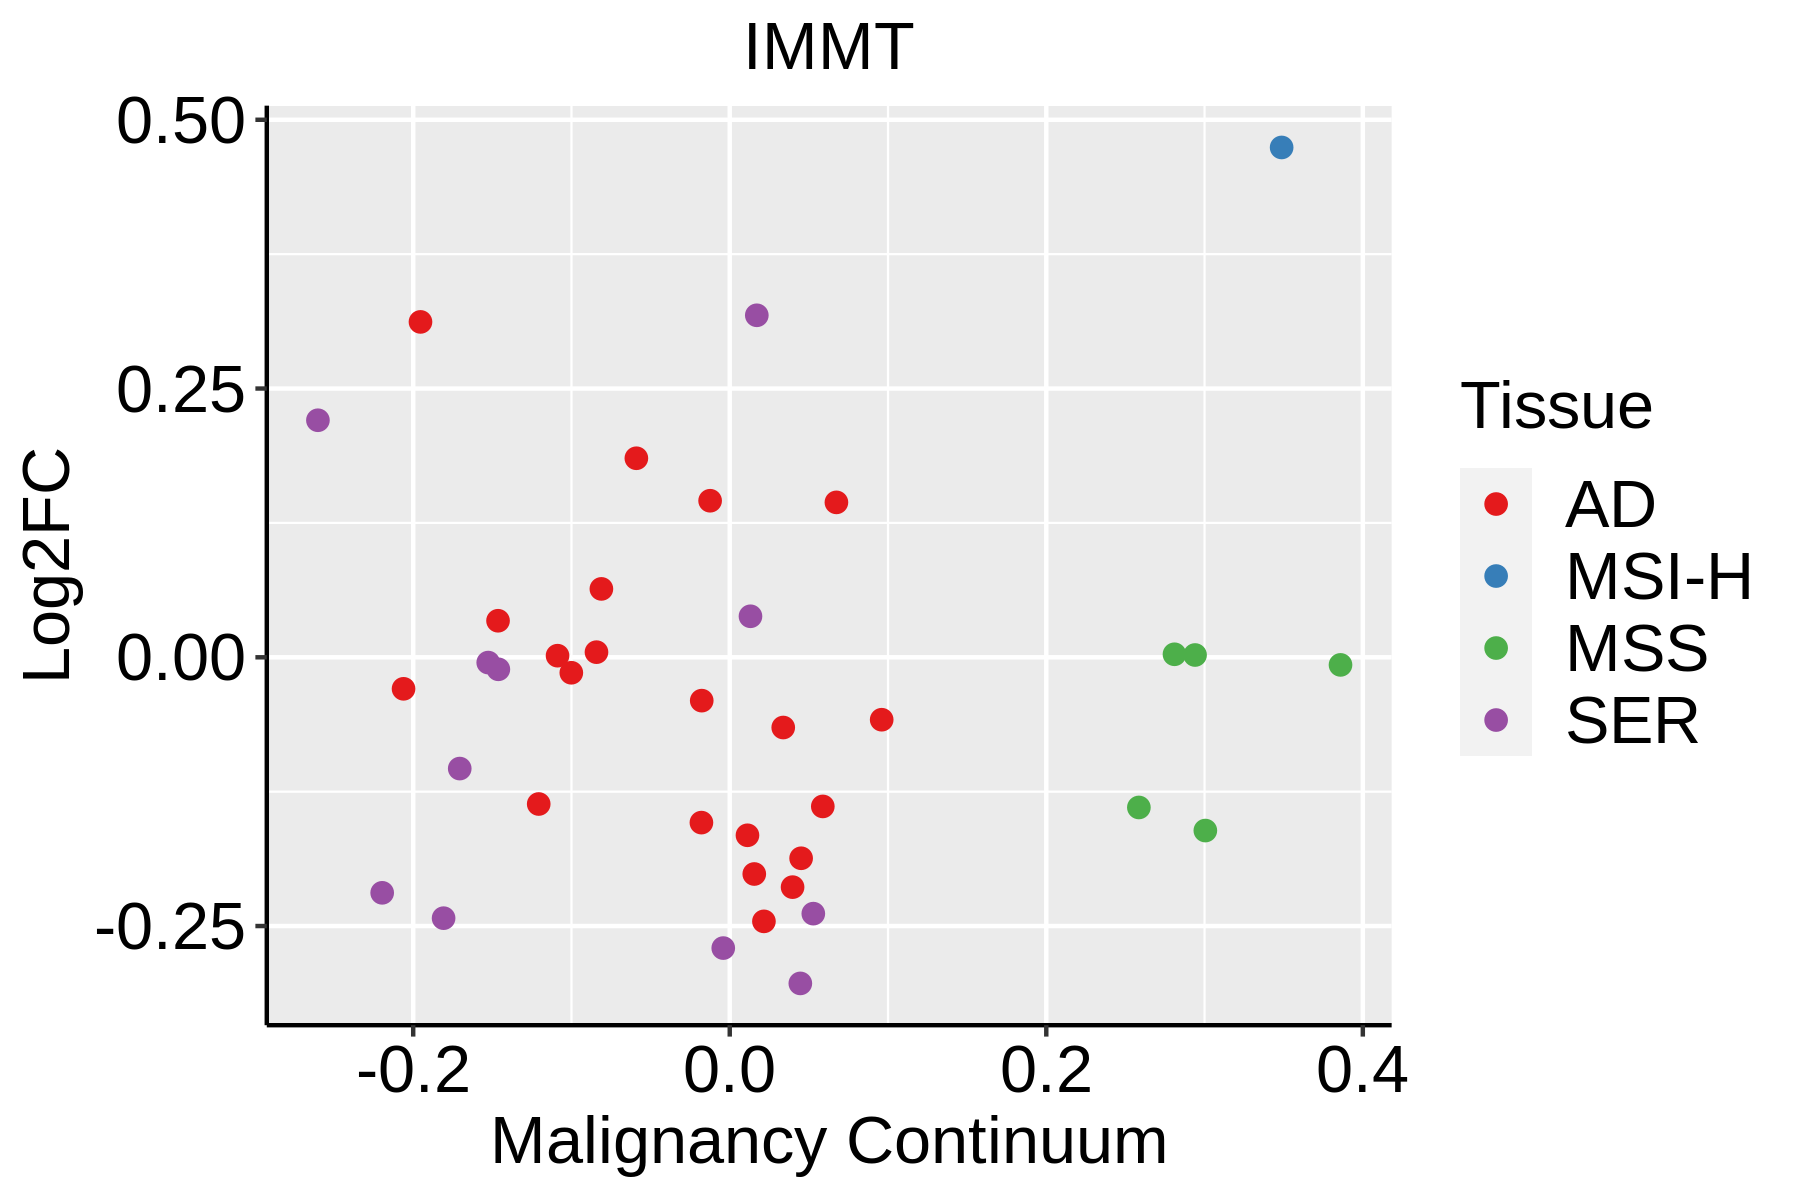 | AD: Adenomas |
| SER: Sessile serrated lesions |
| MSI-H: Microsatellite-high colorectal cancer |
| MSS: Microsatellite stable colorectal cancer |
| Esophagus | 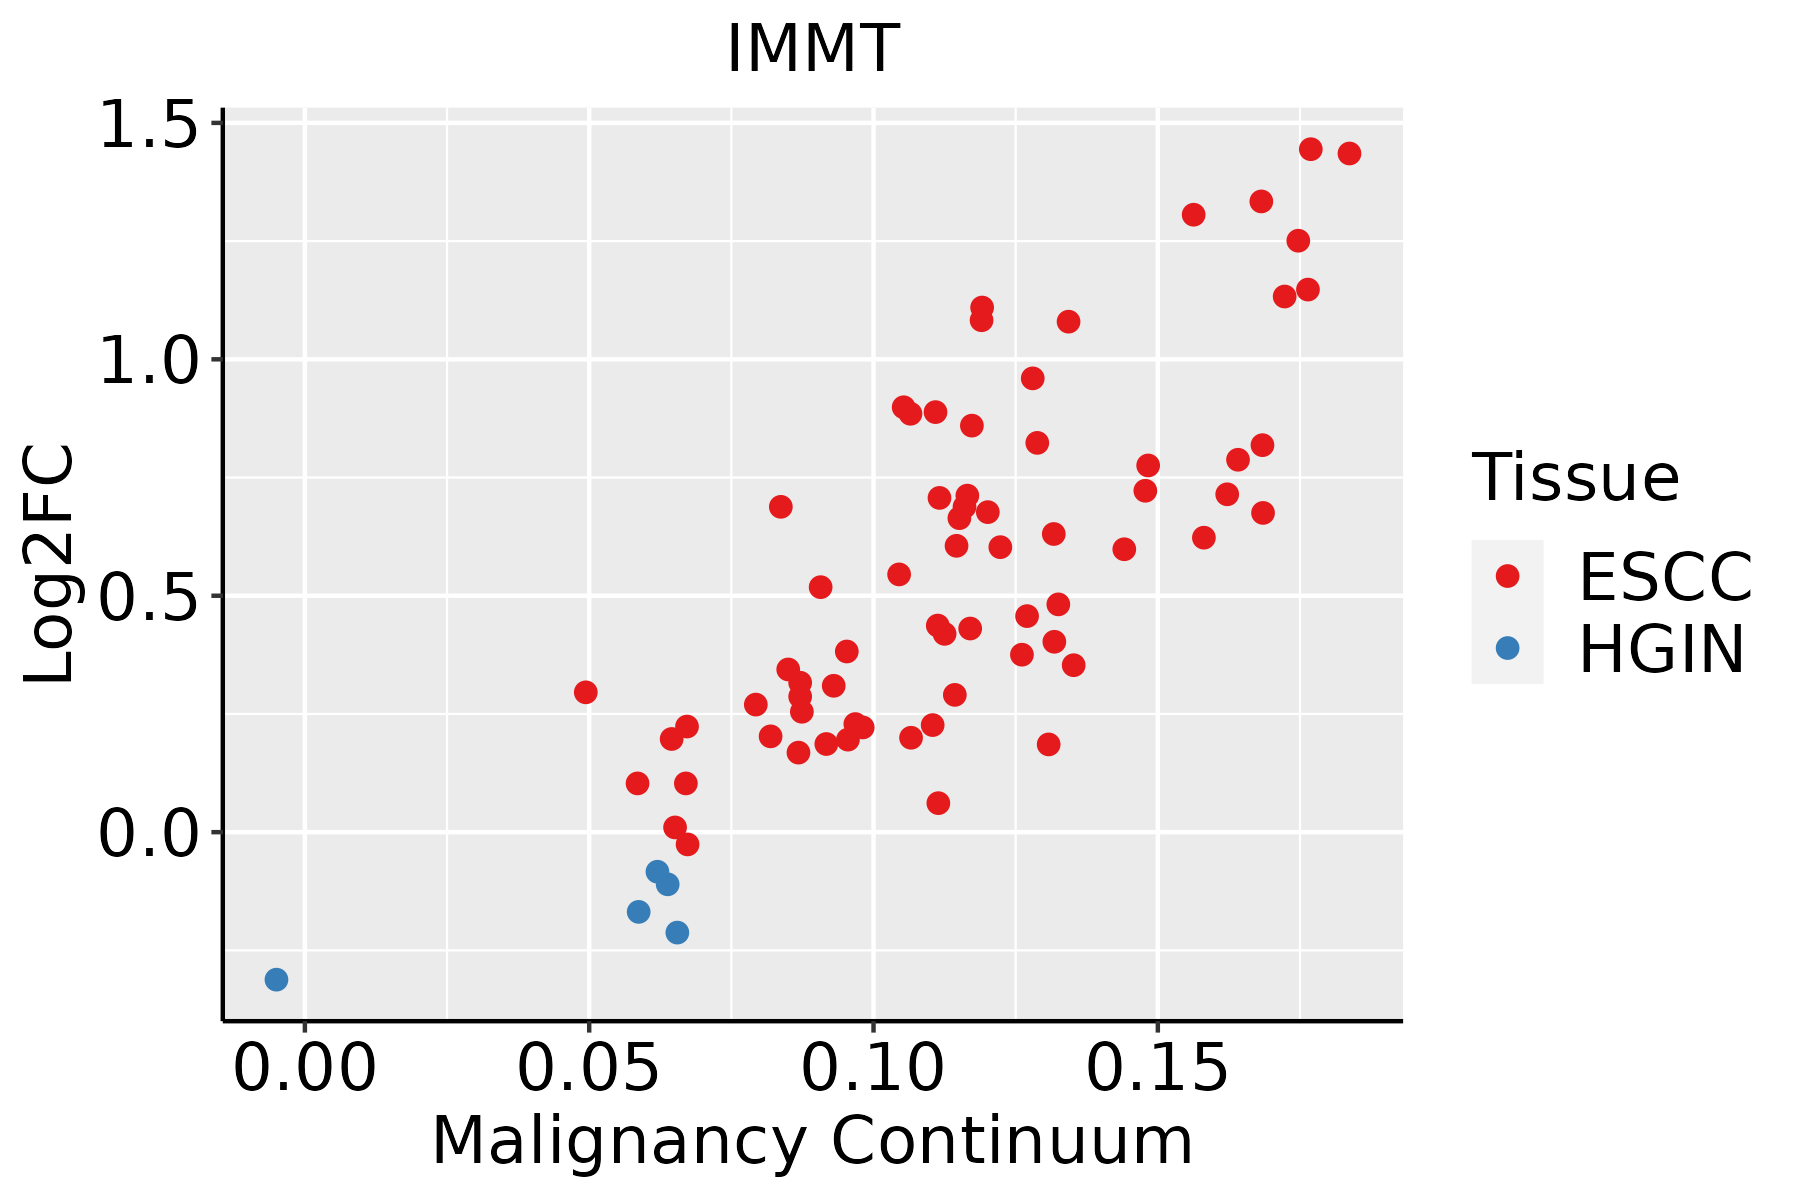 | ESCC: Esophageal squamous cell carcinoma |
| HGIN: High-grade intraepithelial neoplasias |
| LGIN: Low-grade intraepithelial neoplasias |
| Liver | 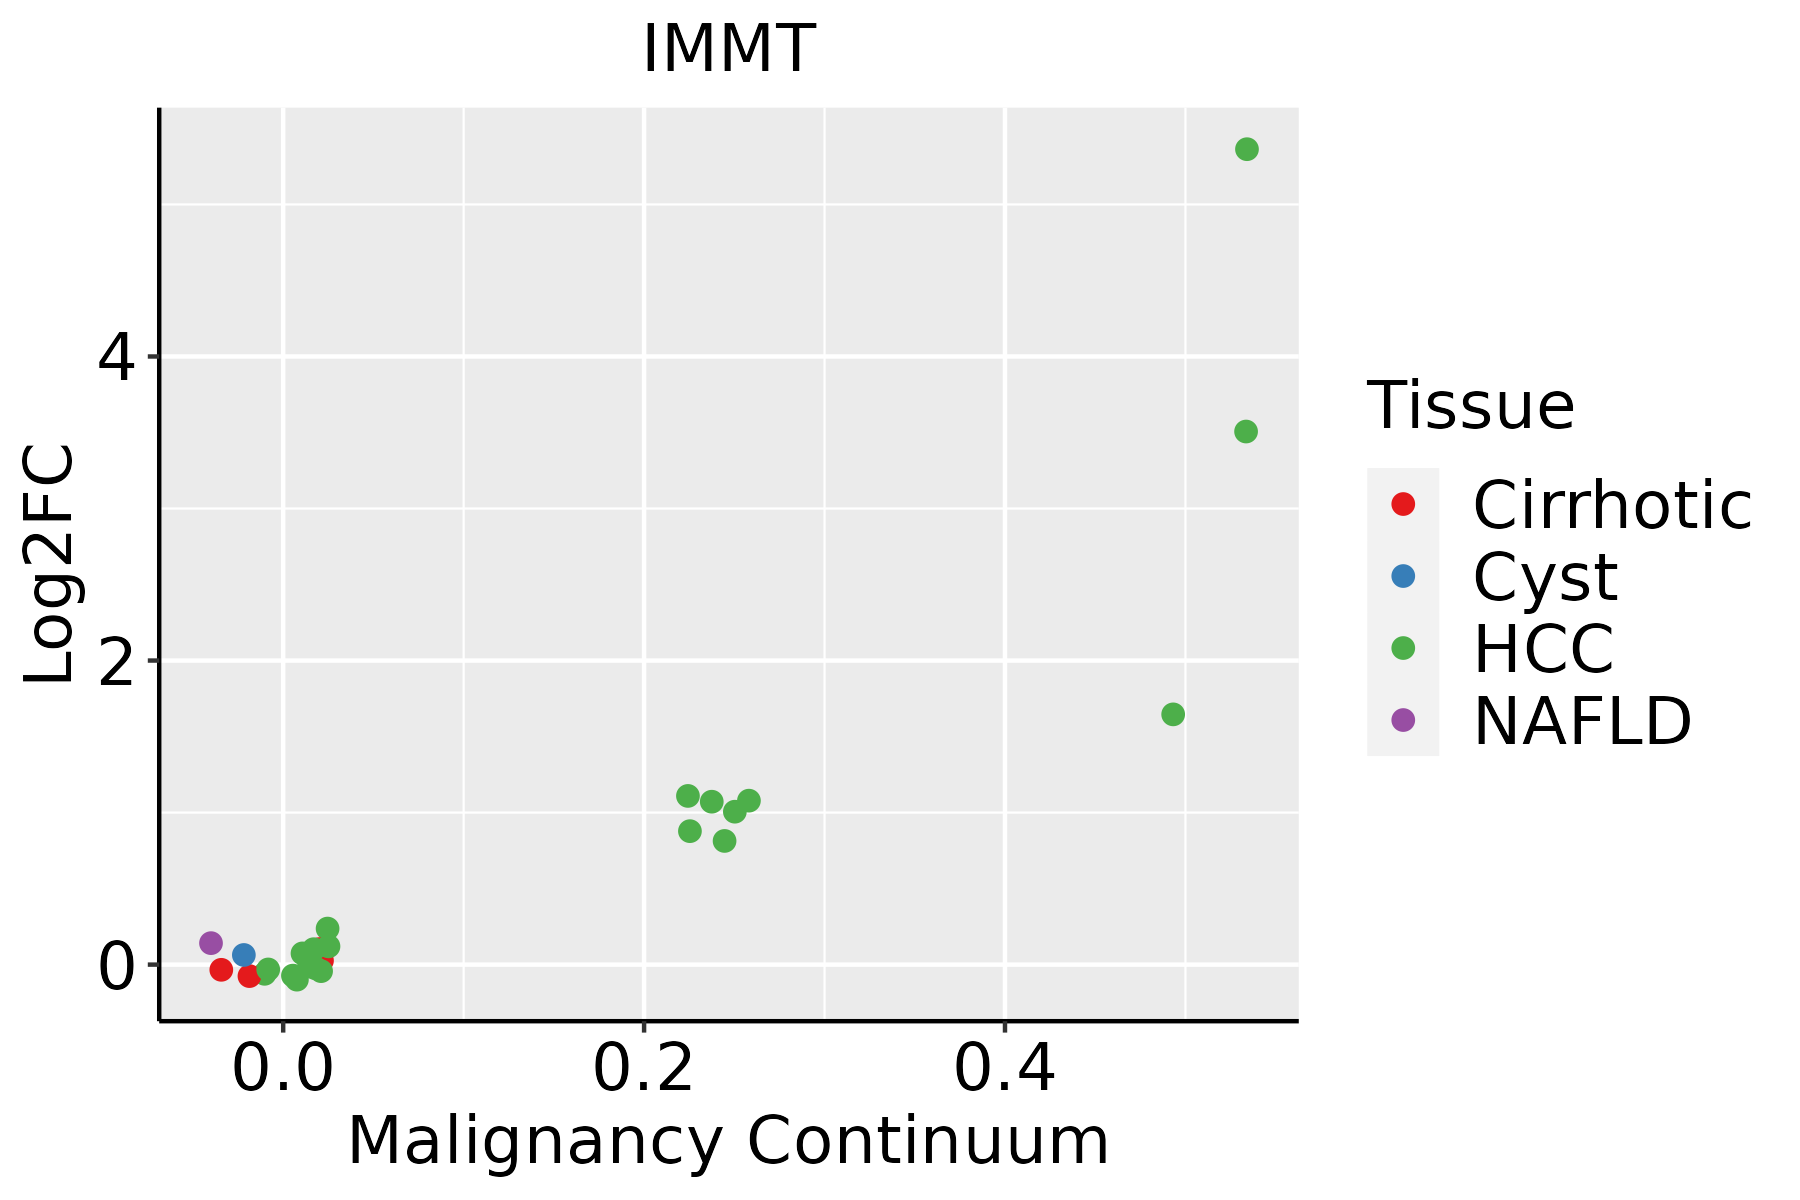 | HCC: Hepatocellular carcinoma |
| NAFLD: Non-alcoholic fatty liver disease |
| Oral Cavity | 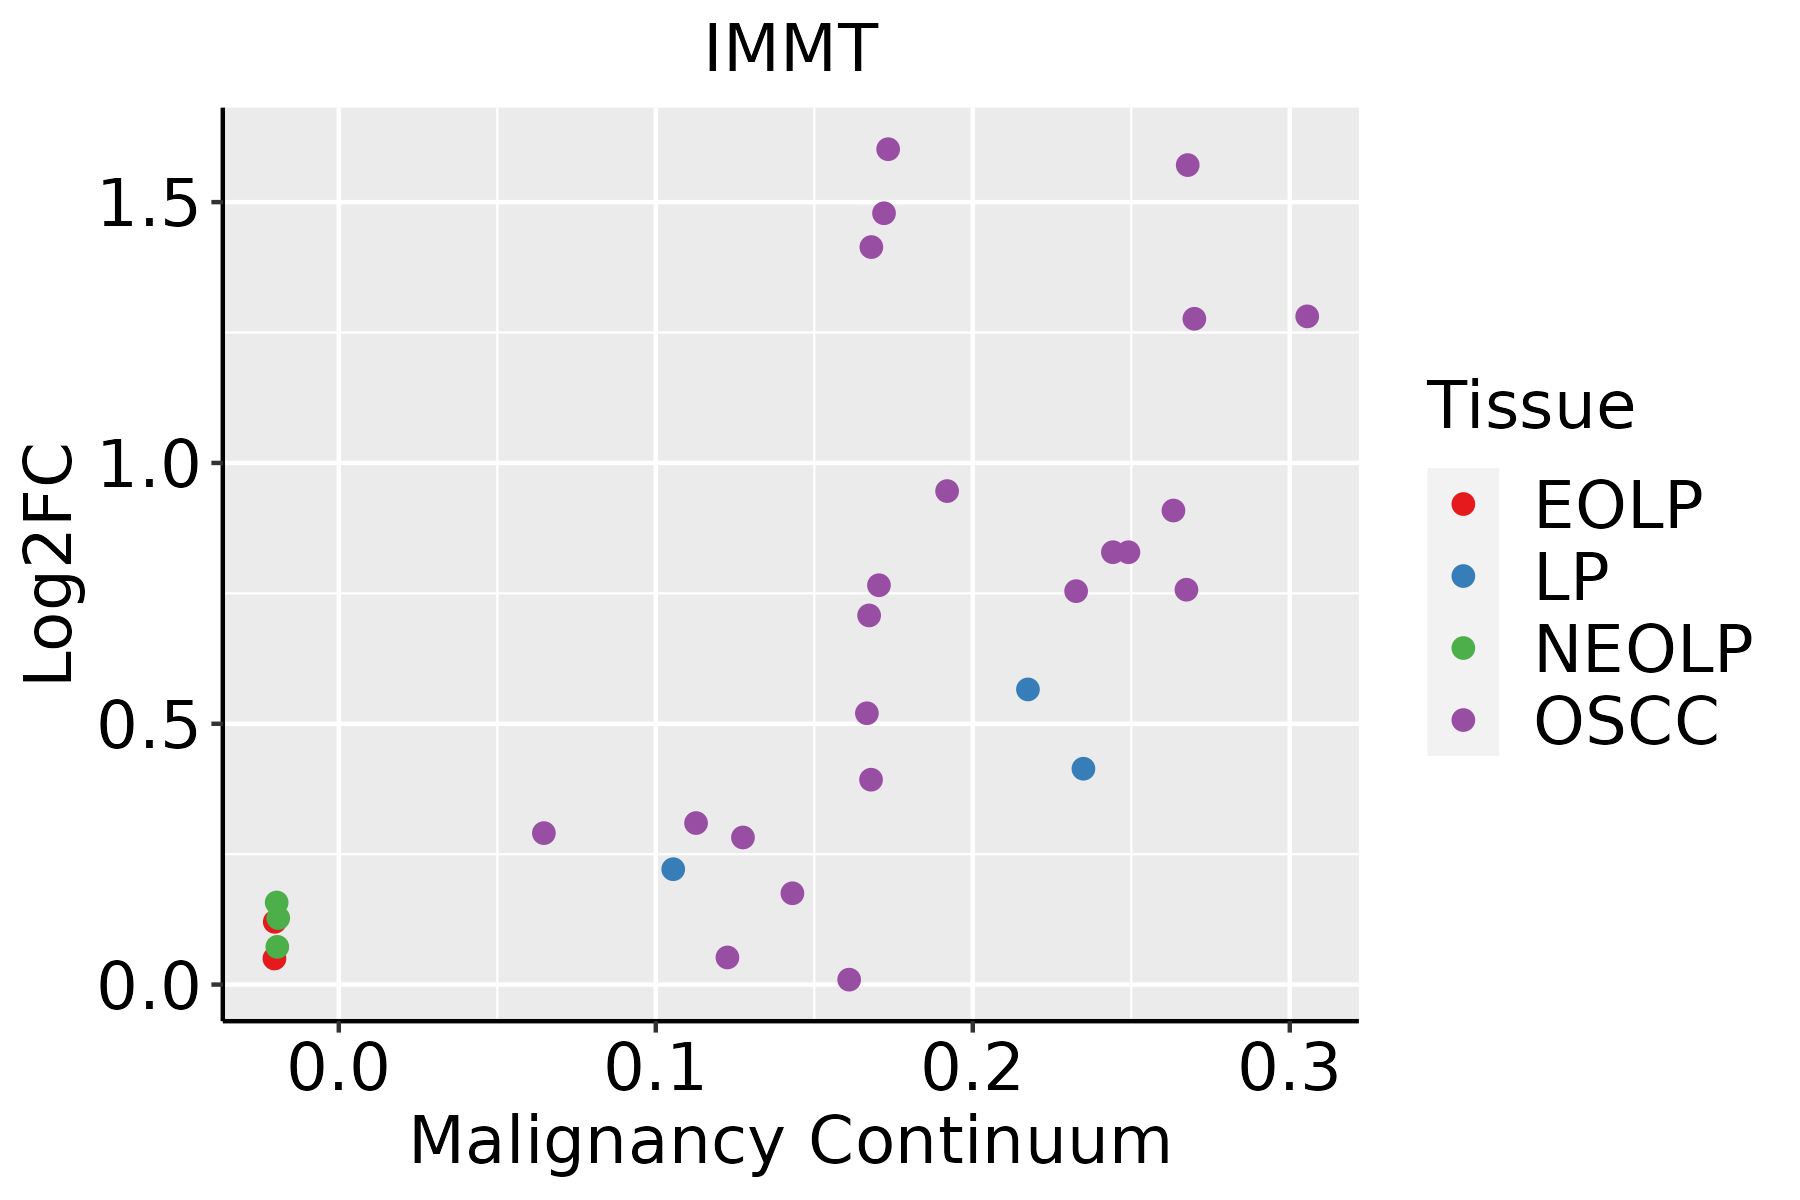 | EOLP: Erosive Oral lichen planus |
| LP: leukoplakia |
| NEOLP: Non-erosive oral lichen planus |
| OSCC: Oral squamous cell carcinoma |
| Prostate |  | BPH: Benign Prostatic Hyperplasia |
| Skin |  | AK: Actinic keratosis |
| cSCC: Cutaneous squamous cell carcinoma |
| SCCIS:squamous cell carcinoma in situ |
| Thyroid | 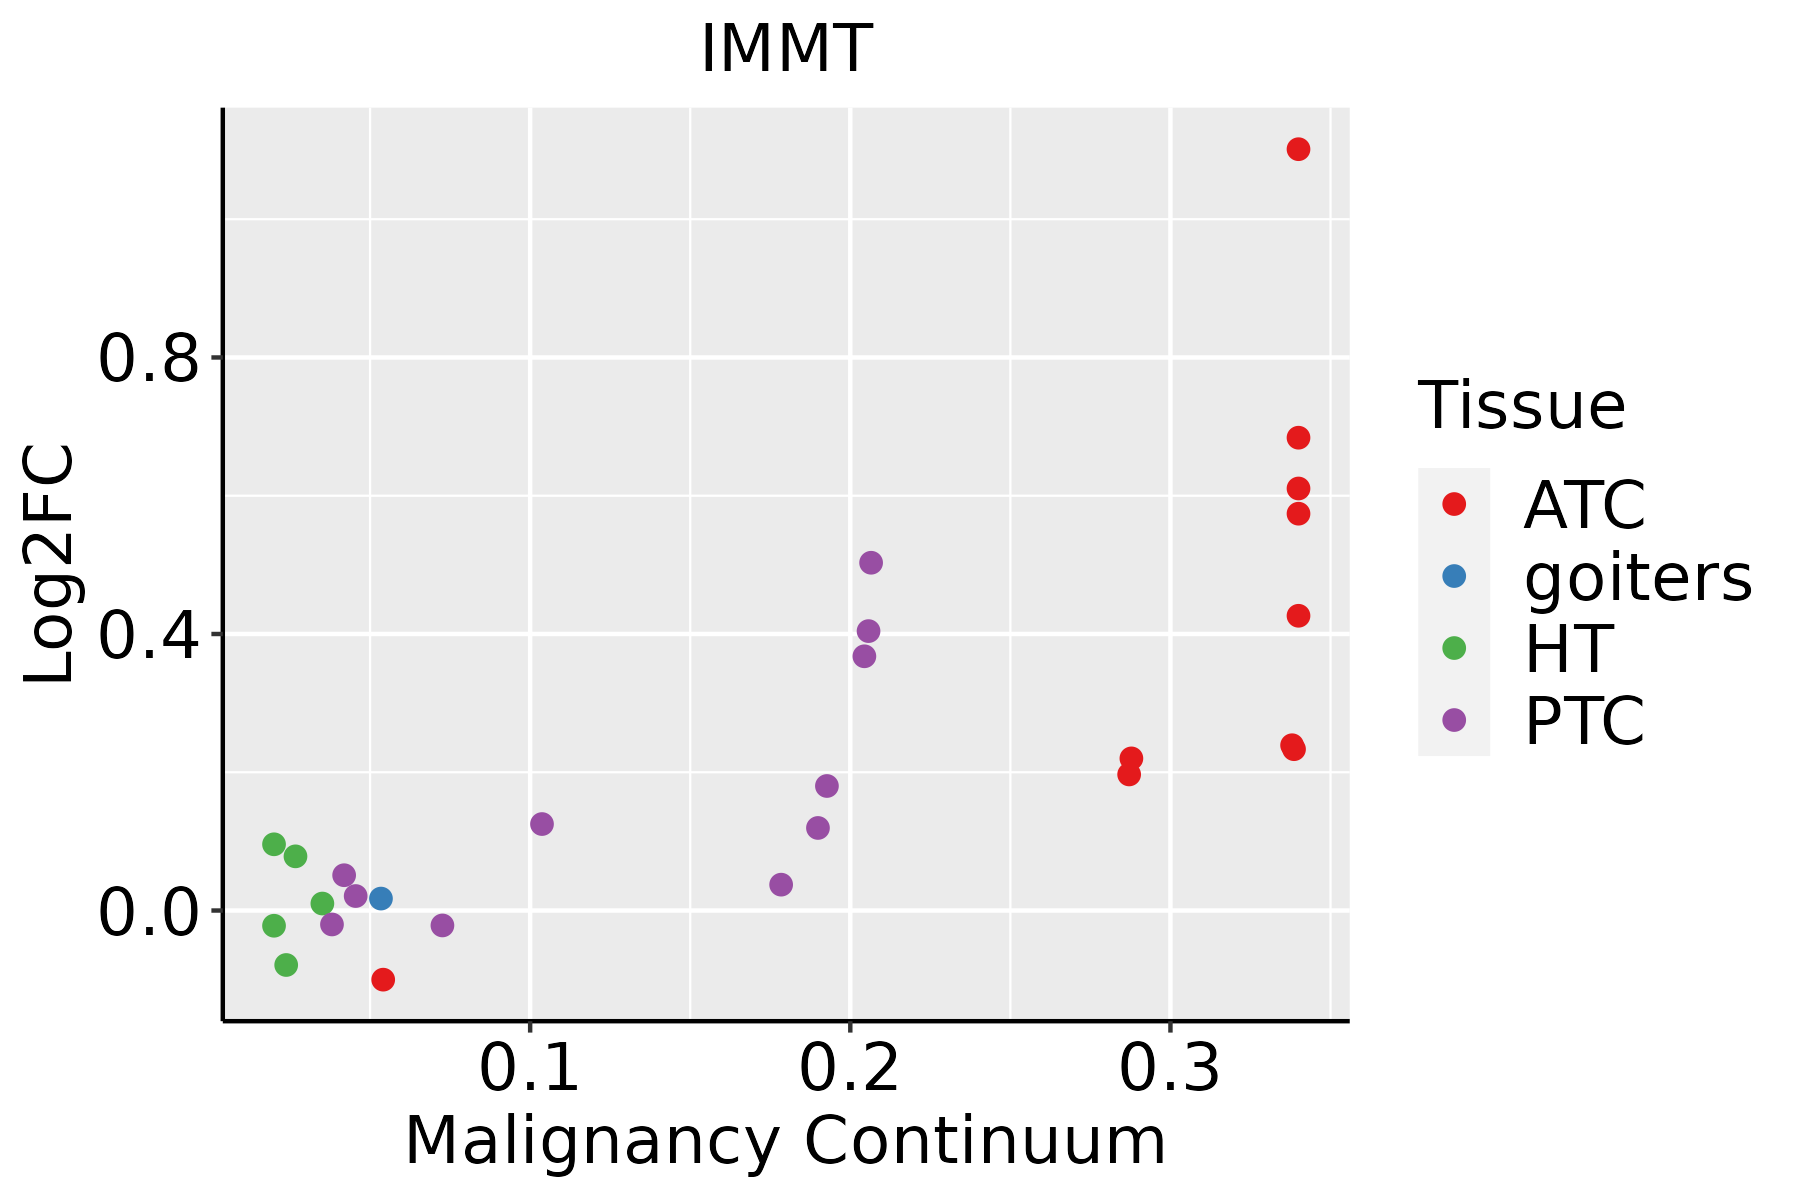 | ATC: Anaplastic thyroid cancer |
| HT: Hashimoto's thyroiditis |
| PTC: Papillary thyroid cancer |
| GO ID | Tissue | Disease Stage | Description | Gene Ratio | Bg Ratio | pvalue | p.adjust | Count |
| GO:0007006 | Colorectum | AD | mitochondrial membrane organization | 48/3918 | 116/18723 | 4.53e-07 | 1.72e-05 | 48 |
| GO:0007007 | Colorectum | AD | inner mitochondrial membrane organization | 18/3918 | 38/18723 | 2.45e-04 | 3.09e-03 | 18 |
| GO:0051560 | Colorectum | AD | mitochondrial calcium ion homeostasis | 13/3918 | 26/18723 | 9.41e-04 | 8.92e-03 | 13 |
| GO:00515603 | Colorectum | FAP | mitochondrial calcium ion homeostasis | 9/2622 | 26/18723 | 6.73e-03 | 4.14e-02 | 9 |
| GO:00515604 | Colorectum | CRC | mitochondrial calcium ion homeostasis | 9/2078 | 26/18723 | 1.35e-03 | 1.49e-02 | 9 |
| GO:000700619 | Esophagus | ESCC | mitochondrial membrane organization | 93/8552 | 116/18723 | 2.16e-14 | 1.11e-12 | 93 |
| GO:000700713 | Esophagus | ESCC | inner mitochondrial membrane organization | 31/8552 | 38/18723 | 5.93e-06 | 6.10e-05 | 31 |
| GO:00424072 | Esophagus | ESCC | cristae formation | 13/8552 | 16/18723 | 4.05e-03 | 1.62e-02 | 13 |
| GO:00070065 | Liver | Cirrhotic | mitochondrial membrane organization | 57/4634 | 116/18723 | 1.13e-08 | 4.29e-07 | 57 |
| GO:005156011 | Liver | Cirrhotic | mitochondrial calcium ion homeostasis | 15/4634 | 26/18723 | 3.43e-04 | 2.93e-03 | 15 |
| GO:00070073 | Liver | Cirrhotic | inner mitochondrial membrane organization | 19/4634 | 38/18723 | 6.75e-04 | 5.06e-03 | 19 |
| GO:000700612 | Liver | HCC | mitochondrial membrane organization | 80/7958 | 116/18723 | 7.09e-09 | 1.81e-07 | 80 |
| GO:000700711 | Liver | HCC | inner mitochondrial membrane organization | 28/7958 | 38/18723 | 9.60e-05 | 8.34e-04 | 28 |
| GO:005156021 | Liver | HCC | mitochondrial calcium ion homeostasis | 20/7958 | 26/18723 | 3.82e-04 | 2.61e-03 | 20 |
| GO:0042407 | Liver | HCC | cristae formation | 12/7958 | 16/18723 | 8.74e-03 | 3.40e-02 | 12 |
| GO:000700610 | Oral cavity | OSCC | mitochondrial membrane organization | 85/7305 | 116/18723 | 6.29e-14 | 3.40e-12 | 85 |
| GO:00070075 | Oral cavity | OSCC | inner mitochondrial membrane organization | 27/7305 | 38/18723 | 6.23e-05 | 5.08e-04 | 27 |
| GO:00515607 | Oral cavity | OSCC | mitochondrial calcium ion homeostasis | 18/7305 | 26/18723 | 1.75e-03 | 8.28e-03 | 18 |
| GO:00424071 | Oral cavity | OSCC | cristae formation | 12/7305 | 16/18723 | 3.83e-03 | 1.57e-02 | 12 |
| GO:000700623 | Oral cavity | EOLP | mitochondrial membrane organization | 25/2218 | 116/18723 | 2.06e-03 | 1.31e-02 | 25 |
| Hugo Symbol | Variant Class | Variant Classification | dbSNP RS | HGVSc | HGVSp | HGVSp Short | SWISSPROT | BIOTYPE | SIFT | PolyPhen | Tumor Sample Barcode | Tissue | Histology | Sex | Age | Stage | Therapy Types | Drugs | Outcome |
| IMMT | SNV | Missense_Mutation | novel | c.1198G>T | p.Asp400Tyr | p.D400Y | Q16891 | protein_coding | deleterious(0) | probably_damaging(0.999) | TCGA-5L-AAT1-01 | Breast | breast invasive carcinoma | Female | <65 | III/IV | Hormone Therapy | letrozol | SD |
| IMMT | SNV | Missense_Mutation | | c.652N>C | p.Glu218Gln | p.E218Q | Q16891 | protein_coding | tolerated(0.13) | benign(0.01) | TCGA-C8-A12Z-01 | Breast | breast invasive carcinoma | Female | <65 | I/II | Chemotherapy | 5-fluorouracil | CR |
| IMMT | SNV | Missense_Mutation | | c.391N>G | p.Gln131Glu | p.Q131E | Q16891 | protein_coding | tolerated(1) | benign(0.001) | TCGA-D8-A1XW-01 | Breast | breast invasive carcinoma | Female | <65 | I/II | Chemotherapy | adriamycin+cyclophosphamide | SD |
| IMMT | SNV | Missense_Mutation | novel | c.769N>G | p.Lys257Glu | p.K257E | Q16891 | protein_coding | tolerated(0.08) | possibly_damaging(0.7) | TCGA-EW-A6SB-01 | Breast | breast invasive carcinoma | Female | <65 | I/II | Unknown | Unknown | SD |
| IMMT | SNV | Missense_Mutation | rs114088948 | c.1573C>T | p.Arg525Cys | p.R525C | Q16891 | protein_coding | deleterious(0) | possibly_damaging(0.832) | TCGA-2W-A8YY-01 | Cervix | cervical & endocervical cancer | Female | <65 | I/II | Chemotherapy | cisplatin | CR |
| IMMT | SNV | Missense_Mutation | rs750446231 | c.317C>T | p.Ser106Leu | p.S106L | Q16891 | protein_coding | tolerated(0.25) | benign(0.322) | TCGA-2W-A8YY-01 | Cervix | cervical & endocervical cancer | Female | <65 | I/II | Chemotherapy | cisplatin | CR |
| IMMT | SNV | Missense_Mutation | novel | c.2014N>G | p.Gln672Glu | p.Q672E | Q16891 | protein_coding | tolerated(0.6) | benign(0.065) | TCGA-C5-A2LZ-01 | Cervix | cervical & endocervical cancer | Female | >=65 | III/IV | Unknown | Unknown | PD |
| IMMT | SNV | Missense_Mutation | | c.2095N>C | p.Glu699Gln | p.E699Q | Q16891 | protein_coding | deleterious(0) | possibly_damaging(0.874) | TCGA-DG-A2KK-01 | Cervix | cervical & endocervical cancer | Female | <65 | III/IV | Chemotherapy | cisplatin | SD |
| IMMT | SNV | Missense_Mutation | | c.107C>T | p.Ser36Leu | p.S36L | Q16891 | protein_coding | deleterious(0.02) | benign(0.14) | TCGA-EK-A2PG-01 | Cervix | cervical & endocervical cancer | Female | >=65 | I/II | Unknown | Unknown | SD |
| IMMT | SNV | Missense_Mutation | novel | c.2208G>C | p.Gln736His | p.Q736H | Q16891 | protein_coding | deleterious(0) | probably_damaging(1) | TCGA-VS-A8QF-01 | Cervix | cervical & endocervical cancer | Female | <65 | I/II | Chemotherapy | cisplatin | CR |


