
|
|||||
|
 | |
| |
| |
| |
| |
| |
|
Gene: IMMP2L |
Gene summary for IMMP2L |
| Gene information | Species | Human | Gene symbol | IMMP2L | Gene ID | 83943 |
| Gene name | inner mitochondrial membrane peptidase subunit 2 | |
| Gene Alias | IMMP2L-IT1 | |
| Cytomap | 7q31.1 | |
| Gene Type | protein-coding | GO ID | GO:0000003 | UniProtAcc | A4D0S9 |
Top |
Malignant transformation analysis |
| Identification of the aberrant gene expression in precancerous and cancerous lesions by comparing the gene expression of stem-like cells in diseased tissues with normal stem cells |
| Entrez ID | Symbol | Replicates | Species | Organ | Tissue | Adj P-value | Log2FC | Malignancy |
| 83943 | IMMP2L | CA_HPV_3 | Human | Cervix | CC | 8.06e-03 | 1.51e-01 | 0.0414 |
| 83943 | IMMP2L | CCI_1 | Human | Cervix | CC | 2.23e-10 | 1.06e+00 | 0.528 |
| 83943 | IMMP2L | CCI_3 | Human | Cervix | CC | 3.97e-32 | 1.54e+00 | 0.516 |
| 83943 | IMMP2L | HTA11_3410_2000001011 | Human | Colorectum | AD | 4.63e-30 | -6.80e-01 | 0.0155 |
| 83943 | IMMP2L | HTA11_2487_2000001011 | Human | Colorectum | SER | 4.90e-26 | -9.34e-01 | -0.1808 |
| 83943 | IMMP2L | HTA11_2951_2000001011 | Human | Colorectum | AD | 2.99e-17 | -1.30e+00 | 0.0216 |
| 83943 | IMMP2L | HTA11_2112_2000001011 | Human | Colorectum | SER | 7.53e-09 | -9.97e-01 | -0.2196 |
| 83943 | IMMP2L | HTA11_3361_2000001011 | Human | Colorectum | AD | 4.02e-31 | -1.03e+00 | -0.1207 |
| 83943 | IMMP2L | HTA11_83_2000001011 | Human | Colorectum | SER | 2.98e-15 | -6.29e-01 | -0.1526 |
| 83943 | IMMP2L | HTA11_696_2000001011 | Human | Colorectum | AD | 1.27e-20 | -6.80e-01 | -0.1464 |
| 83943 | IMMP2L | HTA11_866_2000001011 | Human | Colorectum | AD | 1.80e-14 | -5.93e-01 | -0.1001 |
| 83943 | IMMP2L | HTA11_2992_2000001011 | Human | Colorectum | SER | 2.81e-10 | -8.33e-01 | -0.1706 |
| 83943 | IMMP2L | HTA11_5212_2000001011 | Human | Colorectum | AD | 6.20e-22 | -1.34e+00 | -0.2061 |
| 83943 | IMMP2L | HTA11_5216_2000001011 | Human | Colorectum | SER | 2.16e-10 | -8.86e-01 | -0.1462 |
| 83943 | IMMP2L | HTA11_7862_2000001011 | Human | Colorectum | AD | 1.70e-11 | -6.58e-01 | -0.0179 |
| 83943 | IMMP2L | HTA11_866_3004761011 | Human | Colorectum | AD | 3.18e-04 | -4.04e-01 | 0.096 |
| 83943 | IMMP2L | HTA11_9408_2000001011 | Human | Colorectum | AD | 2.20e-02 | -6.69e-01 | 0.0451 |
| 83943 | IMMP2L | HTA11_8622_2000001021 | Human | Colorectum | SER | 1.12e-09 | -7.23e-01 | 0.0528 |
| 83943 | IMMP2L | HTA11_10711_2000001011 | Human | Colorectum | AD | 1.43e-04 | -4.57e-01 | 0.0338 |
| 83943 | IMMP2L | HTA11_6818_2000001011 | Human | Colorectum | AD | 1.67e-05 | -5.29e-01 | 0.0112 |
| Page: 1 2 3 4 5 6 7 8 9 10 11 12 |
| Tissue | Expression Dynamics | Abbreviation |
| Cervix | 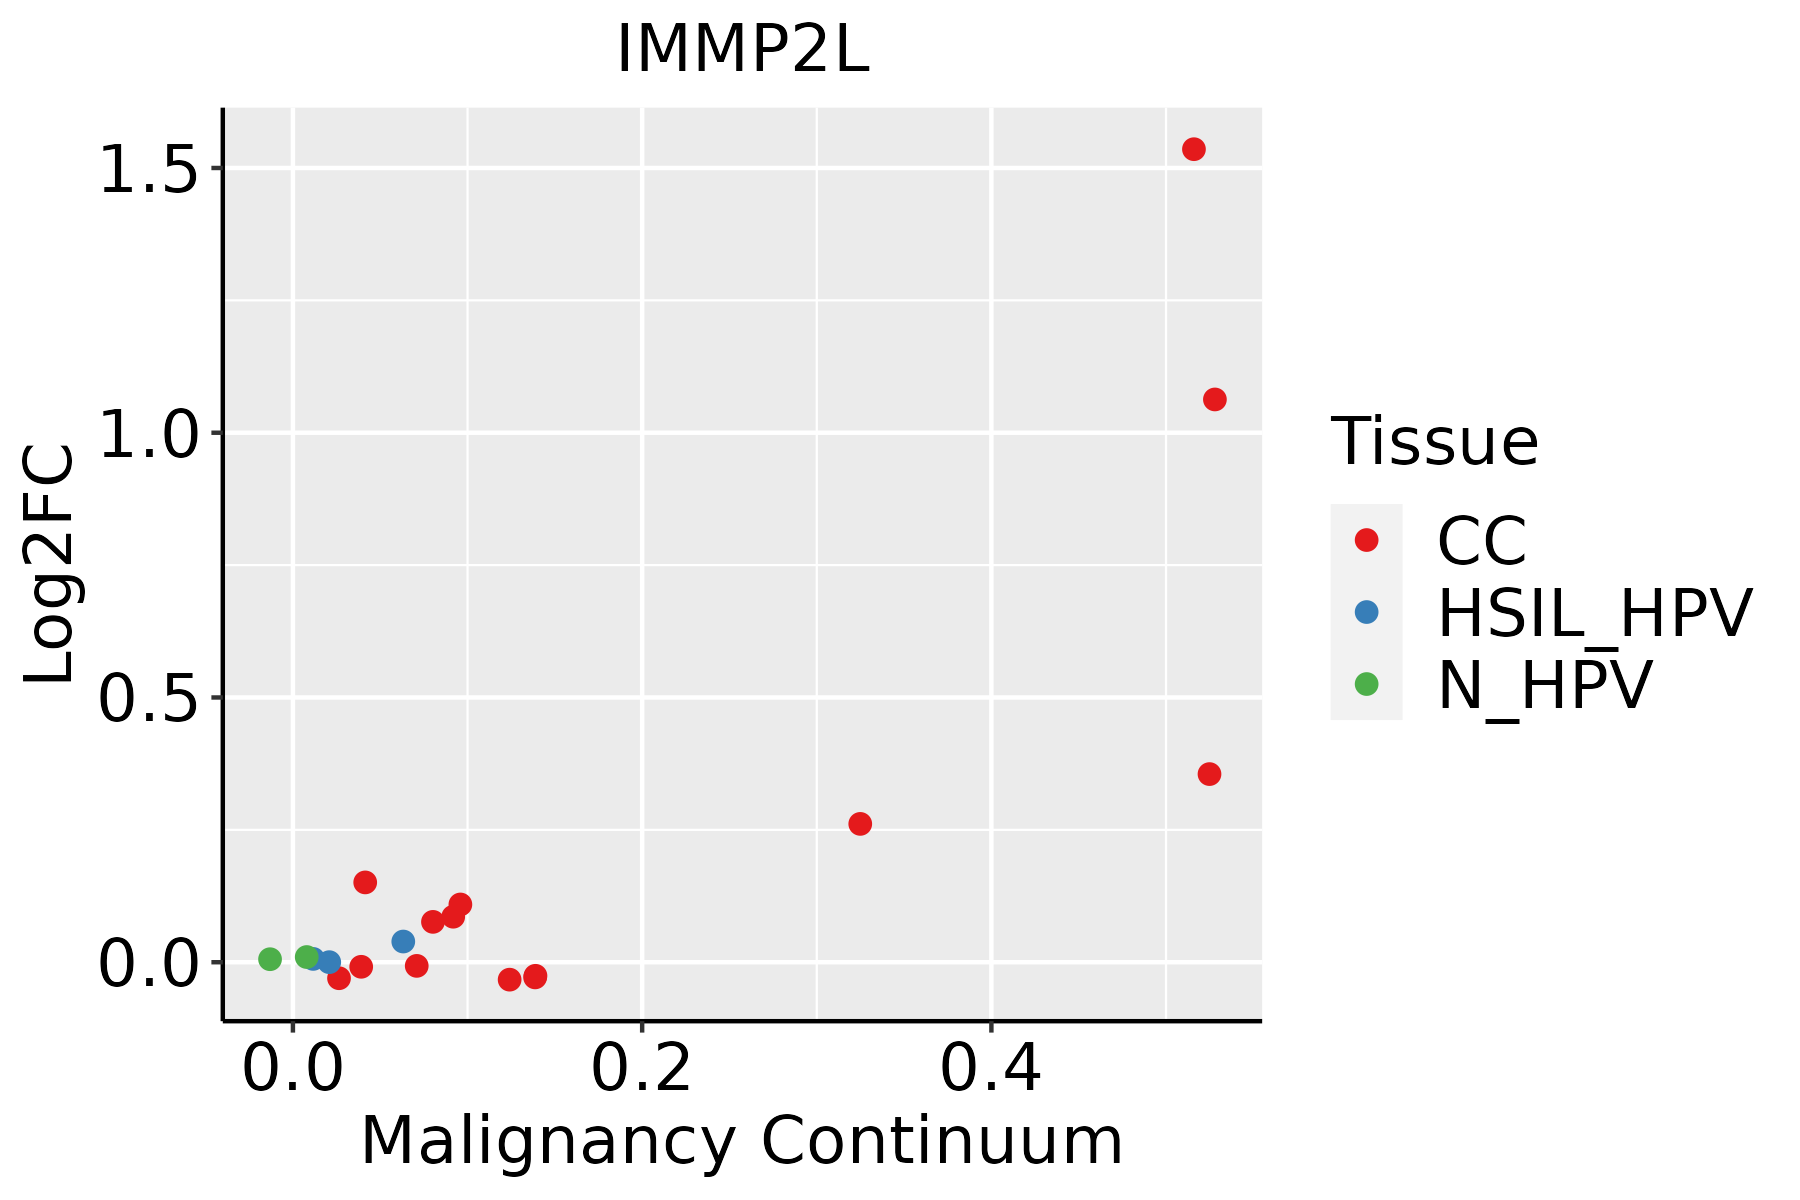 | CC: Cervix cancer |
| HSIL_HPV: HPV-infected high-grade squamous intraepithelial lesions | ||
| N_HPV: HPV-infected normal cervix | ||
| Colorectum (GSE201348) |  | FAP: Familial adenomatous polyposis |
| CRC: Colorectal cancer | ||
| Colorectum (HTA11) |  | AD: Adenomas |
| SER: Sessile serrated lesions | ||
| MSI-H: Microsatellite-high colorectal cancer | ||
| MSS: Microsatellite stable colorectal cancer | ||
| Endometrium | 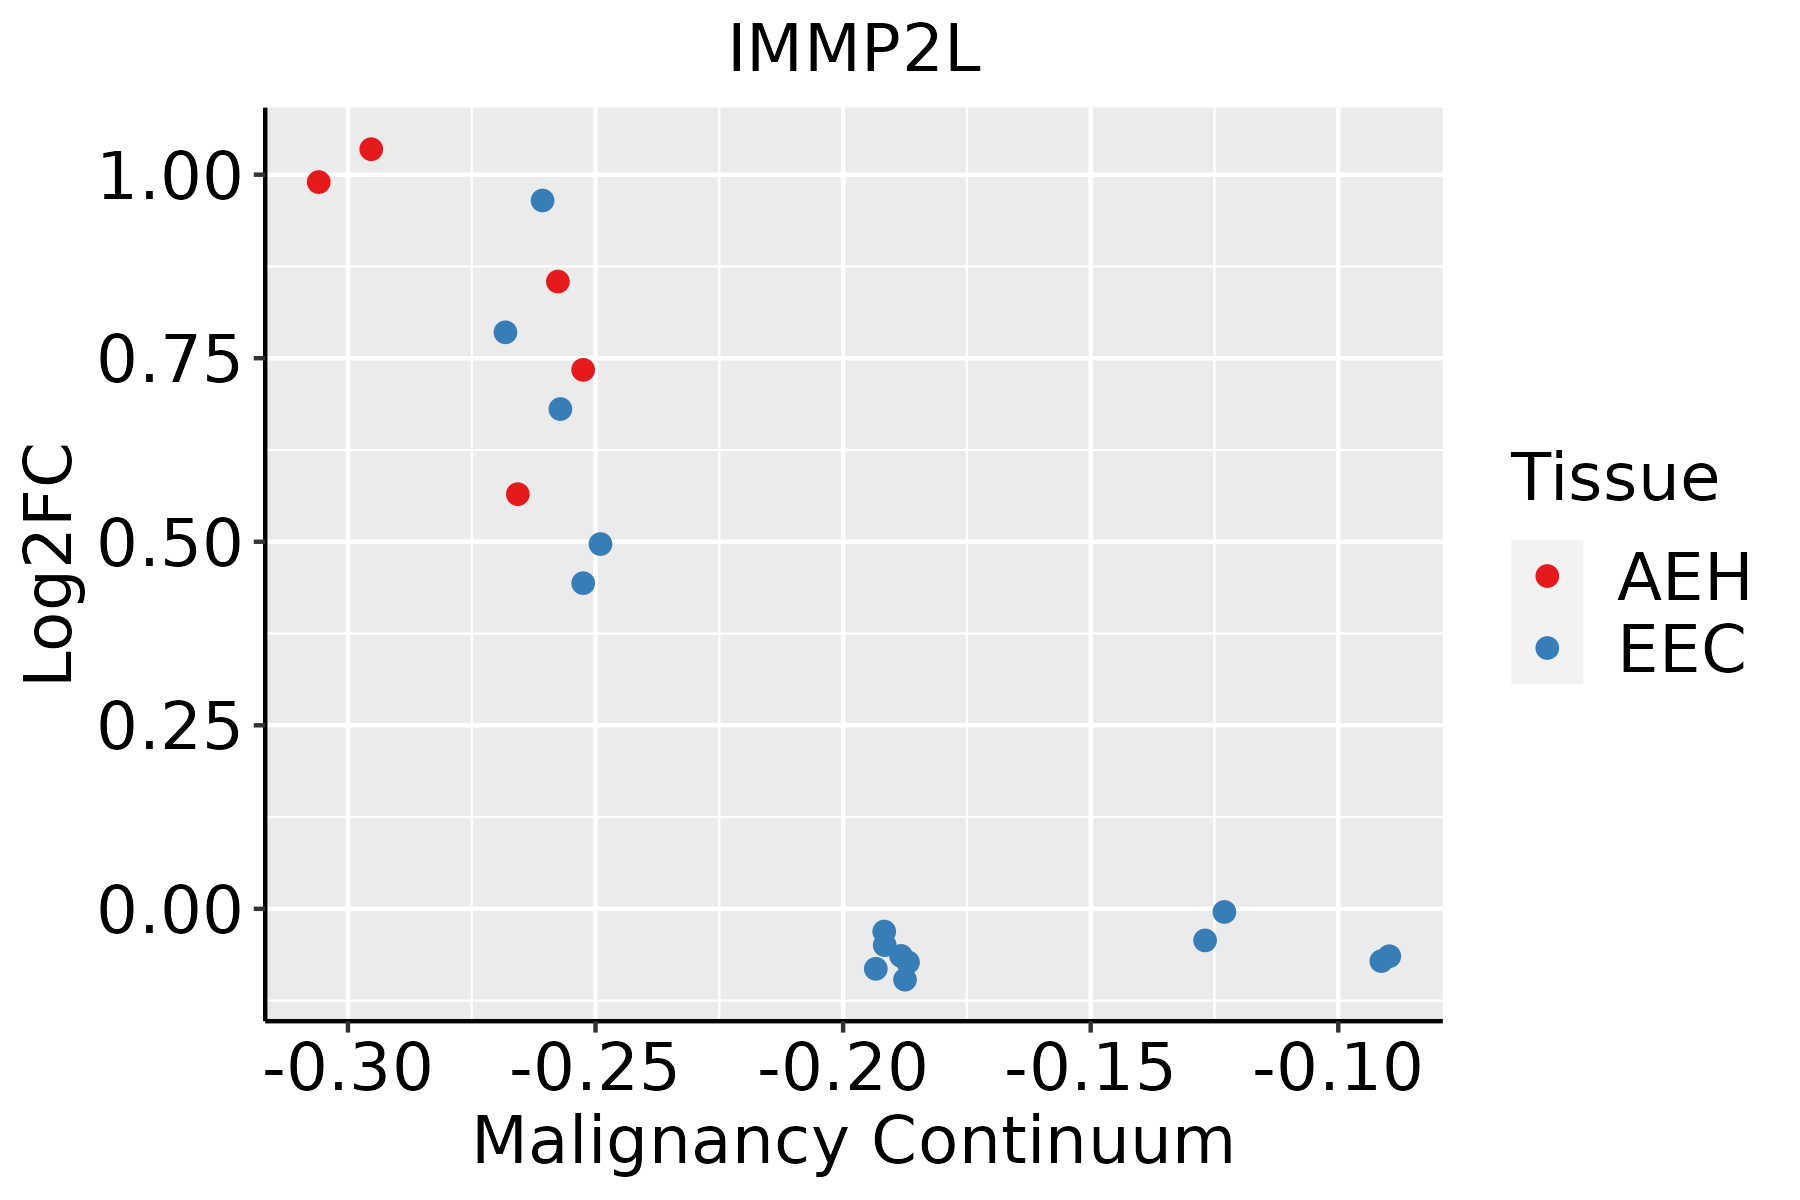 | AEH: Atypical endometrial hyperplasia |
| EEC: Endometrioid Cancer | ||
| Esophagus | 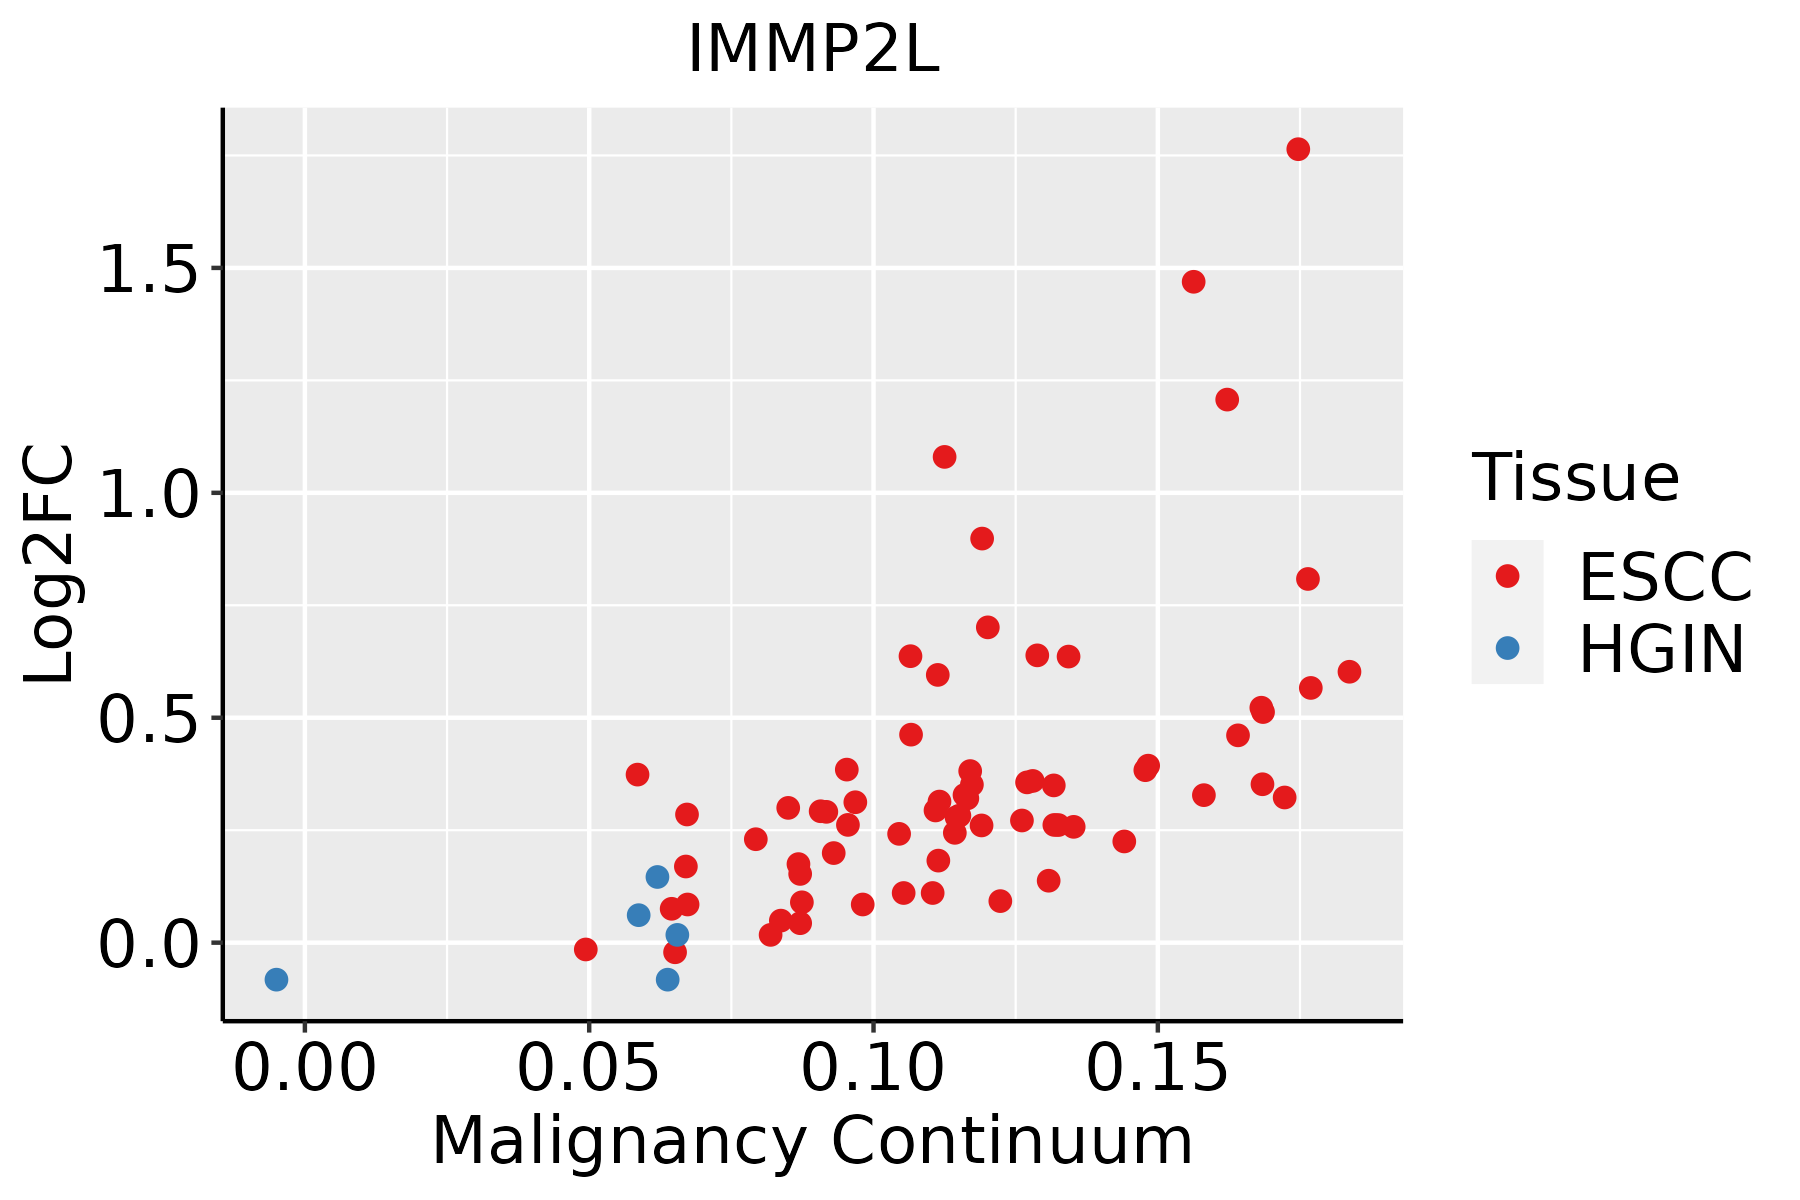 | ESCC: Esophageal squamous cell carcinoma |
| HGIN: High-grade intraepithelial neoplasias | ||
| LGIN: Low-grade intraepithelial neoplasias | ||
| GC |  | CAG: Chronic atrophic gastritis |
| CAG with IM: Chronic atrophic gastritis with intestinal metaplasia | ||
| CSG: Chronic superficial gastritis | ||
| GC: Gastric cancer | ||
| SIM: Severe intestinal metaplasia | ||
| WIM: Wild intestinal metaplasia | ||
| Liver | 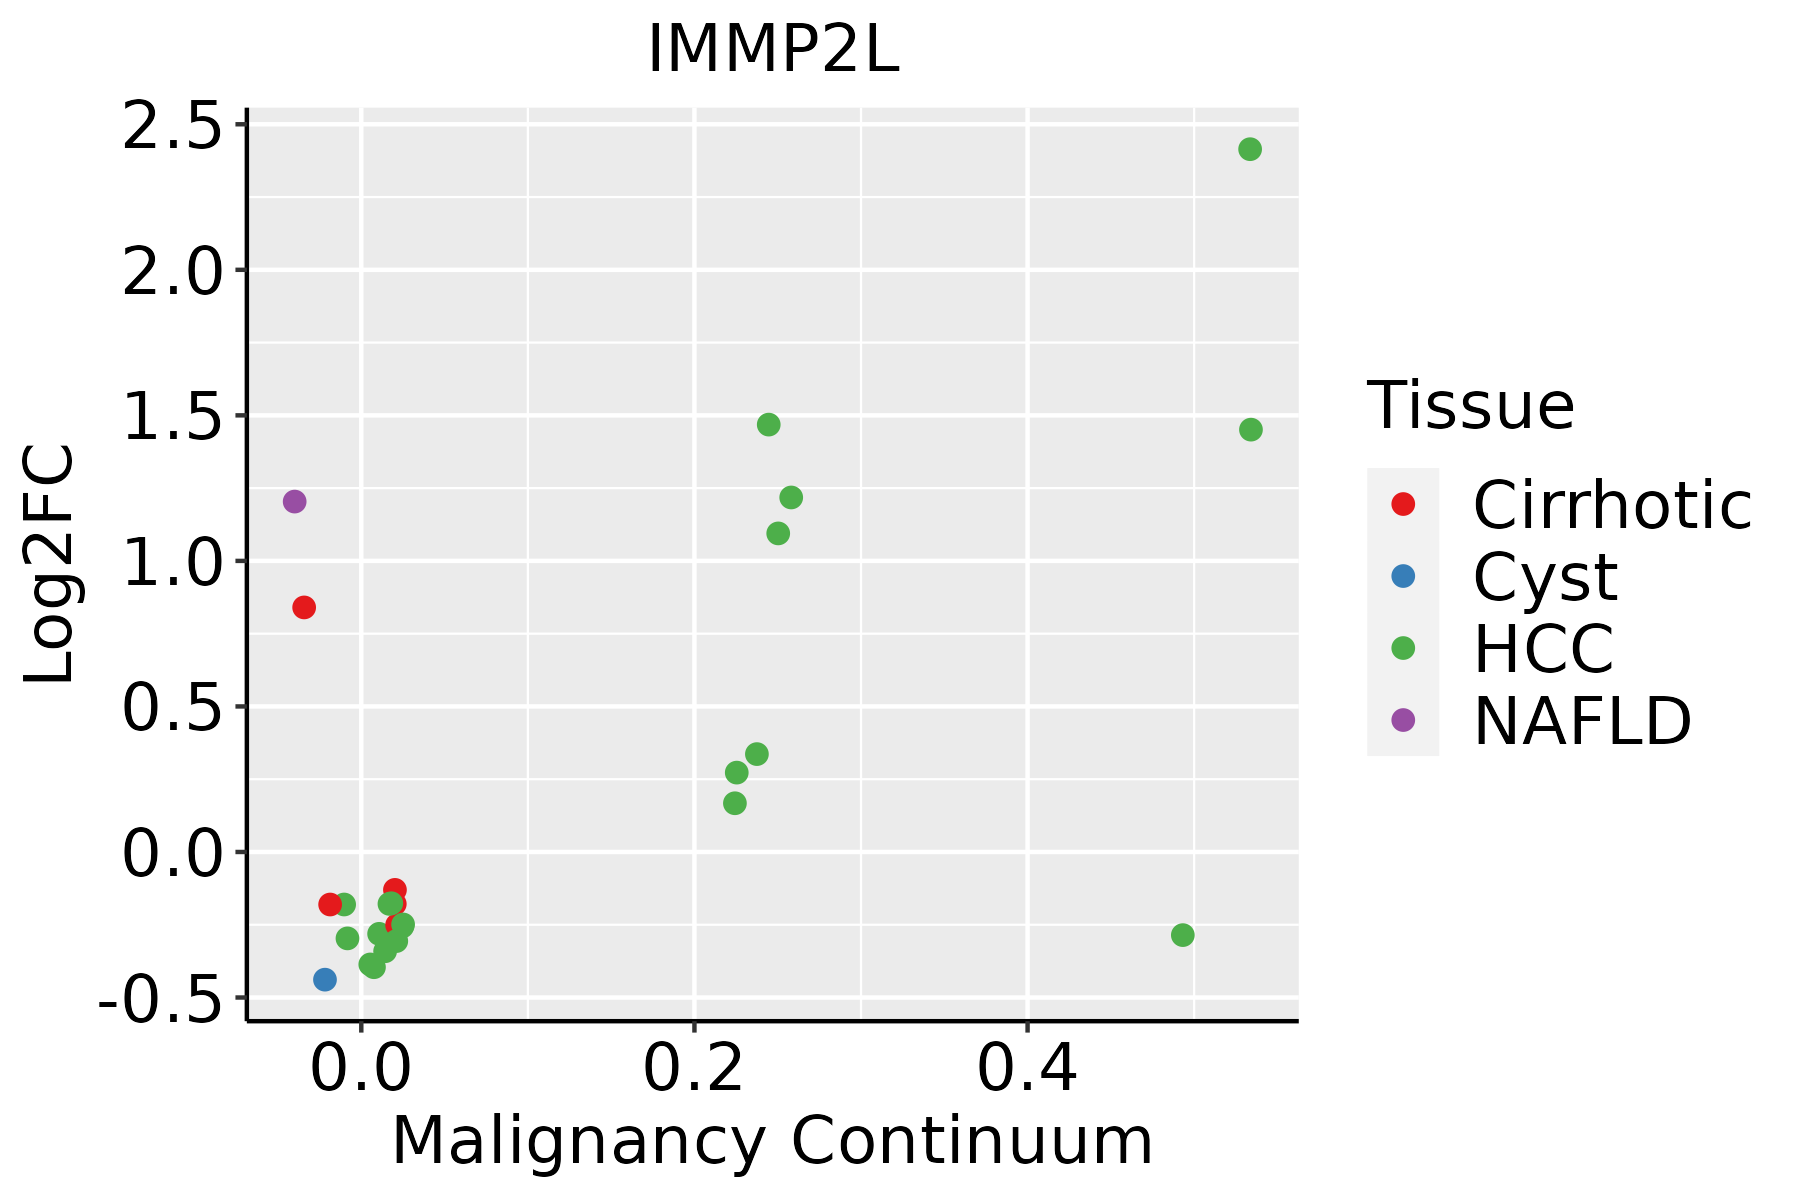 | HCC: Hepatocellular carcinoma |
| NAFLD: Non-alcoholic fatty liver disease | ||
| Lung | 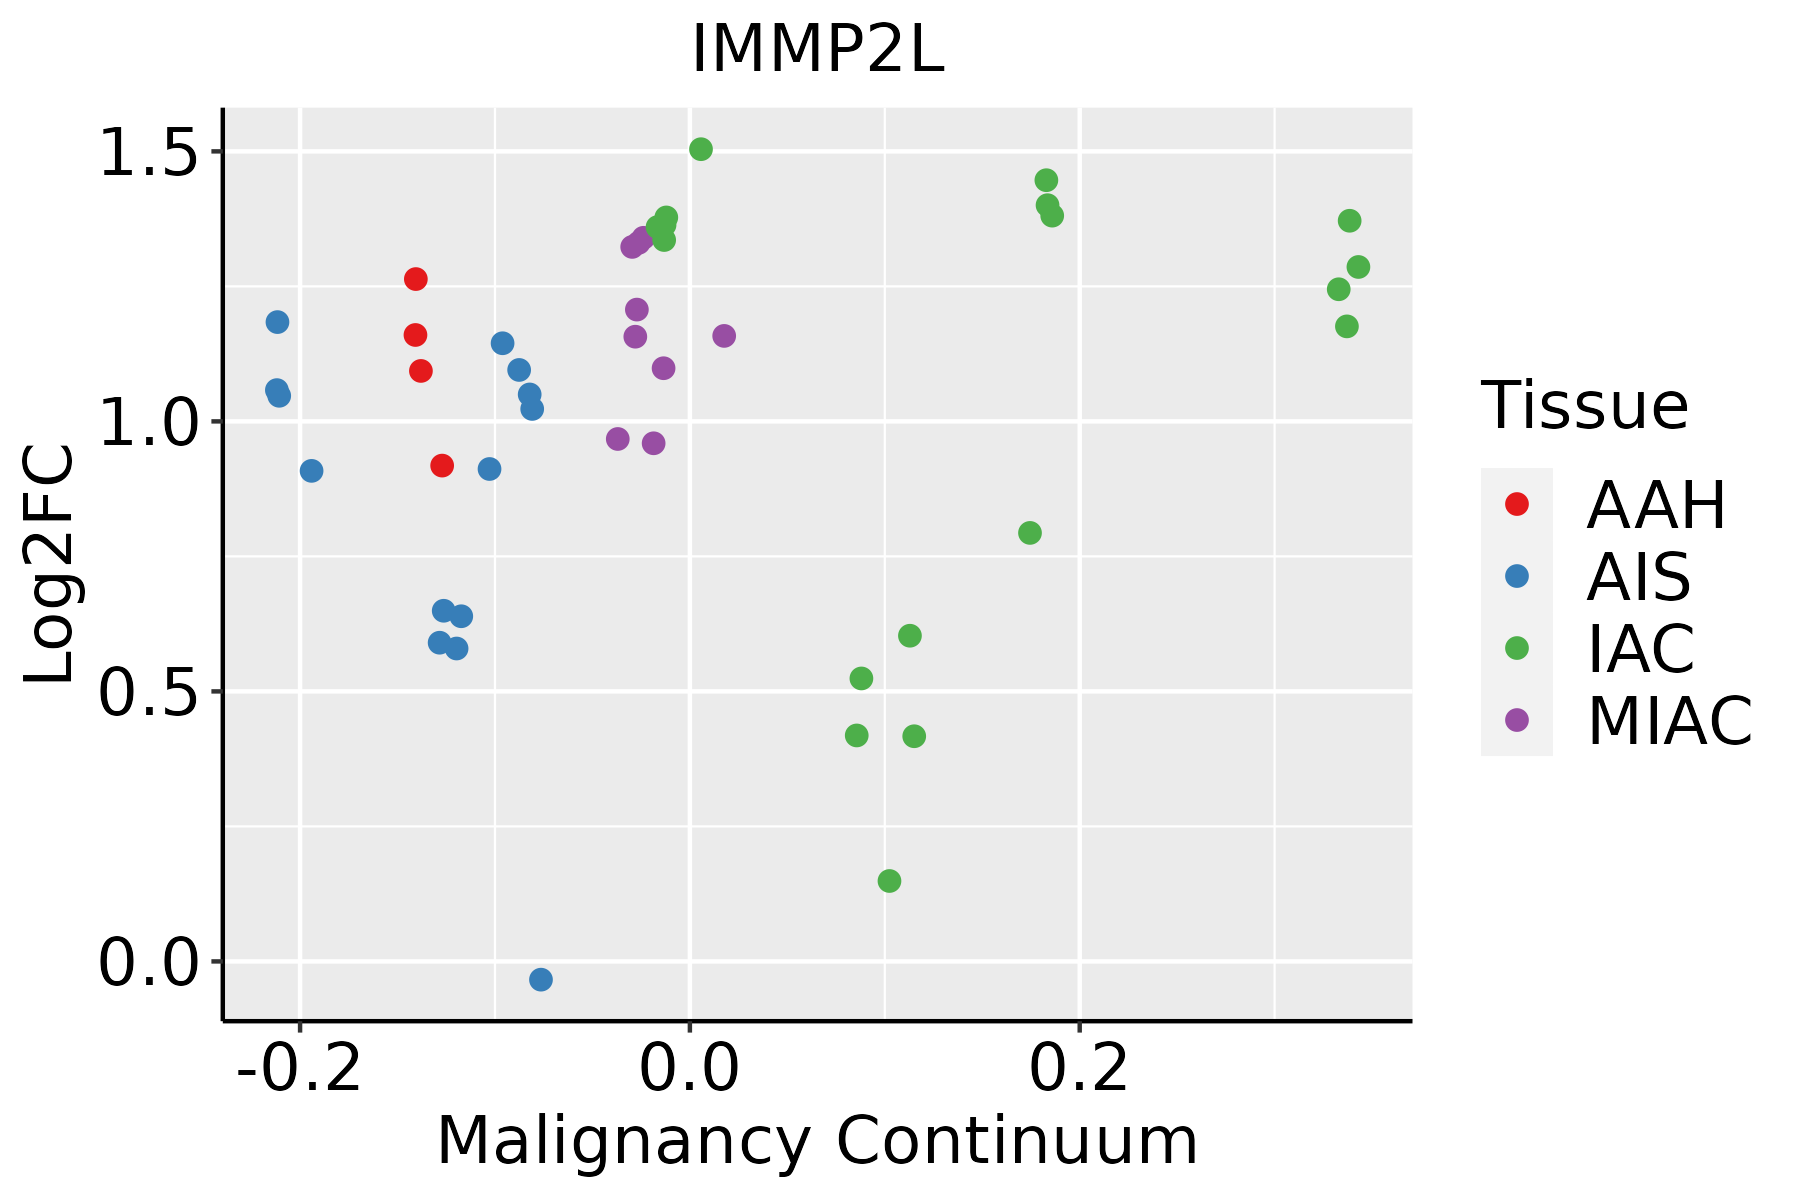 | AAH: Atypical adenomatous hyperplasia |
| AIS: Adenocarcinoma in situ | ||
| IAC: Invasive lung adenocarcinoma | ||
| MIA: Minimally invasive adenocarcinoma | ||
| Prostate |  | BPH: Benign Prostatic Hyperplasia |
| Skin |  | AK: Actinic keratosis |
| cSCC: Cutaneous squamous cell carcinoma | ||
| SCCIS:squamous cell carcinoma in situ | ||
| Thyroid | 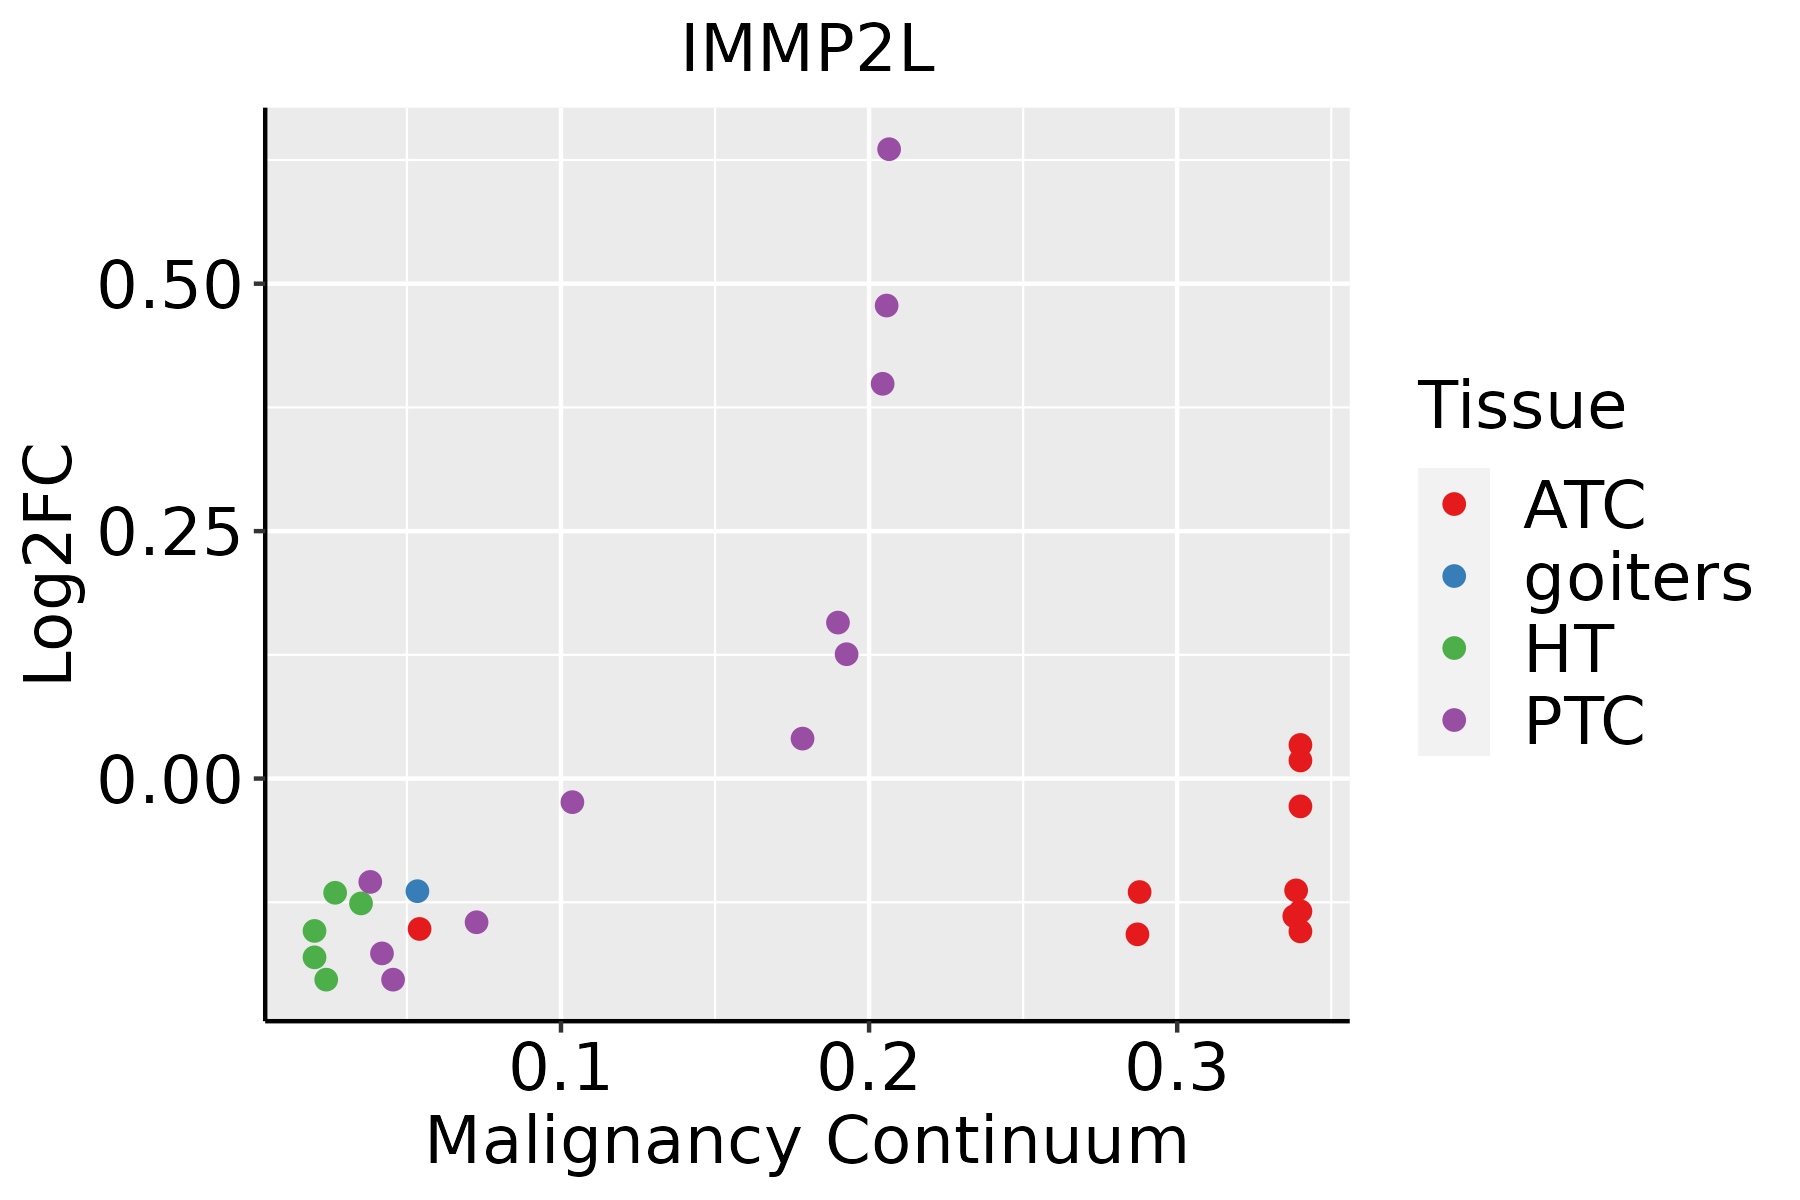 | ATC: Anaplastic thyroid cancer |
| HT: Hashimoto's thyroiditis | ||
| PTC: Papillary thyroid cancer |
| ∗log2FC in expression of this searched gene in stem-like cells from each diseased tissue sample relative to stem-like cells in normal samples in each tissue plotted against the malignancy continuum. Samples are colored based on if they are from different disease stage. |
Top |
Malignant transformation related pathway analysis |
| Find out the enriched GO biological processes and KEGG pathways involved in transition from healthy to precancer to cancer |
| Tissue | Disease Stage | Enriched GO biological Processes |
| Colorectum | AD |  |
| Colorectum | SER |  |
| Colorectum | MSS |  |
| Colorectum | MSI-H |  |
| Colorectum | FAP |  |
| ∗Top 15 enriched GO BP terms are showed in the bar plot of each disease state in each tissue. Each row represents a significant GO biological process which is colored according to the -log10(p.adjust). |
| Page: 1 2 3 4 5 6 7 8 9 |
| GO ID | Tissue | Disease Stage | Description | Gene Ratio | Bg Ratio | pvalue | p.adjust | Count |
| GO:00229049 | Cervix | CC | respiratory electron transport chain | 42/2311 | 114/18723 | 1.67e-11 | 4.77e-09 | 42 |
| GO:00453339 | Cervix | CC | cellular respiration | 66/2311 | 230/18723 | 2.07e-11 | 5.39e-09 | 66 |
| GO:00725949 | Cervix | CC | establishment of protein localization to organelle | 99/2311 | 422/18723 | 1.23e-10 | 2.11e-08 | 99 |
| GO:00229009 | Cervix | CC | electron transport chain | 53/2311 | 175/18723 | 2.23e-10 | 3.43e-08 | 53 |
| GO:00060919 | Cervix | CC | generation of precursor metabolites and energy | 105/2311 | 490/18723 | 7.40e-09 | 6.61e-07 | 105 |
| GO:00159809 | Cervix | CC | energy derivation by oxidation of organic compounds | 74/2311 | 318/18723 | 3.83e-08 | 2.53e-06 | 74 |
| GO:00068399 | Cervix | CC | mitochondrial transport | 60/2311 | 254/18723 | 4.21e-07 | 1.67e-05 | 60 |
| GO:00614588 | Cervix | CC | reproductive system development | 87/2311 | 427/18723 | 1.37e-06 | 4.55e-05 | 87 |
| GO:00486088 | Cervix | CC | reproductive structure development | 86/2311 | 424/18723 | 1.90e-06 | 5.97e-05 | 86 |
| GO:000660510 | Cervix | CC | protein targeting | 68/2311 | 314/18723 | 2.17e-06 | 6.55e-05 | 68 |
| GO:00705859 | Cervix | CC | protein localization to mitochondrion | 33/2311 | 125/18723 | 1.46e-05 | 2.90e-04 | 33 |
| GO:00331089 | Cervix | CC | mitochondrial respiratory chain complex assembly | 26/2311 | 93/18723 | 3.97e-05 | 6.18e-04 | 26 |
| GO:00726559 | Cervix | CC | establishment of protein localization to mitochondrion | 31/2311 | 120/18723 | 4.13e-05 | 6.36e-04 | 31 |
| GO:00064657 | Cervix | CC | signal peptide processing | 8/2311 | 14/18723 | 8.01e-05 | 1.09e-03 | 8 |
| GO:00066269 | Cervix | CC | protein targeting to mitochondrion | 25/2311 | 100/18723 | 3.80e-04 | 3.89e-03 | 25 |
| GO:00516048 | Cervix | CC | protein maturation | 56/2311 | 294/18723 | 5.90e-04 | 5.59e-03 | 56 |
| GO:00725939 | Cervix | CC | reactive oxygen species metabolic process | 47/2311 | 239/18723 | 7.74e-04 | 6.87e-03 | 47 |
| GO:0006801 | Cervix | CC | superoxide metabolic process | 17/2311 | 74/18723 | 7.73e-03 | 4.10e-02 | 17 |
| GO:0006091 | Colorectum | AD | generation of precursor metabolites and energy | 209/3918 | 490/18723 | 3.17e-28 | 6.61e-25 | 209 |
| GO:0045333 | Colorectum | AD | cellular respiration | 119/3918 | 230/18723 | 3.21e-25 | 4.02e-22 | 119 |
| Page: 1 2 3 4 5 6 7 8 9 10 11 12 13 14 15 16 17 18 19 |
| Pathway ID | Tissue | Disease Stage | Description | Gene Ratio | Bg Ratio | pvalue | p.adjust | qvalue | Count |
| hsa03060 | Colorectum | AD | Protein export | 14/2092 | 23/8465 | 2.43e-04 | 1.90e-03 | 1.21e-03 | 14 |
| hsa030601 | Colorectum | AD | Protein export | 14/2092 | 23/8465 | 2.43e-04 | 1.90e-03 | 1.21e-03 | 14 |
| hsa030602 | Colorectum | MSS | Protein export | 15/1875 | 23/8465 | 1.13e-05 | 1.26e-04 | 7.71e-05 | 15 |
| hsa030603 | Colorectum | MSS | Protein export | 15/1875 | 23/8465 | 1.13e-05 | 1.26e-04 | 7.71e-05 | 15 |
| hsa030604 | Colorectum | MSI-H | Protein export | 11/797 | 23/8465 | 2.26e-06 | 3.65e-05 | 3.06e-05 | 11 |
| hsa030605 | Colorectum | MSI-H | Protein export | 11/797 | 23/8465 | 2.26e-06 | 3.65e-05 | 3.06e-05 | 11 |
| hsa030606 | Colorectum | FAP | Protein export | 10/1404 | 23/8465 | 2.17e-03 | 1.05e-02 | 6.39e-03 | 10 |
| hsa030607 | Colorectum | FAP | Protein export | 10/1404 | 23/8465 | 2.17e-03 | 1.05e-02 | 6.39e-03 | 10 |
| hsa0306014 | Endometrium | AEH | Protein export | 11/1197 | 23/8465 | 1.14e-04 | 1.06e-03 | 7.73e-04 | 11 |
| hsa0306015 | Endometrium | AEH | Protein export | 11/1197 | 23/8465 | 1.14e-04 | 1.06e-03 | 7.73e-04 | 11 |
| hsa0306021 | Liver | HCC | Protein export | 21/4020 | 23/8465 | 1.20e-05 | 8.53e-05 | 4.74e-05 | 21 |
| hsa0306031 | Liver | HCC | Protein export | 21/4020 | 23/8465 | 1.20e-05 | 8.53e-05 | 4.74e-05 | 21 |
| Page: 1 |
Top |
Cell-cell communication analysis |
| Identification of potential cell-cell interactions between two cell types and their ligand-receptor pairs for different disease states |
| Ligand | Receptor | LRpair | Pathway | Tissue | Disease Stage |
| Page: 1 |
Top |
Single-cell gene regulatory network inference analysis |
| Find out the significant the regulons (TFs) and the target genes of each regulon across cell types for different disease states |
| TF | Cell Type | Tissue | Disease Stage | Target Gene | RSS | Regulon Activity |
| ∗The dot plots of a searched regulon are shown for all cell subpopulations in each disease state of each tissue based on the regulon specific score inferred using pySCENIC and by calculating the average expression. |
| Page: 1 |
Top |
Somatic mutation of malignant transformation related genes |
| Annotation of somatic variants for genes involved in malignant transformation |
| Hugo Symbol | Variant Class | Variant Classification | dbSNP RS | HGVSc | HGVSp | HGVSp Short | SWISSPROT | BIOTYPE | SIFT | PolyPhen | Tumor Sample Barcode | Tissue | Histology | Sex | Age | Stage | Therapy Types | Drugs | Outcome |
| IMMP2L | SNV | Missense_Mutation | c.149C>T | p.Pro50Leu | p.P50L | Q96T52 | protein_coding | deleterious(0) | probably_damaging(0.999) | TCGA-C8-A26V-01 | Breast | breast invasive carcinoma | Female | <65 | III/IV | Hormone Therapy | tamoxiphen | CR | |
| IMMP2L | SNV | Missense_Mutation | novel | c.79N>C | p.Val27Leu | p.V27L | Q96T52 | protein_coding | tolerated(0.26) | probably_damaging(0.956) | TCGA-GM-A3XL-01 | Breast | breast invasive carcinoma | Female | <65 | I/II | Chemotherapy | fluorouracil | CR |
| IMMP2L | SNV | Missense_Mutation | novel | c.520G>C | p.Glu174Gln | p.E174Q | Q96T52 | protein_coding | tolerated(0.11) | benign(0) | TCGA-C5-A7X5-01 | Cervix | cervical & endocervical cancer | Female | >=65 | I/II | Chemotherapy | carboplatin | PD |
| IMMP2L | SNV | Missense_Mutation | c.346G>A | p.Gly116Ser | p.G116S | Q96T52 | protein_coding | deleterious(0) | benign(0.326) | TCGA-A6-4107-01 | Colorectum | colon adenocarcinoma | Female | <65 | III/IV | Chemotherapy | 5 | SD | |
| IMMP2L | SNV | Missense_Mutation | c.437C>T | p.Ala146Val | p.A146V | Q96T52 | protein_coding | tolerated(0.08) | probably_damaging(0.968) | TCGA-A6-5665-01 | Colorectum | colon adenocarcinoma | Female | >=65 | I/II | Unknown | Unknown | PD | |
| IMMP2L | SNV | Missense_Mutation | novel | c.263A>C | p.Lys88Thr | p.K88T | Q96T52 | protein_coding | tolerated(0.21) | probably_damaging(0.979) | TCGA-AA-3877-01 | Colorectum | colon adenocarcinoma | Female | >=65 | I/II | Unknown | Unknown | SD |
| IMMP2L | SNV | Missense_Mutation | rs375048435 | c.398N>A | p.Ser133Tyr | p.S133Y | Q96T52 | protein_coding | tolerated(0.71) | benign(0.123) | TCGA-EI-6917-01 | Colorectum | rectum adenocarcinoma | Male | <65 | III/IV | Chemotherapy | 5fluorouracil+oxaciplatina+l-folinian | SD |
| IMMP2L | SNV | Missense_Mutation | novel | c.401T>G | p.Phe134Cys | p.F134C | Q96T52 | protein_coding | deleterious(0) | probably_damaging(0.99) | TCGA-AP-A056-01 | Endometrium | uterine corpus endometrioid carcinoma | Female | <65 | I/II | Unknown | Unknown | SD |
| IMMP2L | SNV | Missense_Mutation | rs375048435 | c.398N>A | p.Ser133Tyr | p.S133Y | Q96T52 | protein_coding | tolerated(0.71) | benign(0.123) | TCGA-BS-A0UF-01 | Endometrium | uterine corpus endometrioid carcinoma | Female | >=65 | I/II | Unknown | Unknown | SD |
| IMMP2L | SNV | Missense_Mutation | novel | c.522G>T | p.Glu174Asp | p.E174D | Q96T52 | protein_coding | tolerated(0.06) | benign(0) | TCGA-DF-A2KN-01 | Endometrium | uterine corpus endometrioid carcinoma | Female | Unknown | I/II | Unknown | Unknown | SD |
| Page: 1 2 3 |
Top |
Related drugs of malignant transformation related genes |
| Identification of chemicals and drugs interact with genes involved in malignant transfromation |
| (DGIdb 4.0) |
| Entrez ID | Symbol | Category | Interaction Types | Drug Claim Name | Drug Name | PMIDs |
| Page: 1 |

Copyright 2023-Present -The University of Texas Health Science Center at Houston |