
|
|||||
|
 | |
| |
| |
| |
| |
| |
|
Gene: IMMP1L |
Gene summary for IMMP1L |
| Gene information | Species | Human | Gene symbol | IMMP1L | Gene ID | 196294 |
| Gene name | inner mitochondrial membrane peptidase subunit 1 | |
| Gene Alias | IMMP1 | |
| Cytomap | 11p13 | |
| Gene Type | protein-coding | GO ID | GO:0006465 | UniProtAcc | Q96LU5 |
Top |
Malignant transformation analysis |
| Identification of the aberrant gene expression in precancerous and cancerous lesions by comparing the gene expression of stem-like cells in diseased tissues with normal stem cells |
| Entrez ID | Symbol | Replicates | Species | Organ | Tissue | Adj P-value | Log2FC | Malignancy |
| 196294 | IMMP1L | LZE2T | Human | Esophagus | ESCC | 9.29e-04 | 3.60e-01 | 0.082 |
| 196294 | IMMP1L | LZE4T | Human | Esophagus | ESCC | 6.45e-08 | 2.15e-01 | 0.0811 |
| 196294 | IMMP1L | LZE7T | Human | Esophagus | ESCC | 5.51e-08 | 4.21e-01 | 0.0667 |
| 196294 | IMMP1L | LZE8T | Human | Esophagus | ESCC | 9.18e-04 | 2.20e-01 | 0.067 |
| 196294 | IMMP1L | LZE22T | Human | Esophagus | ESCC | 3.35e-02 | 2.25e-01 | 0.068 |
| 196294 | IMMP1L | LZE24T | Human | Esophagus | ESCC | 8.32e-11 | 3.24e-01 | 0.0596 |
| 196294 | IMMP1L | LZE6T | Human | Esophagus | ESCC | 1.49e-09 | 4.09e-01 | 0.0845 |
| 196294 | IMMP1L | P1T-E | Human | Esophagus | ESCC | 1.09e-06 | 3.60e-01 | 0.0875 |
| 196294 | IMMP1L | P2T-E | Human | Esophagus | ESCC | 4.12e-18 | 3.22e-01 | 0.1177 |
| 196294 | IMMP1L | P4T-E | Human | Esophagus | ESCC | 1.21e-12 | 3.25e-01 | 0.1323 |
| 196294 | IMMP1L | P5T-E | Human | Esophagus | ESCC | 2.26e-11 | 1.66e-01 | 0.1327 |
| 196294 | IMMP1L | P8T-E | Human | Esophagus | ESCC | 2.39e-21 | 3.53e-01 | 0.0889 |
| 196294 | IMMP1L | P9T-E | Human | Esophagus | ESCC | 1.02e-11 | 3.06e-01 | 0.1131 |
| 196294 | IMMP1L | P10T-E | Human | Esophagus | ESCC | 1.81e-33 | 5.63e-01 | 0.116 |
| 196294 | IMMP1L | P11T-E | Human | Esophagus | ESCC | 6.62e-17 | 4.35e-01 | 0.1426 |
| 196294 | IMMP1L | P12T-E | Human | Esophagus | ESCC | 3.83e-17 | 3.19e-01 | 0.1122 |
| 196294 | IMMP1L | P15T-E | Human | Esophagus | ESCC | 1.18e-06 | 1.36e-01 | 0.1149 |
| 196294 | IMMP1L | P16T-E | Human | Esophagus | ESCC | 1.57e-11 | 2.71e-01 | 0.1153 |
| 196294 | IMMP1L | P17T-E | Human | Esophagus | ESCC | 1.88e-07 | 3.17e-01 | 0.1278 |
| 196294 | IMMP1L | P19T-E | Human | Esophagus | ESCC | 8.45e-04 | 2.90e-01 | 0.1662 |
| Page: 1 2 3 4 5 |
| Tissue | Expression Dynamics | Abbreviation |
| Esophagus |  | ESCC: Esophageal squamous cell carcinoma |
| HGIN: High-grade intraepithelial neoplasias | ||
| LGIN: Low-grade intraepithelial neoplasias | ||
| Oral Cavity | 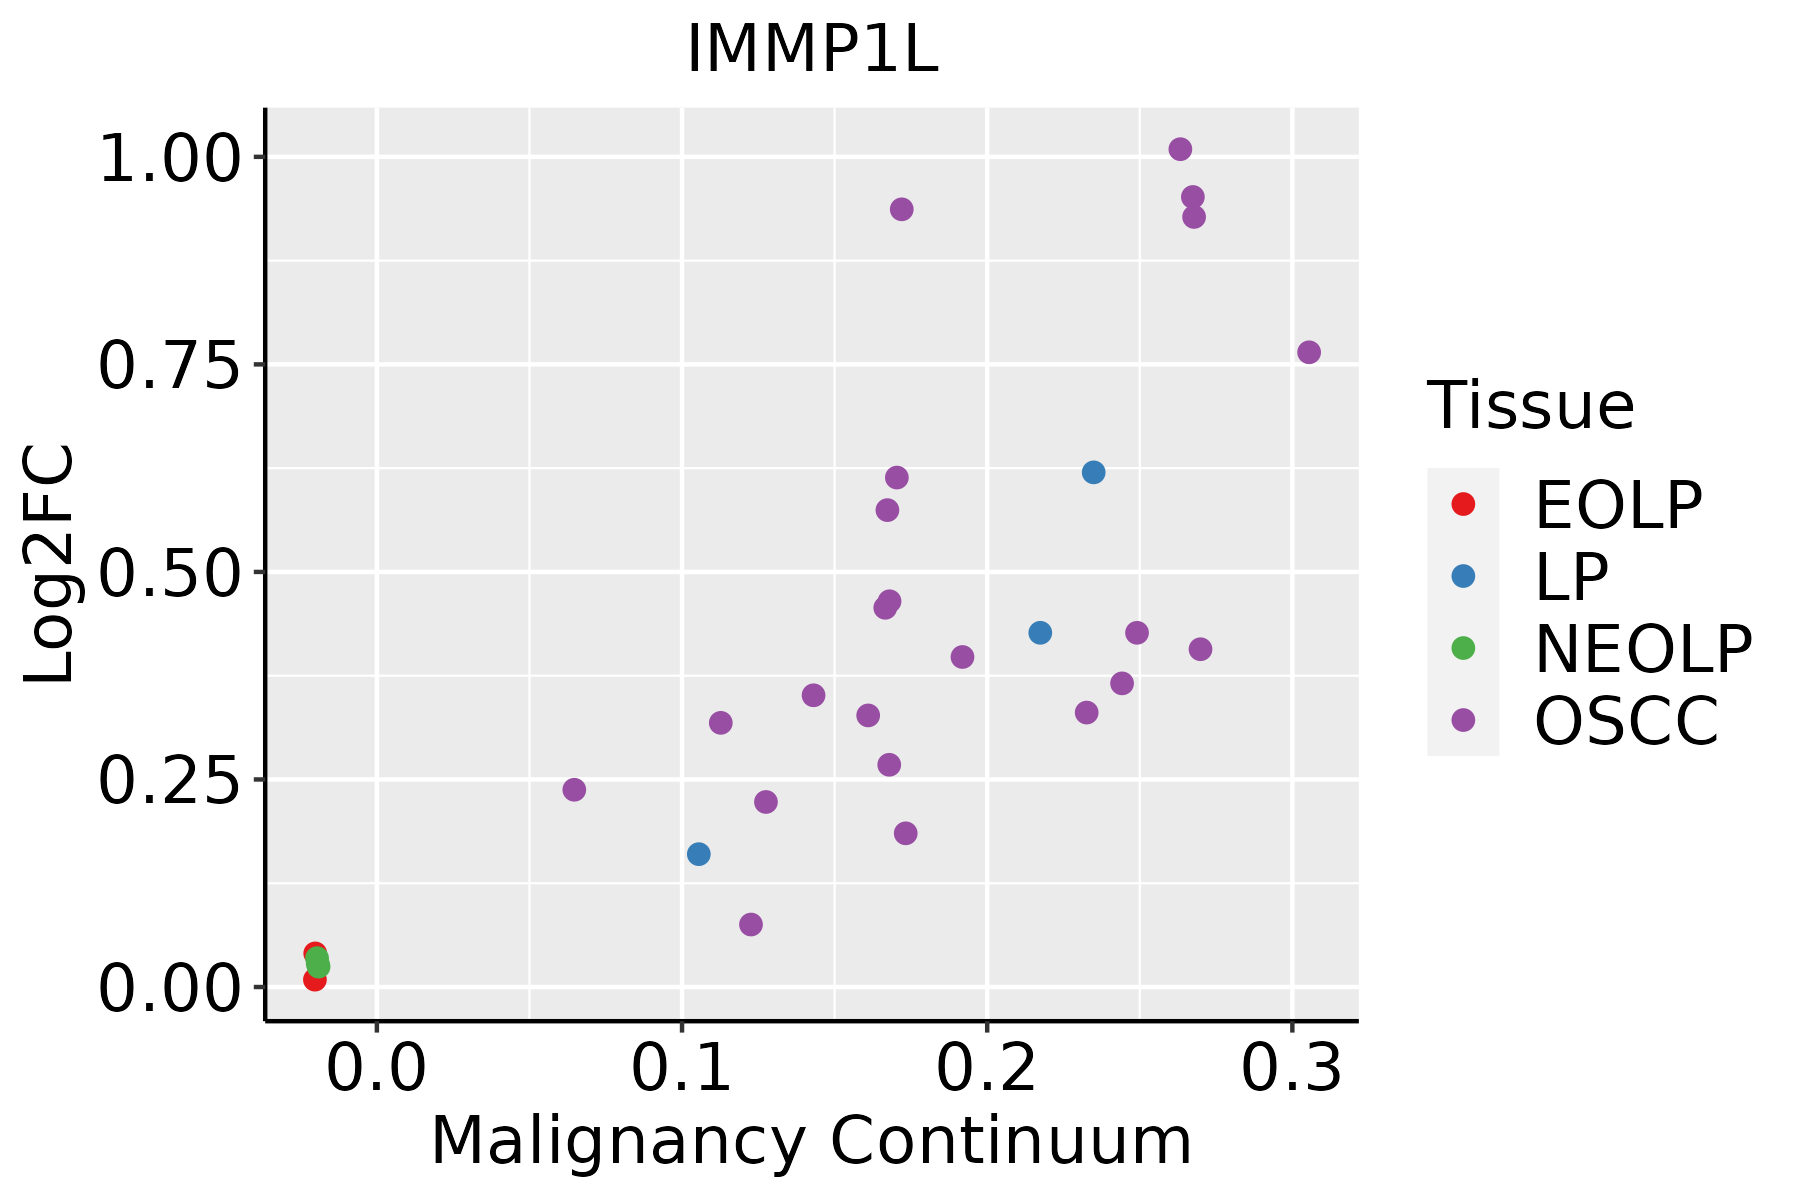 | EOLP: Erosive Oral lichen planus |
| LP: leukoplakia | ||
| NEOLP: Non-erosive oral lichen planus | ||
| OSCC: Oral squamous cell carcinoma | ||
| Skin | 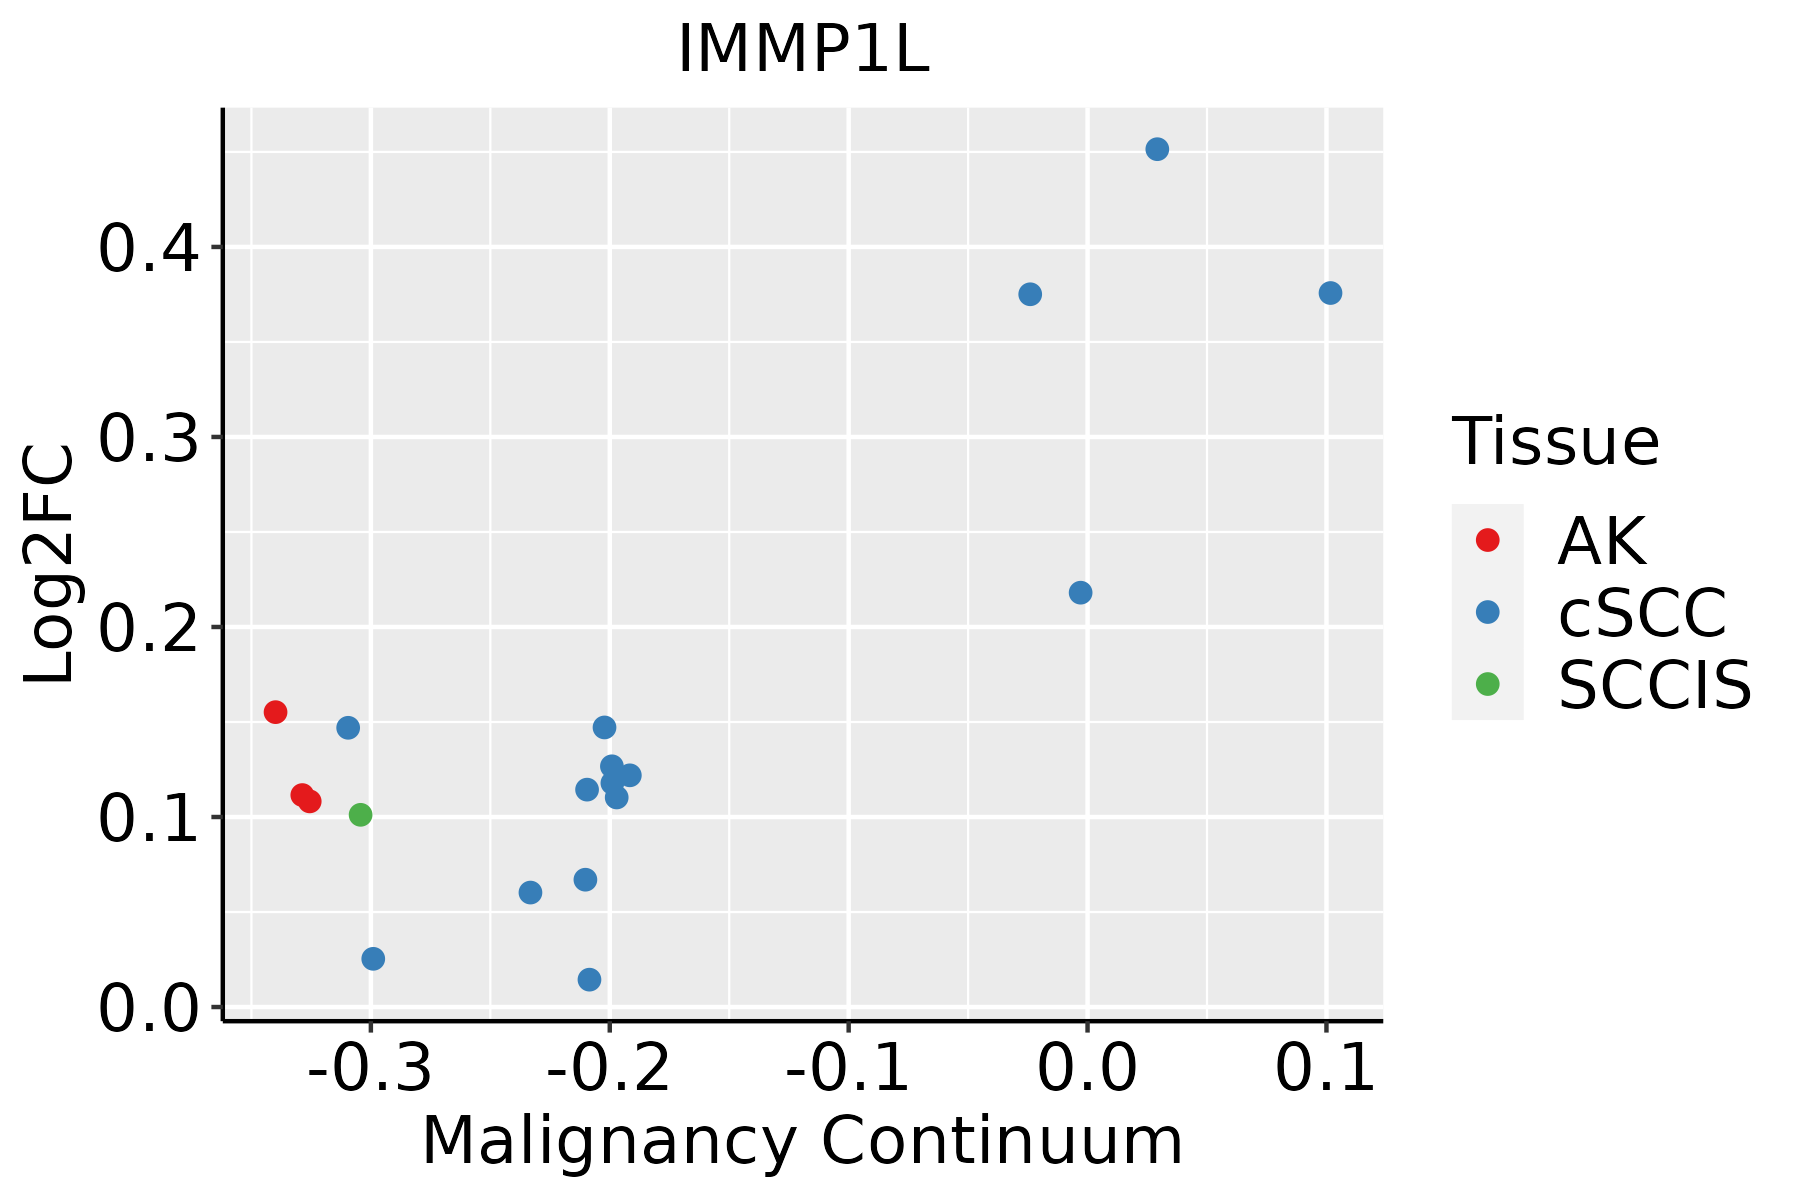 | AK: Actinic keratosis |
| cSCC: Cutaneous squamous cell carcinoma | ||
| SCCIS:squamous cell carcinoma in situ |
| ∗log2FC in expression of this searched gene in stem-like cells from each diseased tissue sample relative to stem-like cells in normal samples in each tissue plotted against the malignancy continuum. Samples are colored based on if they are from different disease stage. |
Top |
Malignant transformation related pathway analysis |
| Find out the enriched GO biological processes and KEGG pathways involved in transition from healthy to precancer to cancer |
| Tissue | Disease Stage | Enriched GO biological Processes |
| Colorectum | AD |  |
| Colorectum | SER |  |
| Colorectum | MSS |  |
| Colorectum | MSI-H |  |
| Colorectum | FAP |  |
| ∗Top 15 enriched GO BP terms are showed in the bar plot of each disease state in each tissue. Each row represents a significant GO biological process which is colored according to the -log10(p.adjust). |
| Page: 1 2 3 4 5 6 7 8 9 |
| GO ID | Tissue | Disease Stage | Description | Gene Ratio | Bg Ratio | pvalue | p.adjust | Count |
| GO:0072594110 | Esophagus | ESCC | establishment of protein localization to organelle | 311/8552 | 422/18723 | 3.02e-32 | 2.13e-29 | 311 |
| GO:0006605111 | Esophagus | ESCC | protein targeting | 229/8552 | 314/18723 | 4.93e-23 | 1.01e-20 | 229 |
| GO:0006839110 | Esophagus | ESCC | mitochondrial transport | 187/8552 | 254/18723 | 8.35e-20 | 9.81e-18 | 187 |
| GO:0072655110 | Esophagus | ESCC | establishment of protein localization to mitochondrion | 97/8552 | 120/18723 | 2.17e-15 | 1.33e-13 | 97 |
| GO:0070585110 | Esophagus | ESCC | protein localization to mitochondrion | 100/8552 | 125/18723 | 2.96e-15 | 1.77e-13 | 100 |
| GO:0006626110 | Esophagus | ESCC | protein targeting to mitochondrion | 81/8552 | 100/18723 | 3.60e-13 | 1.67e-11 | 81 |
| GO:005160418 | Esophagus | ESCC | protein maturation | 189/8552 | 294/18723 | 7.64e-11 | 2.39e-09 | 189 |
| GO:001648514 | Esophagus | ESCC | protein processing | 134/8552 | 225/18723 | 1.81e-05 | 1.60e-04 | 134 |
| GO:000646516 | Esophagus | ESCC | signal peptide processing | 13/8552 | 14/18723 | 3.02e-04 | 1.81e-03 | 13 |
| GO:007259418 | Oral cavity | OSCC | establishment of protein localization to organelle | 284/7305 | 422/18723 | 1.50e-32 | 1.35e-29 | 284 |
| GO:000660520 | Oral cavity | OSCC | protein targeting | 204/7305 | 314/18723 | 6.78e-21 | 1.13e-18 | 204 |
| GO:000683918 | Oral cavity | OSCC | mitochondrial transport | 162/7305 | 254/18723 | 8.96e-16 | 6.52e-14 | 162 |
| GO:007058518 | Oral cavity | OSCC | protein localization to mitochondrion | 91/7305 | 125/18723 | 1.60e-14 | 9.27e-13 | 91 |
| GO:007265518 | Oral cavity | OSCC | establishment of protein localization to mitochondrion | 88/7305 | 120/18723 | 2.10e-14 | 1.19e-12 | 88 |
| GO:000662618 | Oral cavity | OSCC | protein targeting to mitochondrion | 72/7305 | 100/18723 | 2.10e-11 | 7.18e-10 | 72 |
| GO:005160410 | Oral cavity | OSCC | protein maturation | 170/7305 | 294/18723 | 3.97e-11 | 1.28e-09 | 170 |
| GO:00164856 | Oral cavity | OSCC | protein processing | 121/7305 | 225/18723 | 4.56e-06 | 5.23e-05 | 121 |
| GO:000646510 | Oral cavity | OSCC | signal peptide processing | 12/7305 | 14/18723 | 4.62e-04 | 2.76e-03 | 12 |
| GO:007259419 | Oral cavity | LP | establishment of protein localization to organelle | 205/4623 | 422/18723 | 6.76e-27 | 3.85e-24 | 205 |
| GO:0006605110 | Oral cavity | LP | protein targeting | 156/4623 | 314/18723 | 5.43e-22 | 1.62e-19 | 156 |
| Page: 1 2 |
| Pathway ID | Tissue | Disease Stage | Description | Gene Ratio | Bg Ratio | pvalue | p.adjust | qvalue | Count |
| hsa0306026 | Esophagus | ESCC | Protein export | 22/4205 | 23/8465 | 2.43e-06 | 1.43e-05 | 7.32e-06 | 22 |
| hsa0306036 | Esophagus | ESCC | Protein export | 22/4205 | 23/8465 | 2.43e-06 | 1.43e-05 | 7.32e-06 | 22 |
| hsa0306018 | Oral cavity | OSCC | Protein export | 21/3704 | 23/8465 | 2.42e-06 | 1.27e-05 | 6.45e-06 | 21 |
| hsa0306019 | Oral cavity | OSCC | Protein export | 21/3704 | 23/8465 | 2.42e-06 | 1.27e-05 | 6.45e-06 | 21 |
| Page: 1 |
Top |
Cell-cell communication analysis |
| Identification of potential cell-cell interactions between two cell types and their ligand-receptor pairs for different disease states |
| Ligand | Receptor | LRpair | Pathway | Tissue | Disease Stage |
| Page: 1 |
Top |
Single-cell gene regulatory network inference analysis |
| Find out the significant the regulons (TFs) and the target genes of each regulon across cell types for different disease states |
| TF | Cell Type | Tissue | Disease Stage | Target Gene | RSS | Regulon Activity |
| ∗The dot plots of a searched regulon are shown for all cell subpopulations in each disease state of each tissue based on the regulon specific score inferred using pySCENIC and by calculating the average expression. |
| Page: 1 |
Top |
Somatic mutation of malignant transformation related genes |
| Annotation of somatic variants for genes involved in malignant transformation |
| Hugo Symbol | Variant Class | Variant Classification | dbSNP RS | HGVSc | HGVSp | HGVSp Short | SWISSPROT | BIOTYPE | SIFT | PolyPhen | Tumor Sample Barcode | Tissue | Histology | Sex | Age | Stage | Therapy Types | Drugs | Outcome |
| IMMP1L | SNV | Missense_Mutation | c.228T>A | p.Asp76Glu | p.D76E | Q96LU5 | protein_coding | deleterious(0.02) | benign(0.06) | TCGA-A2-A0T2-01 | Breast | breast invasive carcinoma | Female | >=65 | III/IV | Chemotherapy | xeloda | PD | |
| IMMP1L | SNV | Missense_Mutation | rs180782155 | c.32N>A | p.Arg11Gln | p.R11Q | Q96LU5 | protein_coding | tolerated(0.51) | benign(0.031) | TCGA-AN-A046-01 | Breast | breast invasive carcinoma | Female | >=65 | I/II | Unknown | Unknown | SD |
| IMMP1L | SNV | Missense_Mutation | c.228T>A | p.Asp76Glu | p.D76E | Q96LU5 | protein_coding | deleterious(0.02) | benign(0.06) | TCGA-AR-A0TY-01 | Breast | breast invasive carcinoma | Female | <65 | I/II | Unspecific | Paclitaxel | PD | |
| IMMP1L | SNV | Missense_Mutation | c.145N>A | p.Asp49Asn | p.D49N | Q96LU5 | protein_coding | tolerated(0.33) | possibly_damaging(0.819) | TCGA-JW-A5VL-01 | Cervix | cervical & endocervical cancer | Female | <65 | I/II | Unknown | Unknown | SD | |
| IMMP1L | SNV | Missense_Mutation | c.366N>A | p.Asn122Lys | p.N122K | Q96LU5 | protein_coding | deleterious(0) | benign(0.05) | TCGA-AA-A01R-01 | Colorectum | colon adenocarcinoma | Male | <65 | III/IV | Chemotherapy | 5-fluorouracil | PD | |
| IMMP1L | SNV | Missense_Mutation | novel | c.240N>A | p.Asn80Lys | p.N80K | Q96LU5 | protein_coding | tolerated(0.28) | benign(0.102) | TCGA-A5-A2K5-01 | Endometrium | uterine corpus endometrioid carcinoma | Female | >=65 | I/II | Unknown | Unknown | SD |
| IMMP1L | SNV | Missense_Mutation | rs180782155 | c.32N>A | p.Arg11Gln | p.R11Q | Q96LU5 | protein_coding | tolerated(0.51) | benign(0.031) | TCGA-B5-A11E-01 | Endometrium | uterine corpus endometrioid carcinoma | Female | <65 | I/II | Unknown | Unknown | SD |
| IMMP1L | SNV | Missense_Mutation | novel | c.124N>A | p.Glu42Lys | p.E42K | Q96LU5 | protein_coding | deleterious(0.01) | possibly_damaging(0.771) | TCGA-B5-A3FA-01 | Endometrium | uterine corpus endometrioid carcinoma | Female | >=65 | I/II | Unknown | Unknown | SD |
| IMMP1L | SNV | Missense_Mutation | rs746866007 | c.419N>A | p.Arg140Gln | p.R140Q | Q96LU5 | protein_coding | deleterious(0) | possibly_damaging(0.854) | TCGA-D1-A16Y-01 | Endometrium | uterine corpus endometrioid carcinoma | Female | <65 | I/II | Unknown | Unknown | SD |
| IMMP1L | insertion | Frame_Shift_Ins | novel | c.135dupT | p.Gln46SerfsTer12 | p.Q46Sfs*12 | Q96LU5 | protein_coding | TCGA-DD-A3A7-01 | Liver | liver hepatocellular carcinoma | Male | >=65 | III/IV | Chemotherapy | unknown | PD |
| Page: 1 2 |
Top |
Related drugs of malignant transformation related genes |
| Identification of chemicals and drugs interact with genes involved in malignant transfromation |
| (DGIdb 4.0) |
| Entrez ID | Symbol | Category | Interaction Types | Drug Claim Name | Drug Name | PMIDs |
| Page: 1 |

Copyright 2023-Present -The University of Texas Health Science Center at Houston |