
|
|||||
|
 | |
| |
| |
| |
| |
| |
|
Gene: ILVBL |
Gene summary for ILVBL |
| Gene information | Species | Human | Gene symbol | ILVBL | Gene ID | 10994 |
| Gene name | ilvB acetolactate synthase like | |
| Gene Alias | 209L8 | |
| Cytomap | 19p13.12 | |
| Gene Type | protein-coding | GO ID | GO:0001561 | UniProtAcc | A1L0T0 |
Top |
Malignant transformation analysis |
| Identification of the aberrant gene expression in precancerous and cancerous lesions by comparing the gene expression of stem-like cells in diseased tissues with normal stem cells |
| Entrez ID | Symbol | Replicates | Species | Organ | Tissue | Adj P-value | Log2FC | Malignancy |
| 10994 | ILVBL | LZE4T | Human | Esophagus | ESCC | 1.18e-08 | 2.50e-01 | 0.0811 |
| 10994 | ILVBL | LZE7T | Human | Esophagus | ESCC | 1.31e-04 | 3.67e-01 | 0.0667 |
| 10994 | ILVBL | LZE20T | Human | Esophagus | ESCC | 6.45e-04 | 7.02e-02 | 0.0662 |
| 10994 | ILVBL | LZE24T | Human | Esophagus | ESCC | 7.47e-20 | 4.93e-01 | 0.0596 |
| 10994 | ILVBL | LZE6T | Human | Esophagus | ESCC | 4.83e-02 | 3.03e-01 | 0.0845 |
| 10994 | ILVBL | P1T-E | Human | Esophagus | ESCC | 3.86e-16 | 7.19e-01 | 0.0875 |
| 10994 | ILVBL | P2T-E | Human | Esophagus | ESCC | 1.18e-19 | 2.82e-01 | 0.1177 |
| 10994 | ILVBL | P4T-E | Human | Esophagus | ESCC | 1.12e-23 | 5.97e-01 | 0.1323 |
| 10994 | ILVBL | P5T-E | Human | Esophagus | ESCC | 2.19e-08 | 2.28e-01 | 0.1327 |
| 10994 | ILVBL | P8T-E | Human | Esophagus | ESCC | 1.00e-20 | 4.43e-01 | 0.0889 |
| 10994 | ILVBL | P9T-E | Human | Esophagus | ESCC | 4.99e-13 | 4.63e-01 | 0.1131 |
| 10994 | ILVBL | P10T-E | Human | Esophagus | ESCC | 1.57e-34 | 6.69e-01 | 0.116 |
| 10994 | ILVBL | P11T-E | Human | Esophagus | ESCC | 1.18e-11 | 5.69e-01 | 0.1426 |
| 10994 | ILVBL | P12T-E | Human | Esophagus | ESCC | 2.38e-31 | 6.33e-01 | 0.1122 |
| 10994 | ILVBL | P15T-E | Human | Esophagus | ESCC | 1.11e-22 | 4.05e-01 | 0.1149 |
| 10994 | ILVBL | P16T-E | Human | Esophagus | ESCC | 2.50e-15 | 2.46e-01 | 0.1153 |
| 10994 | ILVBL | P17T-E | Human | Esophagus | ESCC | 2.40e-11 | 4.78e-01 | 0.1278 |
| 10994 | ILVBL | P19T-E | Human | Esophagus | ESCC | 1.39e-09 | 6.74e-01 | 0.1662 |
| 10994 | ILVBL | P20T-E | Human | Esophagus | ESCC | 2.64e-17 | 3.94e-01 | 0.1124 |
| 10994 | ILVBL | P21T-E | Human | Esophagus | ESCC | 7.55e-31 | 6.90e-01 | 0.1617 |
| Page: 1 2 3 4 5 6 |
| Tissue | Expression Dynamics | Abbreviation |
| Esophagus | 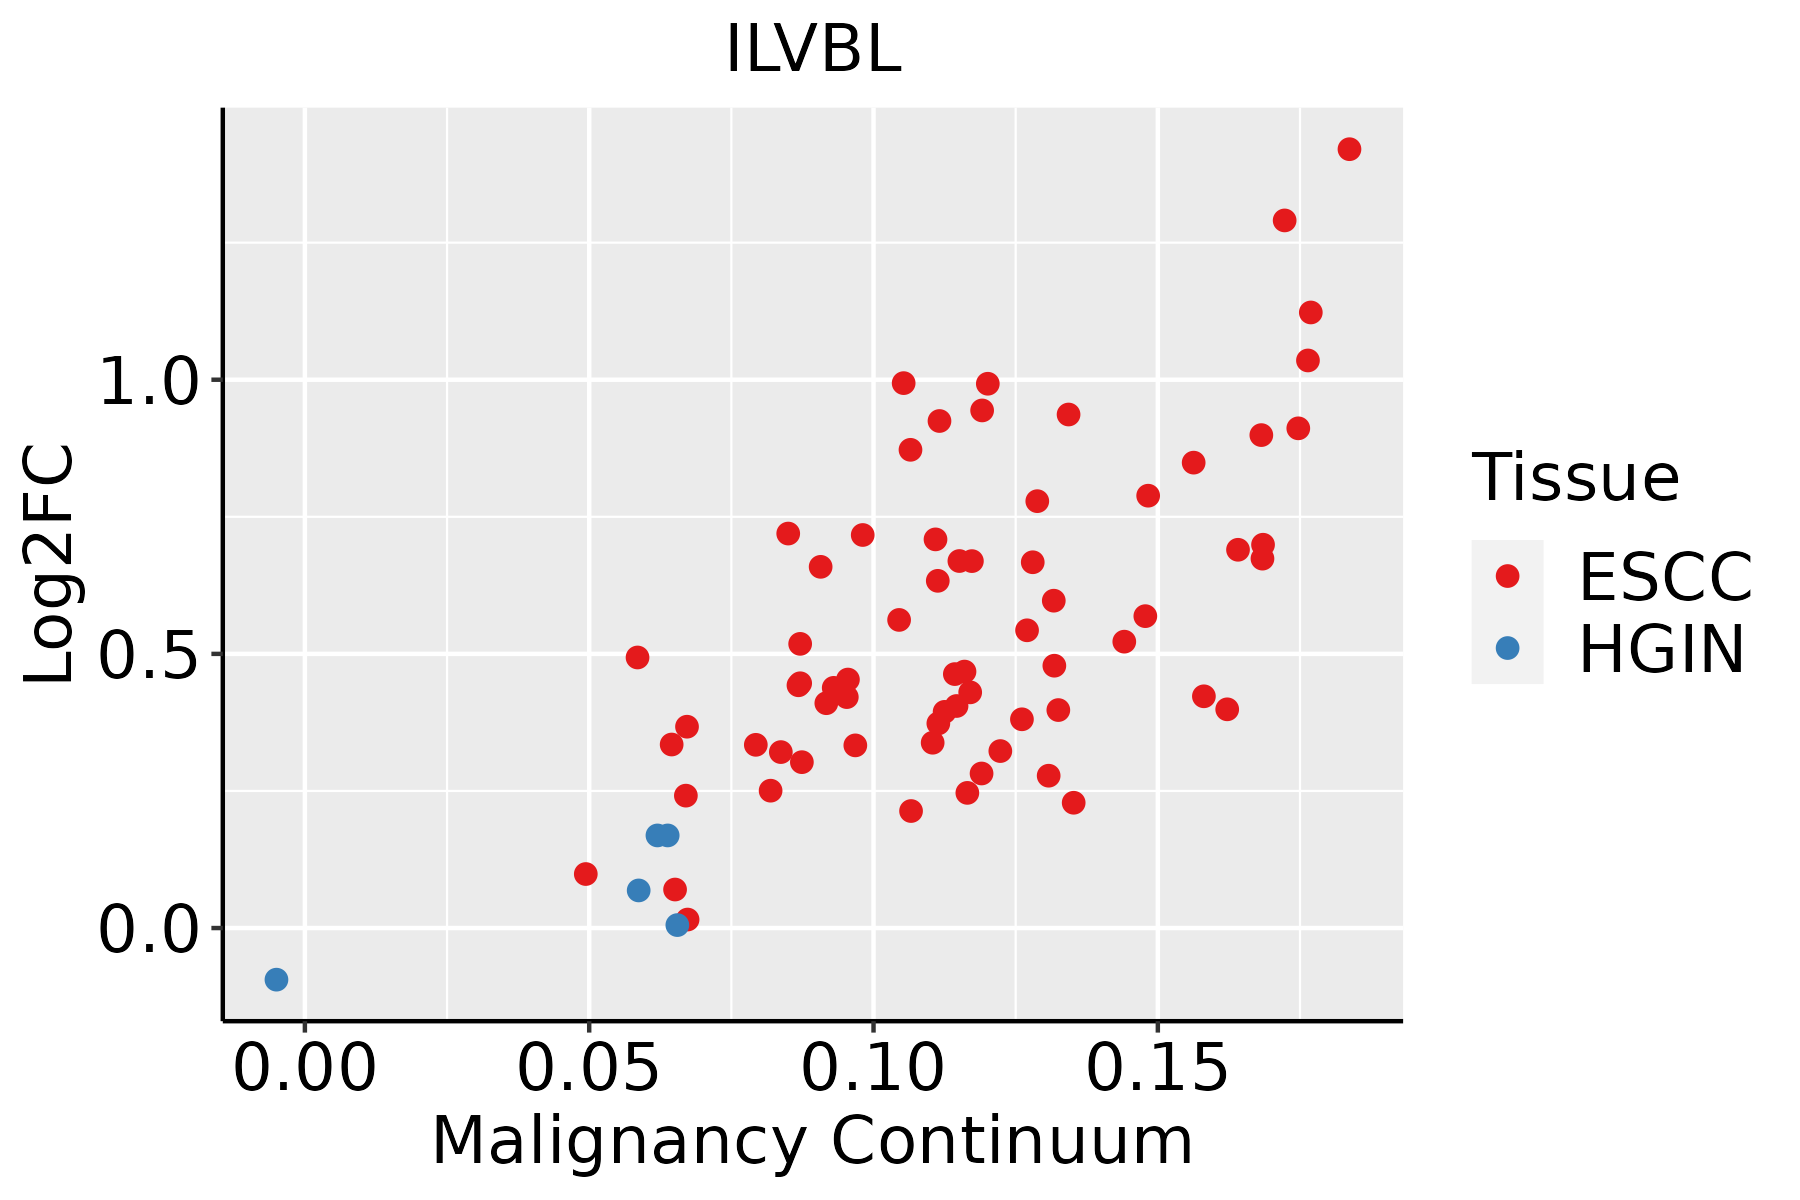 | ESCC: Esophageal squamous cell carcinoma |
| HGIN: High-grade intraepithelial neoplasias | ||
| LGIN: Low-grade intraepithelial neoplasias | ||
| Liver |  | HCC: Hepatocellular carcinoma |
| NAFLD: Non-alcoholic fatty liver disease | ||
| Oral Cavity |  | EOLP: Erosive Oral lichen planus |
| LP: leukoplakia | ||
| NEOLP: Non-erosive oral lichen planus | ||
| OSCC: Oral squamous cell carcinoma | ||
| Skin |  | AK: Actinic keratosis |
| cSCC: Cutaneous squamous cell carcinoma | ||
| SCCIS:squamous cell carcinoma in situ | ||
| Thyroid | 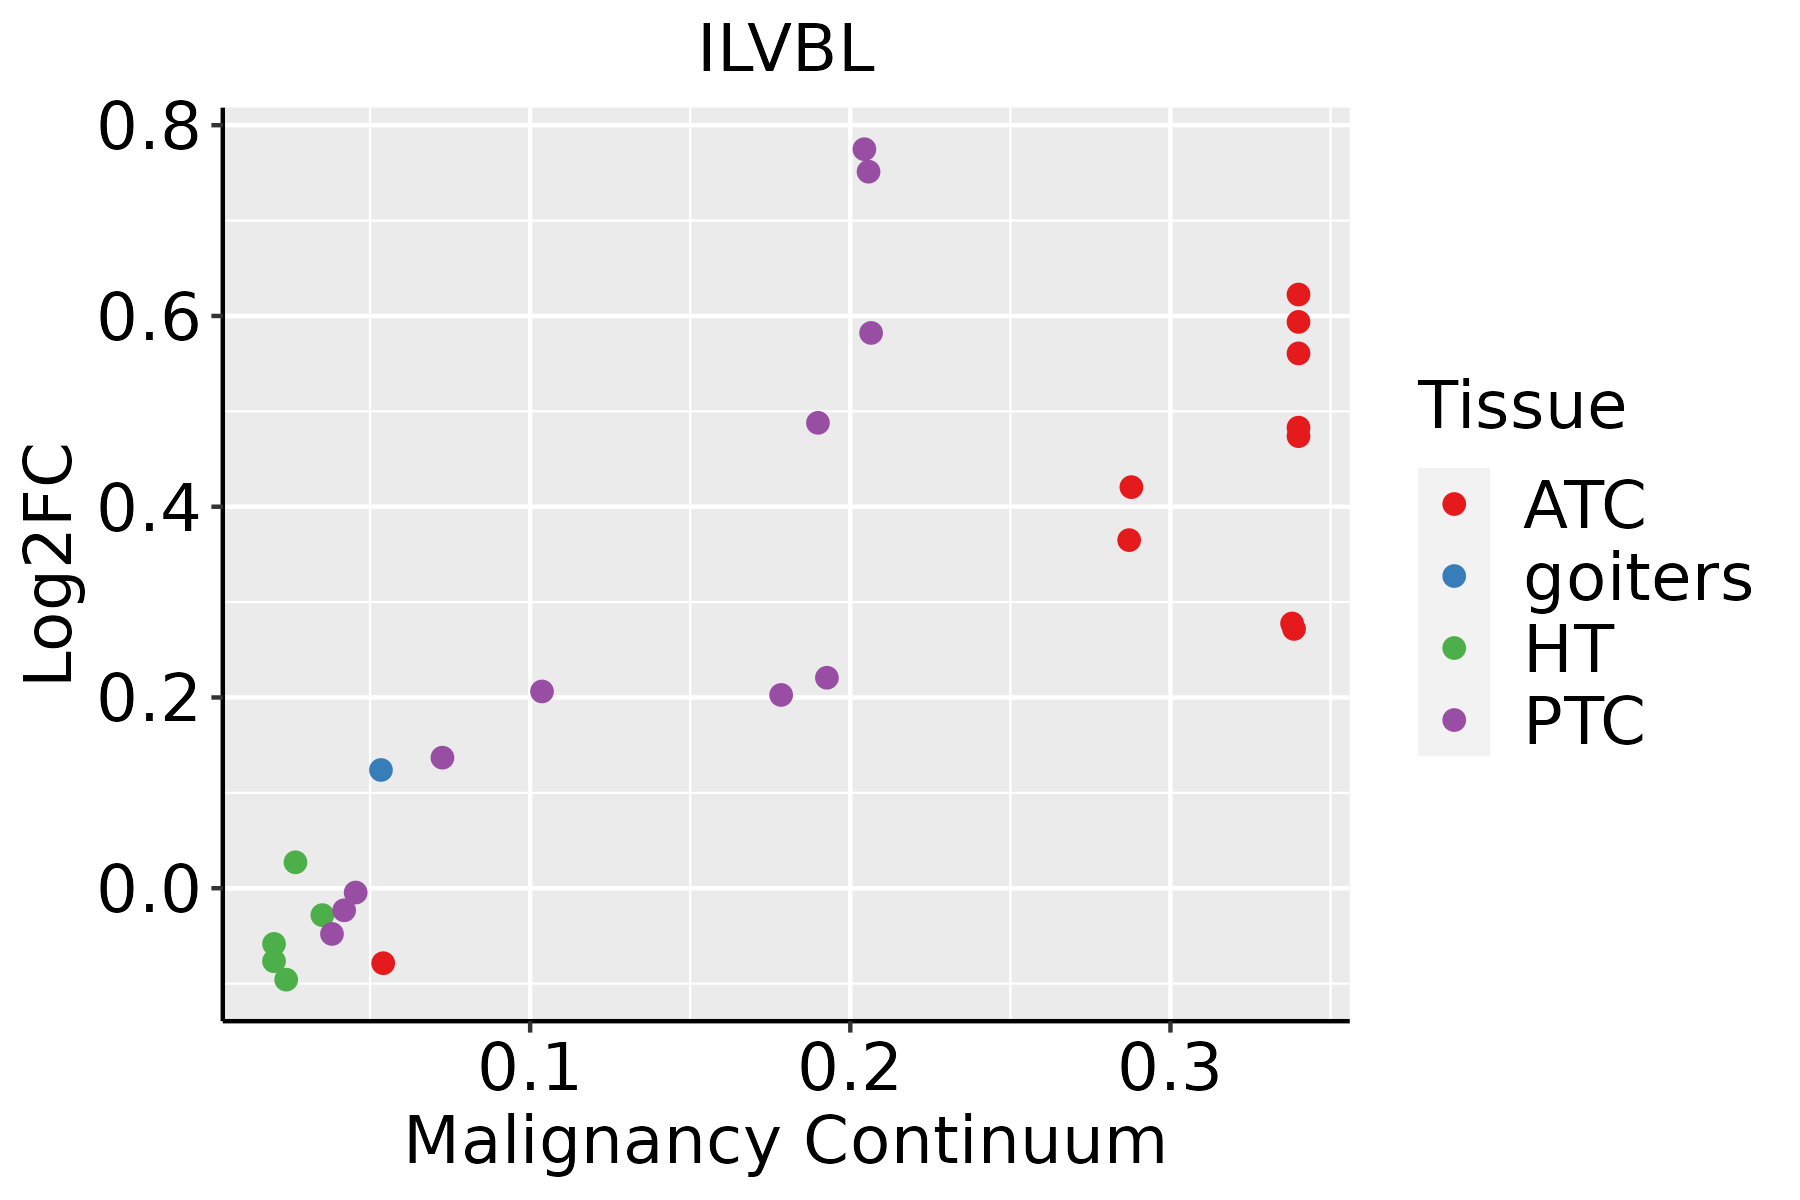 | ATC: Anaplastic thyroid cancer |
| HT: Hashimoto's thyroiditis | ||
| PTC: Papillary thyroid cancer |
| ∗log2FC in expression of this searched gene in stem-like cells from each diseased tissue sample relative to stem-like cells in normal samples in each tissue plotted against the malignancy continuum. Samples are colored based on if they are from different disease stage. |
Top |
Malignant transformation related pathway analysis |
| Find out the enriched GO biological processes and KEGG pathways involved in transition from healthy to precancer to cancer |
| Tissue | Disease Stage | Enriched GO biological Processes |
| Colorectum | AD |  |
| Colorectum | SER |  |
| Colorectum | MSS |  |
| Colorectum | MSI-H |  |
| Colorectum | FAP |  |
| ∗Top 15 enriched GO BP terms are showed in the bar plot of each disease state in each tissue. Each row represents a significant GO biological process which is colored according to the -log10(p.adjust). |
| Page: 1 2 3 4 5 6 7 8 9 |
| GO ID | Tissue | Disease Stage | Description | Gene Ratio | Bg Ratio | pvalue | p.adjust | Count |
| GO:00193958 | Esophagus | ESCC | fatty acid oxidation | 69/8552 | 103/18723 | 9.95e-06 | 9.44e-05 | 69 |
| GO:00344407 | Esophagus | ESCC | lipid oxidation | 71/8552 | 108/18723 | 2.00e-05 | 1.74e-04 | 71 |
| GO:00090628 | Esophagus | ESCC | fatty acid catabolic process | 66/8552 | 100/18723 | 3.21e-05 | 2.66e-04 | 66 |
| GO:00066318 | Esophagus | ESCC | fatty acid metabolic process | 217/8552 | 390/18723 | 4.21e-05 | 3.39e-04 | 217 |
| GO:00086525 | Esophagus | ESCC | cellular amino acid biosynthetic process | 51/8552 | 76/18723 | 1.30e-04 | 8.88e-04 | 51 |
| GO:00463948 | Esophagus | ESCC | carboxylic acid biosynthetic process | 175/8552 | 314/18723 | 1.98e-04 | 1.26e-03 | 175 |
| GO:00160538 | Esophagus | ESCC | organic acid biosynthetic process | 175/8552 | 316/18723 | 3.04e-04 | 1.82e-03 | 175 |
| GO:19016075 | Esophagus | ESCC | alpha-amino acid biosynthetic process | 45/8552 | 68/18723 | 5.13e-04 | 2.84e-03 | 45 |
| GO:00723297 | Esophagus | ESCC | monocarboxylic acid catabolic process | 74/8552 | 122/18723 | 6.03e-04 | 3.27e-03 | 74 |
| GO:00442427 | Esophagus | ESCC | cellular lipid catabolic process | 121/8552 | 214/18723 | 8.63e-04 | 4.43e-03 | 121 |
| GO:00442827 | Esophagus | ESCC | small molecule catabolic process | 201/8552 | 376/18723 | 1.35e-03 | 6.41e-03 | 201 |
| GO:00302586 | Esophagus | ESCC | lipid modification | 116/8552 | 212/18723 | 4.90e-03 | 1.89e-02 | 116 |
| GO:00160427 | Esophagus | ESCC | lipid catabolic process | 168/8552 | 320/18723 | 7.97e-03 | 2.84e-02 | 168 |
| GO:00090815 | Esophagus | ESCC | branched-chain amino acid metabolic process | 14/8552 | 19/18723 | 1.27e-02 | 4.21e-02 | 14 |
| GO:000663112 | Liver | Cirrhotic | fatty acid metabolic process | 165/4634 | 390/18723 | 1.29e-14 | 1.26e-12 | 165 |
| GO:001605312 | Liver | Cirrhotic | organic acid biosynthetic process | 139/4634 | 316/18723 | 4.28e-14 | 3.83e-12 | 139 |
| GO:004639412 | Liver | Cirrhotic | carboxylic acid biosynthetic process | 137/4634 | 314/18723 | 1.40e-13 | 1.14e-11 | 137 |
| GO:004428211 | Liver | Cirrhotic | small molecule catabolic process | 151/4634 | 376/18723 | 2.20e-11 | 1.34e-09 | 151 |
| GO:001605411 | Liver | Cirrhotic | organic acid catabolic process | 104/4634 | 240/18723 | 1.91e-10 | 9.53e-09 | 104 |
| GO:004639511 | Liver | Cirrhotic | carboxylic acid catabolic process | 102/4634 | 236/18723 | 3.41e-10 | 1.63e-08 | 102 |
| Page: 1 2 3 4 |
| Pathway ID | Tissue | Disease Stage | Description | Gene Ratio | Bg Ratio | pvalue | p.adjust | qvalue | Count |
| Page: 1 |
Top |
Cell-cell communication analysis |
| Identification of potential cell-cell interactions between two cell types and their ligand-receptor pairs for different disease states |
| Ligand | Receptor | LRpair | Pathway | Tissue | Disease Stage |
| Page: 1 |
Top |
Single-cell gene regulatory network inference analysis |
| Find out the significant the regulons (TFs) and the target genes of each regulon across cell types for different disease states |
| TF | Cell Type | Tissue | Disease Stage | Target Gene | RSS | Regulon Activity |
| ∗The dot plots of a searched regulon are shown for all cell subpopulations in each disease state of each tissue based on the regulon specific score inferred using pySCENIC and by calculating the average expression. |
| Page: 1 |
Top |
Somatic mutation of malignant transformation related genes |
| Annotation of somatic variants for genes involved in malignant transformation |
| Hugo Symbol | Variant Class | Variant Classification | dbSNP RS | HGVSc | HGVSp | HGVSp Short | SWISSPROT | BIOTYPE | SIFT | PolyPhen | Tumor Sample Barcode | Tissue | Histology | Sex | Age | Stage | Therapy Types | Drugs | Outcome |
| ILVBL | SNV | Missense_Mutation | c.1088N>A | p.Val363Asp | p.V363D | A1L0T0 | protein_coding | tolerated(0.11) | benign(0.117) | TCGA-B6-A0IJ-01 | Breast | breast invasive carcinoma | Female | <65 | I/II | Unknown | Unknown | SD | |
| ILVBL | SNV | Missense_Mutation | rs746198778 | c.1313N>T | p.Ala438Val | p.A438V | A1L0T0 | protein_coding | tolerated(0.24) | benign(0.014) | TCGA-BH-A0DL-01 | Breast | breast invasive carcinoma | Female | <65 | I/II | Chemotherapy | cytoxan | CR |
| ILVBL | SNV | Missense_Mutation | novel | c.1390C>G | p.Leu464Val | p.L464V | A1L0T0 | protein_coding | deleterious(0.01) | benign(0.261) | TCGA-OL-A5RZ-01 | Breast | breast invasive carcinoma | Female | <65 | I/II | Chemotherapy | doxorubicin | CR |
| ILVBL | SNV | Missense_Mutation | rs760827838 | c.1070N>A | p.Arg357His | p.R357H | A1L0T0 | protein_coding | deleterious(0) | probably_damaging(1) | TCGA-2W-A8YY-01 | Cervix | cervical & endocervical cancer | Female | <65 | I/II | Chemotherapy | cisplatin | CR |
| ILVBL | SNV | Missense_Mutation | rs753529569 | c.1036N>A | p.Val346Ile | p.V346I | A1L0T0 | protein_coding | deleterious(0.05) | possibly_damaging(0.542) | TCGA-2W-A8YY-01 | Cervix | cervical & endocervical cancer | Female | <65 | I/II | Chemotherapy | cisplatin | CR |
| ILVBL | SNV | Missense_Mutation | rs764284551 | c.1276N>A | p.Asp426Asn | p.D426N | A1L0T0 | protein_coding | deleterious(0) | probably_damaging(0.967) | TCGA-C5-A1BQ-01 | Cervix | cervical & endocervical cancer | Female | >=65 | III/IV | Chemotherapy | cisplatin | CR |
| ILVBL | SNV | Missense_Mutation | rs762630633 | c.1771C>T | p.Arg591Trp | p.R591W | A1L0T0 | protein_coding | deleterious(0) | probably_damaging(0.96) | TCGA-EA-A410-01 | Cervix | cervical & endocervical cancer | Female | <65 | I/II | Unknown | Unknown | SD |
| ILVBL | SNV | Missense_Mutation | rs767342989 | c.1696G>A | p.Val566Met | p.V566M | A1L0T0 | protein_coding | deleterious(0) | probably_damaging(0.994) | TCGA-AA-3663-01 | Colorectum | colon adenocarcinoma | Male | <65 | I/II | Unknown | Unknown | SD |
| ILVBL | SNV | Missense_Mutation | rs757591847 | c.271C>T | p.Arg91Cys | p.R91C | A1L0T0 | protein_coding | deleterious(0.02) | benign(0.315) | TCGA-AA-3864-01 | Colorectum | colon adenocarcinoma | Male | >=65 | I/II | Unknown | Unknown | SD |
| ILVBL | SNV | Missense_Mutation | c.1317N>A | p.Met439Ile | p.M439I | A1L0T0 | protein_coding | tolerated(0.43) | benign(0) | TCGA-AA-3966-01 | Colorectum | colon adenocarcinoma | Female | >=65 | I/II | Unknown | Unknown | SD |
| Page: 1 2 3 4 5 6 7 8 |
Top |
Related drugs of malignant transformation related genes |
| Identification of chemicals and drugs interact with genes involved in malignant transfromation |
| (DGIdb 4.0) |
| Entrez ID | Symbol | Category | Interaction Types | Drug Claim Name | Drug Name | PMIDs |
| Page: 1 |

Copyright 2023-Present -The University of Texas Health Science Center at Houston |