
|
|||||
|
 | |
| |
| |
| |
| |
| |
|
Gene: ILF3 |
Gene summary for ILF3 |
| Gene information | Species | Human | Gene symbol | ILF3 | Gene ID | 3609 |
| Gene name | interleukin enhancer binding factor 3 | |
| Gene Alias | CBTF | |
| Cytomap | 19p13.2 | |
| Gene Type | protein-coding | GO ID | GO:0002376 | UniProtAcc | Q12906 |
Top |
Malignant transformation analysis |
| Identification of the aberrant gene expression in precancerous and cancerous lesions by comparing the gene expression of stem-like cells in diseased tissues with normal stem cells |
| Entrez ID | Symbol | Replicates | Species | Organ | Tissue | Adj P-value | Log2FC | Malignancy |
| 3609 | ILF3 | HTA11_3410_2000001011 | Human | Colorectum | AD | 2.74e-02 | -1.97e-01 | 0.0155 |
| 3609 | ILF3 | HTA11_6818_2000001021 | Human | Colorectum | AD | 1.61e-02 | 3.28e-02 | 0.0588 |
| 3609 | ILF3 | HTA11_99999970781_79442 | Human | Colorectum | MSS | 1.90e-13 | 5.94e-01 | 0.294 |
| 3609 | ILF3 | HTA11_99999971662_82457 | Human | Colorectum | MSS | 7.62e-03 | 4.21e-01 | 0.3859 |
| 3609 | ILF3 | A015-C-203 | Human | Colorectum | FAP | 1.82e-18 | 1.21e-01 | -0.1294 |
| 3609 | ILF3 | A002-C-201 | Human | Colorectum | FAP | 2.11e-03 | 1.03e-01 | 0.0324 |
| 3609 | ILF3 | A001-C-119 | Human | Colorectum | FAP | 9.24e-03 | 2.94e-01 | -0.1557 |
| 3609 | ILF3 | A001-C-108 | Human | Colorectum | FAP | 4.83e-12 | 2.91e-01 | -0.0272 |
| 3609 | ILF3 | A002-C-021 | Human | Colorectum | FAP | 1.86e-04 | 3.44e-01 | 0.1171 |
| 3609 | ILF3 | A002-C-205 | Human | Colorectum | FAP | 1.52e-11 | 2.50e-01 | -0.1236 |
| 3609 | ILF3 | A014-C-108 | Human | Colorectum | FAP | 5.89e-06 | 5.07e-01 | -0.124 |
| 3609 | ILF3 | A001-C-104 | Human | Colorectum | FAP | 3.90e-10 | 4.77e-01 | 0.0184 |
| 3609 | ILF3 | A015-C-006 | Human | Colorectum | FAP | 1.95e-13 | 4.93e-01 | -0.0994 |
| 3609 | ILF3 | A015-C-106 | Human | Colorectum | FAP | 6.29e-13 | 3.69e-01 | -0.0511 |
| 3609 | ILF3 | A002-C-114 | Human | Colorectum | FAP | 1.02e-10 | 2.74e-01 | -0.1561 |
| 3609 | ILF3 | A015-C-104 | Human | Colorectum | FAP | 3.95e-27 | 3.81e-01 | -0.1899 |
| 3609 | ILF3 | A015-C-202 | Human | Colorectum | FAP | 8.34e-05 | 3.80e-01 | -0.0849 |
| 3609 | ILF3 | A001-C-014 | Human | Colorectum | FAP | 3.71e-06 | 1.40e-02 | 0.0135 |
| 3609 | ILF3 | A002-C-016 | Human | Colorectum | FAP | 1.30e-08 | -1.67e-01 | 0.0521 |
| 3609 | ILF3 | A015-C-002 | Human | Colorectum | FAP | 2.57e-04 | 1.97e-01 | -0.0763 |
| Page: 1 2 3 4 5 6 7 8 9 10 |
| Tissue | Expression Dynamics | Abbreviation |
| Colorectum (GSE201348) | 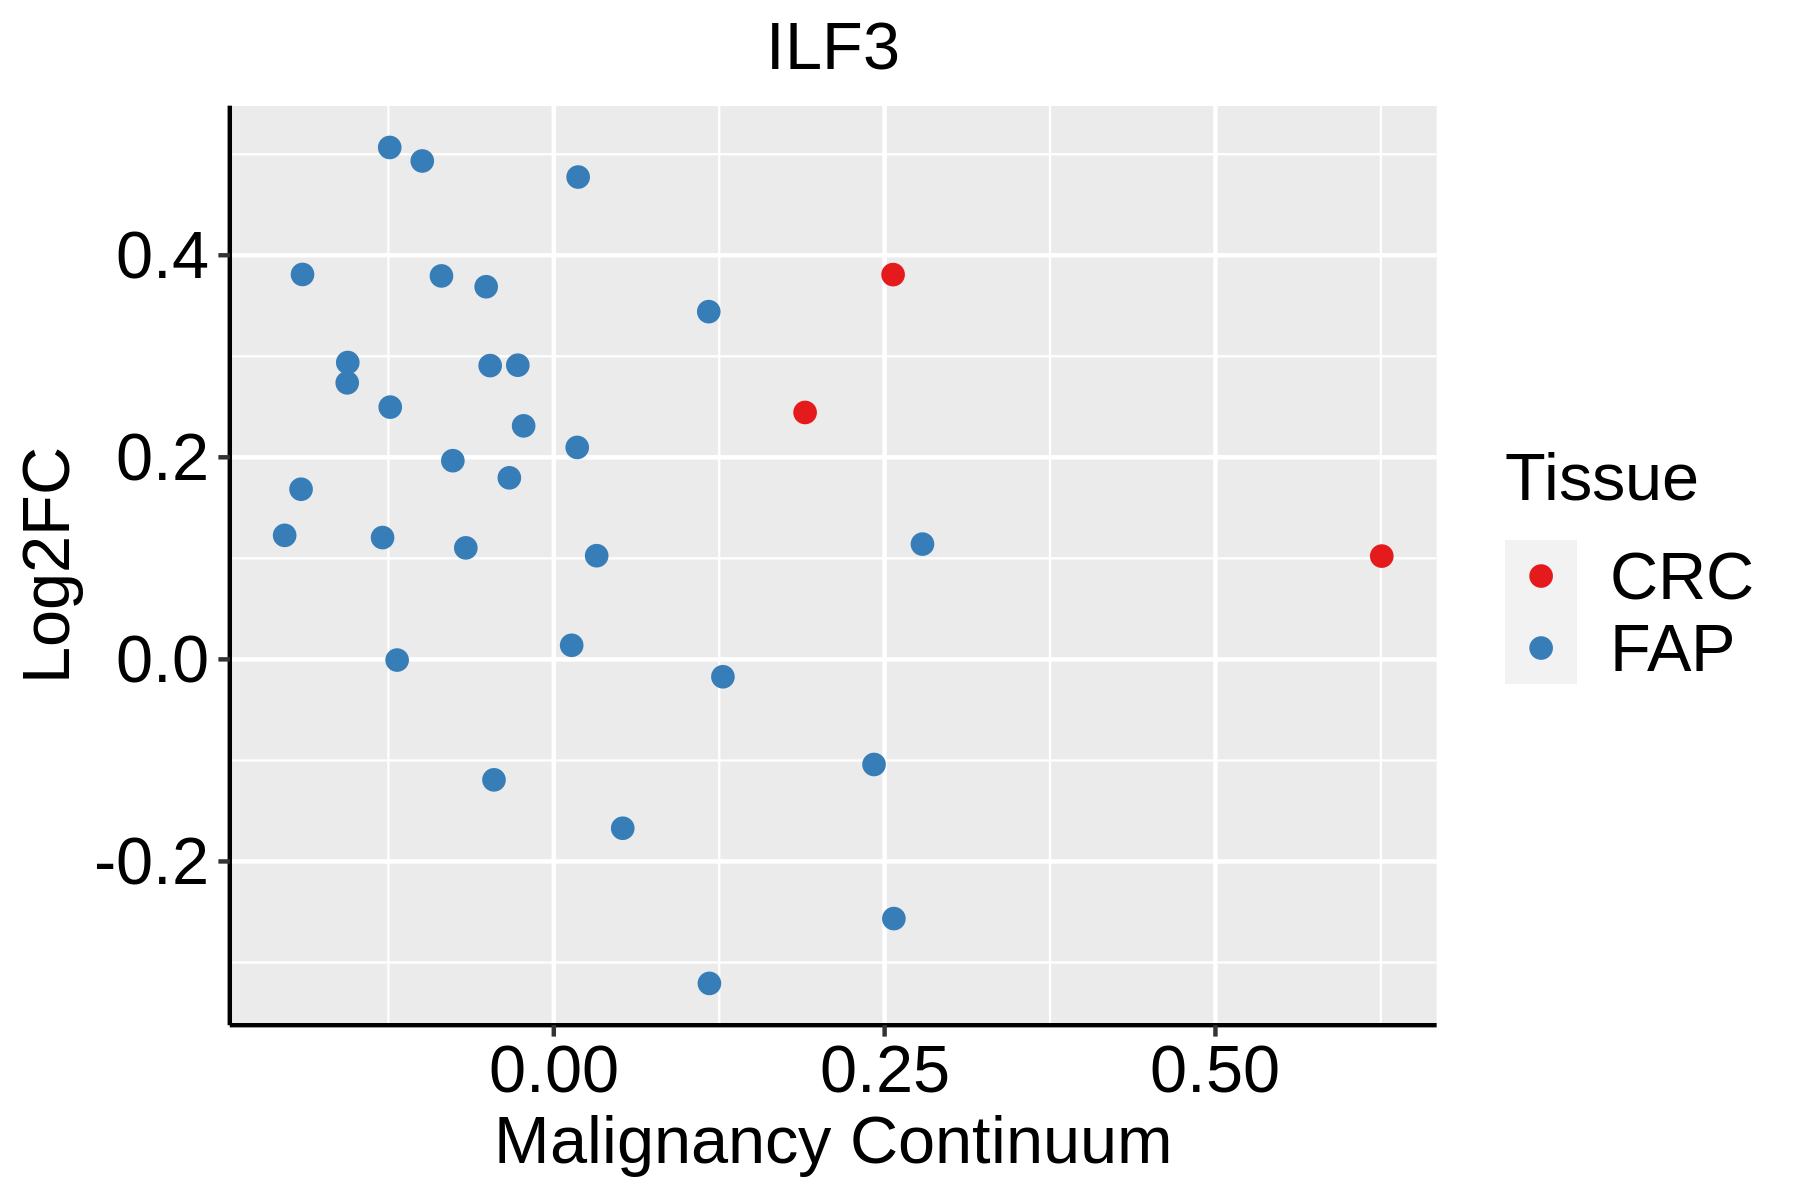 | FAP: Familial adenomatous polyposis |
| CRC: Colorectal cancer | ||
| Colorectum (HTA11) |  | AD: Adenomas |
| SER: Sessile serrated lesions | ||
| MSI-H: Microsatellite-high colorectal cancer | ||
| MSS: Microsatellite stable colorectal cancer | ||
| Esophagus | 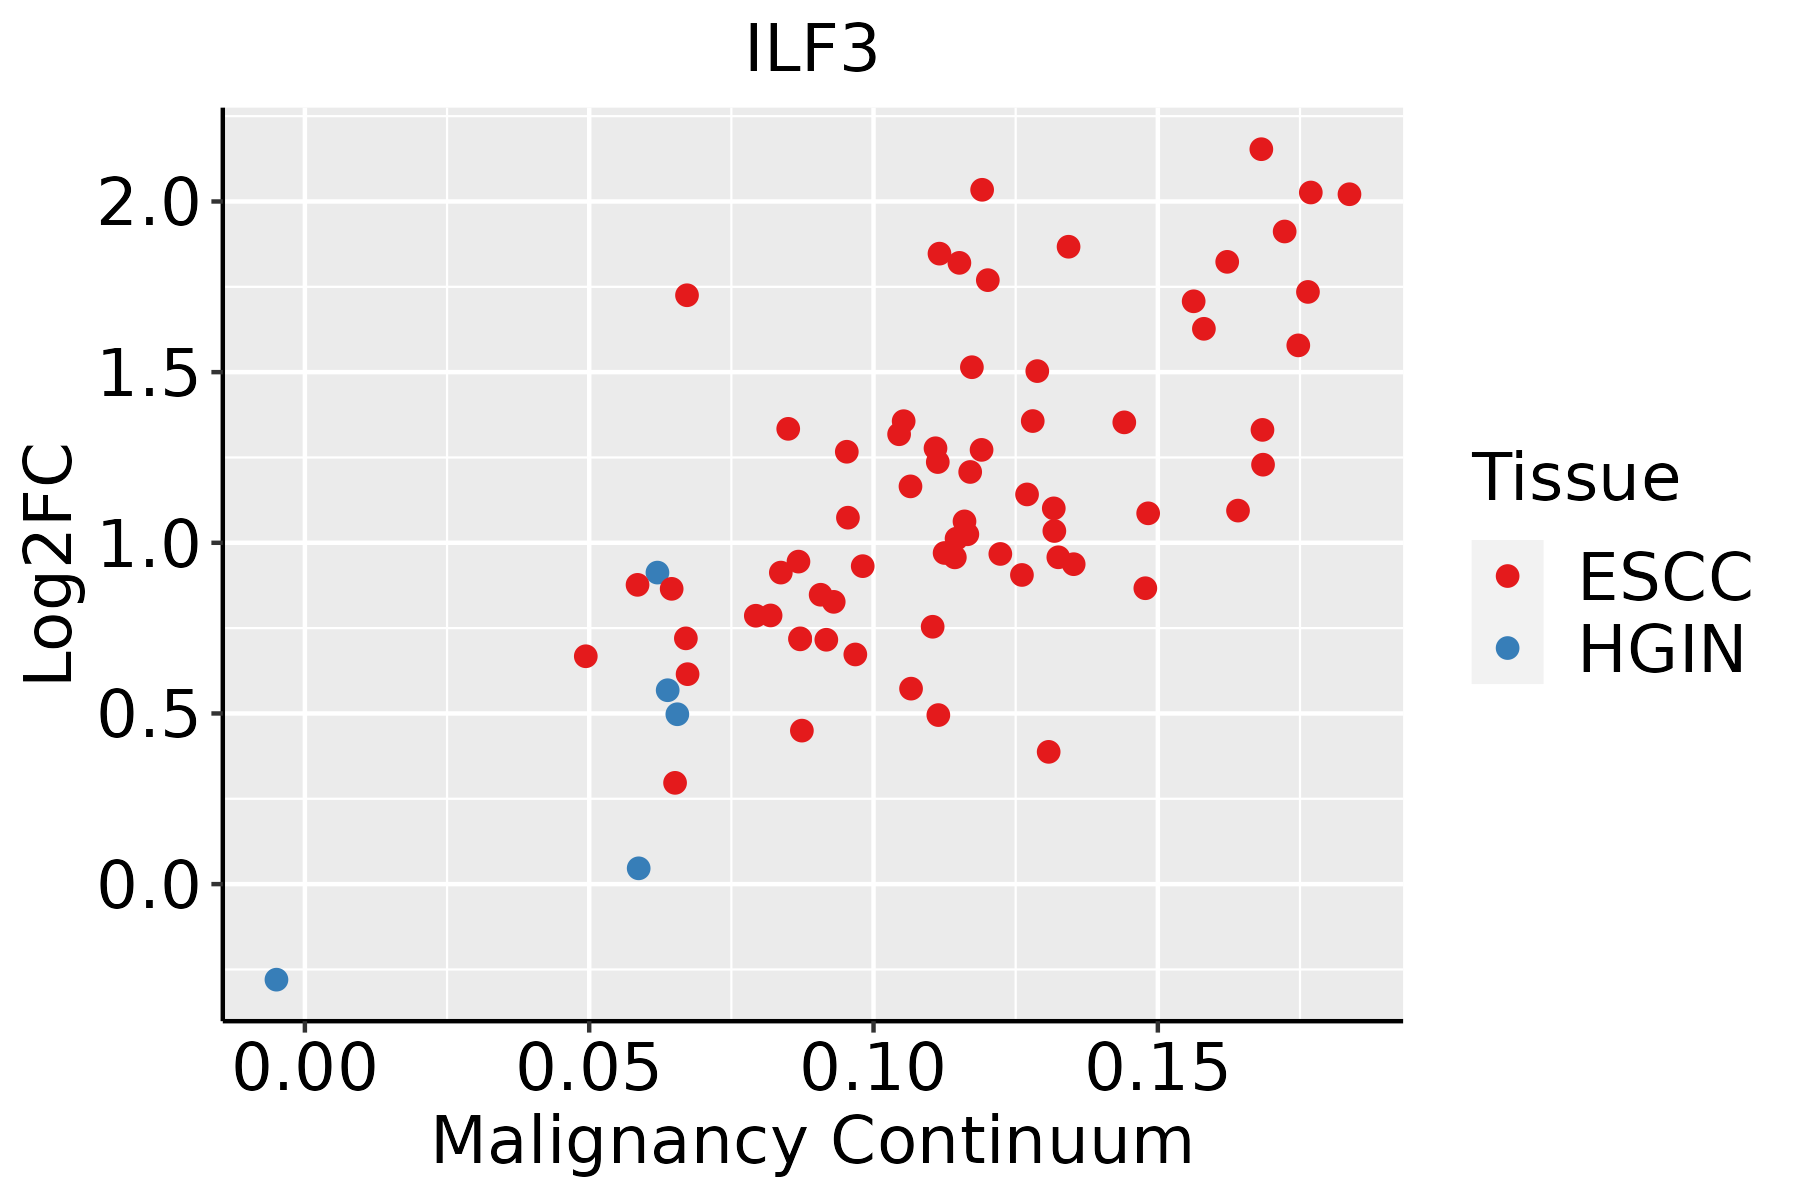 | ESCC: Esophageal squamous cell carcinoma |
| HGIN: High-grade intraepithelial neoplasias | ||
| LGIN: Low-grade intraepithelial neoplasias | ||
| Liver | 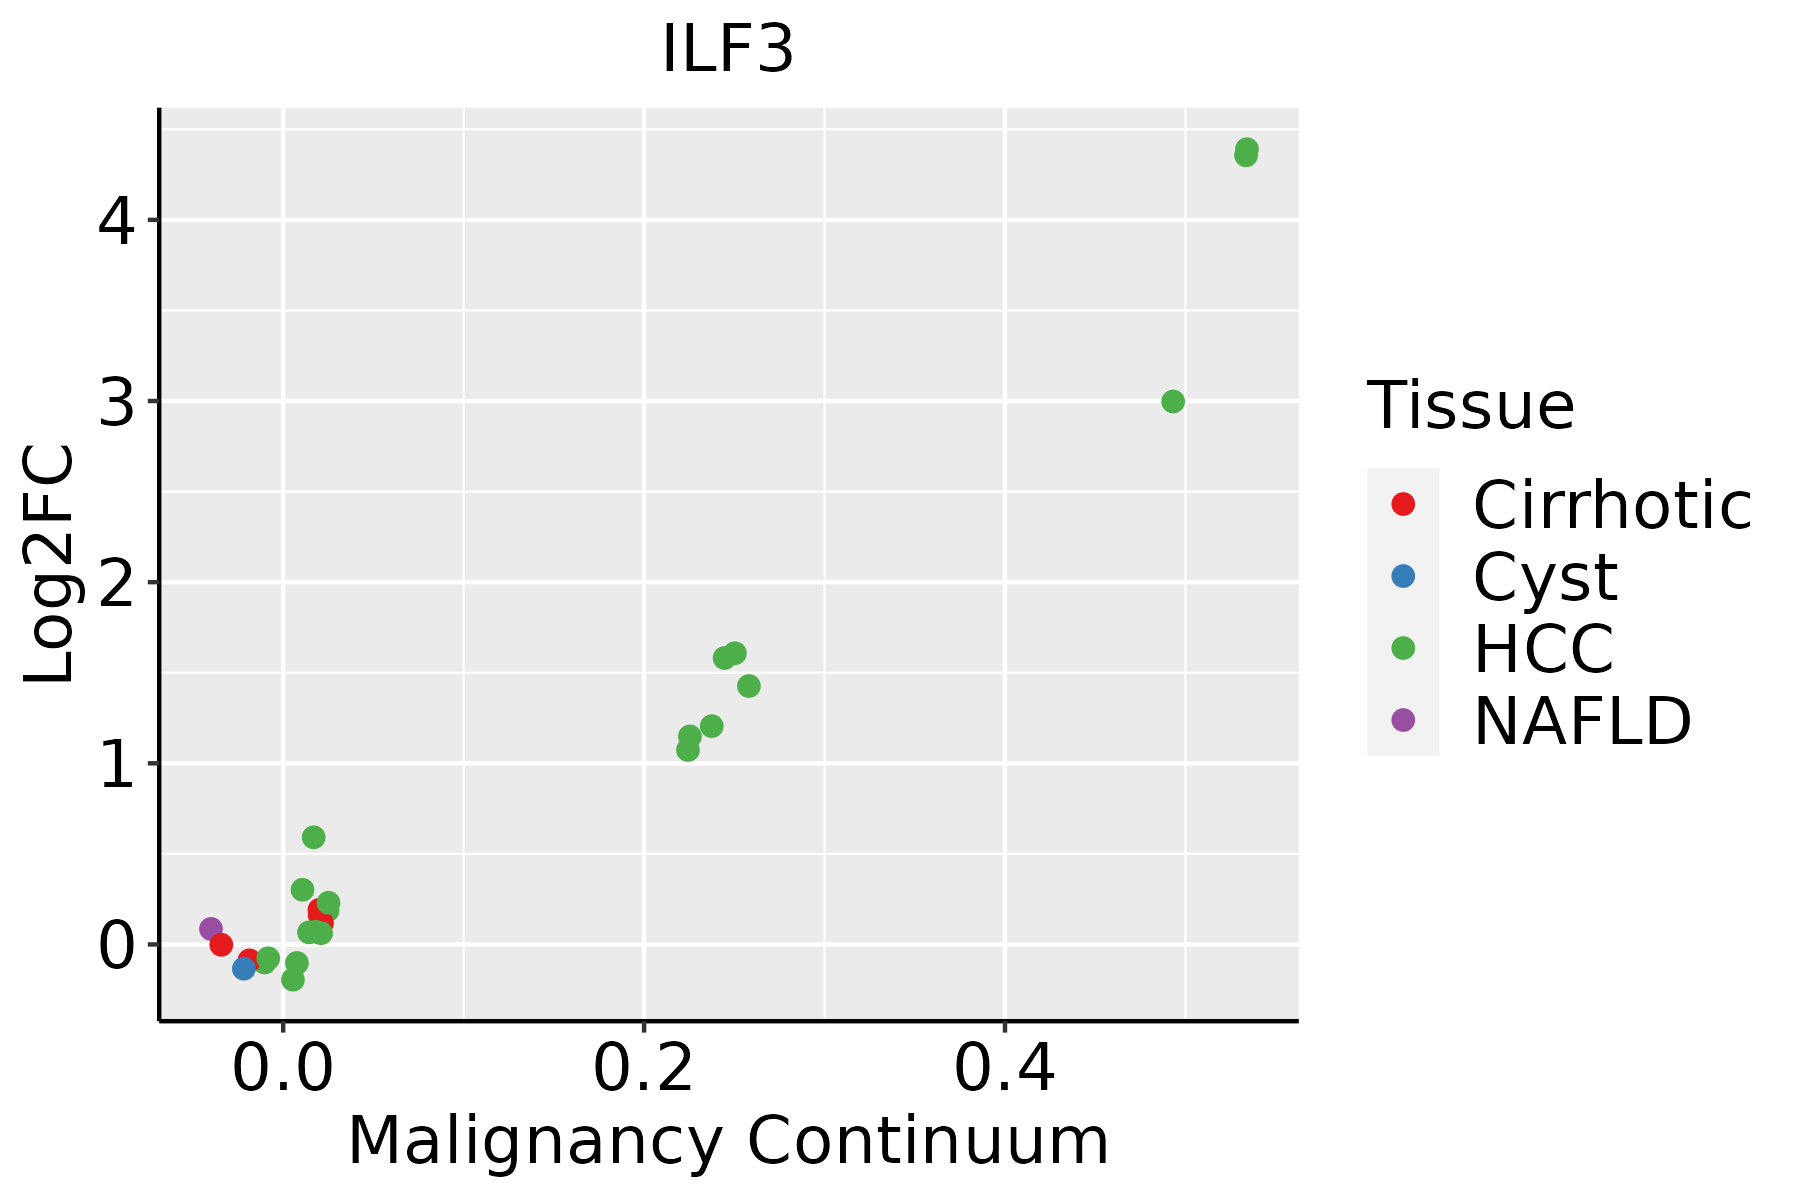 | HCC: Hepatocellular carcinoma |
| NAFLD: Non-alcoholic fatty liver disease | ||
| Oral Cavity |  | EOLP: Erosive Oral lichen planus |
| LP: leukoplakia | ||
| NEOLP: Non-erosive oral lichen planus | ||
| OSCC: Oral squamous cell carcinoma | ||
| Prostate |  | BPH: Benign Prostatic Hyperplasia |
| Skin | 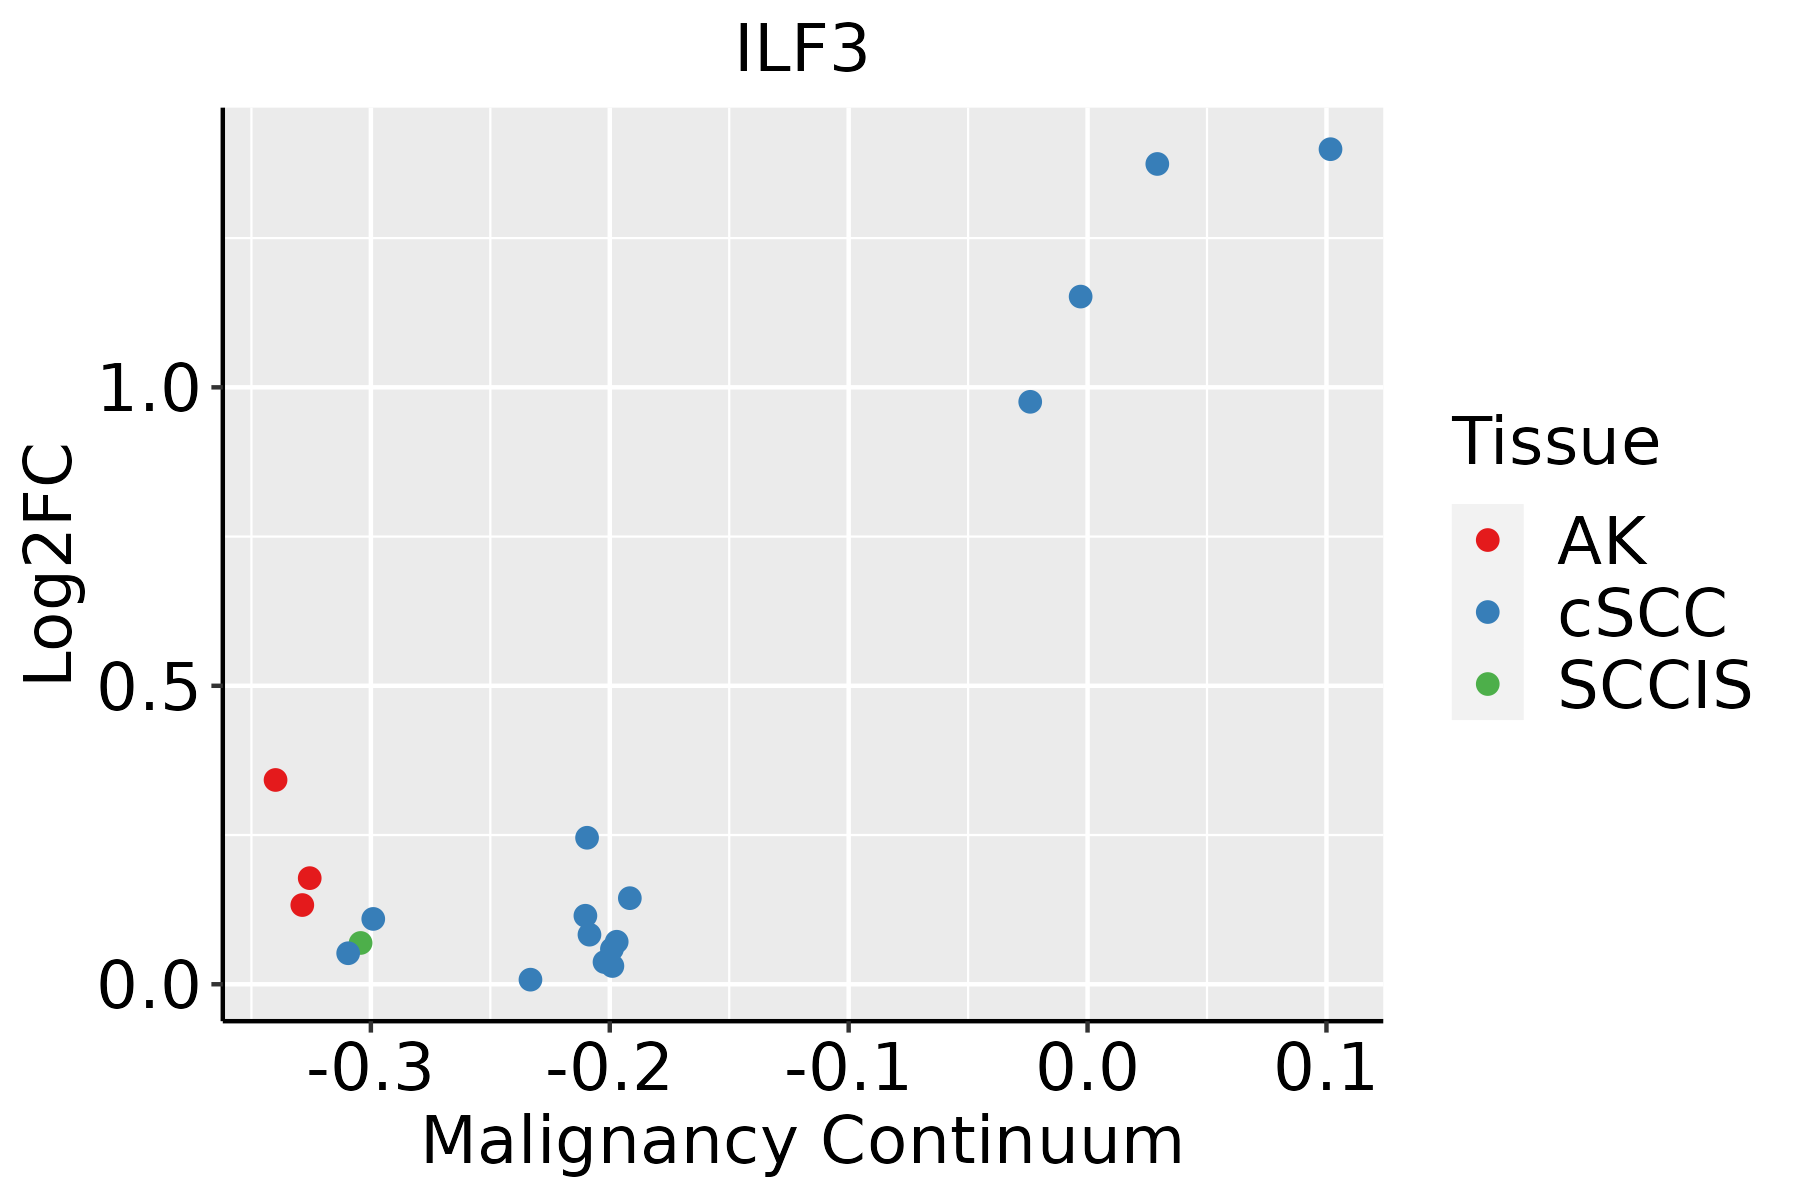 | AK: Actinic keratosis |
| cSCC: Cutaneous squamous cell carcinoma | ||
| SCCIS:squamous cell carcinoma in situ | ||
| Thyroid |  | ATC: Anaplastic thyroid cancer |
| HT: Hashimoto's thyroiditis | ||
| PTC: Papillary thyroid cancer |
| ∗log2FC in expression of this searched gene in stem-like cells from each diseased tissue sample relative to stem-like cells in normal samples in each tissue plotted against the malignancy continuum. Samples are colored based on if they are from different disease stage. |
Top |
Malignant transformation related pathway analysis |
| Find out the enriched GO biological processes and KEGG pathways involved in transition from healthy to precancer to cancer |
| Tissue | Disease Stage | Enriched GO biological Processes |
| Colorectum | AD |  |
| Colorectum | SER |  |
| Colorectum | MSS |  |
| Colorectum | MSI-H |  |
| Colorectum | FAP |  |
| ∗Top 15 enriched GO BP terms are showed in the bar plot of each disease state in each tissue. Each row represents a significant GO biological process which is colored according to the -log10(p.adjust). |
| Page: 1 2 3 4 5 6 7 8 9 |
| GO ID | Tissue | Disease Stage | Description | Gene Ratio | Bg Ratio | pvalue | p.adjust | Count |
| GO:0016032 | Colorectum | AD | viral process | 168/3918 | 415/18723 | 4.67e-20 | 3.66e-17 | 168 |
| GO:0019058 | Colorectum | AD | viral life cycle | 119/3918 | 317/18723 | 6.18e-12 | 8.23e-10 | 119 |
| GO:0006417 | Colorectum | AD | regulation of translation | 141/3918 | 468/18723 | 1.32e-06 | 4.22e-05 | 141 |
| GO:0019079 | Colorectum | AD | viral genome replication | 51/3918 | 131/18723 | 1.83e-06 | 5.51e-05 | 51 |
| GO:0050792 | Colorectum | AD | regulation of viral process | 59/3918 | 164/18723 | 5.95e-06 | 1.52e-04 | 59 |
| GO:1903900 | Colorectum | AD | regulation of viral life cycle | 51/3918 | 148/18723 | 9.01e-05 | 1.38e-03 | 51 |
| GO:0045069 | Colorectum | AD | regulation of viral genome replication | 32/3918 | 85/18723 | 2.97e-04 | 3.60e-03 | 32 |
| GO:00160322 | Colorectum | MSS | viral process | 157/3467 | 415/18723 | 7.94e-21 | 6.19e-18 | 157 |
| GO:00190582 | Colorectum | MSS | viral life cycle | 111/3467 | 317/18723 | 1.65e-12 | 2.95e-10 | 111 |
| GO:00064172 | Colorectum | MSS | regulation of translation | 134/3467 | 468/18723 | 4.43e-08 | 2.38e-06 | 134 |
| GO:00190792 | Colorectum | MSS | viral genome replication | 49/3467 | 131/18723 | 2.73e-07 | 1.11e-05 | 49 |
| GO:00507922 | Colorectum | MSS | regulation of viral process | 54/3467 | 164/18723 | 6.79e-06 | 1.77e-04 | 54 |
| GO:19039002 | Colorectum | MSS | regulation of viral life cycle | 47/3467 | 148/18723 | 7.20e-05 | 1.21e-03 | 47 |
| GO:00450691 | Colorectum | MSS | regulation of viral genome replication | 30/3467 | 85/18723 | 1.81e-04 | 2.57e-03 | 30 |
| GO:0017148 | Colorectum | MSS | negative regulation of translation | 64/3467 | 245/18723 | 1.94e-03 | 1.67e-02 | 64 |
| GO:0034249 | Colorectum | MSS | negative regulation of cellular amide metabolic process | 70/3467 | 273/18723 | 2.07e-03 | 1.76e-02 | 70 |
| GO:00160324 | Colorectum | FAP | viral process | 114/2622 | 415/18723 | 3.00e-13 | 2.63e-10 | 114 |
| GO:00064174 | Colorectum | FAP | regulation of translation | 111/2622 | 468/18723 | 8.47e-09 | 1.13e-06 | 111 |
| GO:00190584 | Colorectum | FAP | viral life cycle | 81/2622 | 317/18723 | 2.97e-08 | 2.64e-06 | 81 |
| GO:00190794 | Colorectum | FAP | viral genome replication | 38/2622 | 131/18723 | 6.04e-06 | 1.91e-04 | 38 |
| Page: 1 2 3 4 5 6 7 8 9 10 11 |
| Pathway ID | Tissue | Disease Stage | Description | Gene Ratio | Bg Ratio | pvalue | p.adjust | qvalue | Count |
| Page: 1 |
Top |
Cell-cell communication analysis |
| Identification of potential cell-cell interactions between two cell types and their ligand-receptor pairs for different disease states |
| Ligand | Receptor | LRpair | Pathway | Tissue | Disease Stage |
| Page: 1 |
Top |
Single-cell gene regulatory network inference analysis |
| Find out the significant the regulons (TFs) and the target genes of each regulon across cell types for different disease states |
| TF | Cell Type | Tissue | Disease Stage | Target Gene | RSS | Regulon Activity |
| ∗The dot plots of a searched regulon are shown for all cell subpopulations in each disease state of each tissue based on the regulon specific score inferred using pySCENIC and by calculating the average expression. |
| Page: 1 |
Top |
Somatic mutation of malignant transformation related genes |
| Annotation of somatic variants for genes involved in malignant transformation |
| Hugo Symbol | Variant Class | Variant Classification | dbSNP RS | HGVSc | HGVSp | HGVSp Short | SWISSPROT | BIOTYPE | SIFT | PolyPhen | Tumor Sample Barcode | Tissue | Histology | Sex | Age | Stage | Therapy Types | Drugs | Outcome |
| ILF3 | SNV | Missense_Mutation | c.188N>G | p.Asp63Gly | p.D63G | Q12906 | protein_coding | tolerated(0.08) | benign(0.114) | TCGA-A2-A259-01 | Breast | breast invasive carcinoma | Female | >=65 | I/II | Hormone Therapy | arimidex | SD | |
| ILF3 | SNV | Missense_Mutation | c.1164N>C | p.Lys388Asn | p.K388N | Q12906 | protein_coding | deleterious(0.01) | probably_damaging(0.997) | TCGA-D8-A1JA-01 | Breast | breast invasive carcinoma | Female | <65 | III/IV | Chemotherapy | adriamycin | PD | |
| ILF3 | SNV | Missense_Mutation | c.2638N>C | p.Ser880Pro | p.S880P | Q12906 | protein_coding | tolerated_low_confidence(0.26) | benign(0.192) | TCGA-D8-A1XK-01 | Breast | breast invasive carcinoma | Female | <65 | I/II | Chemotherapy | doxorubicine+cyclophosphamide | SD | |
| ILF3 | SNV | Missense_Mutation | c.109N>G | p.His37Asp | p.H37D | Q12906 | protein_coding | tolerated(0.13) | probably_damaging(0.99) | TCGA-E2-A14Z-01 | Breast | breast invasive carcinoma | Female | <65 | I/II | Hormone Therapy | arimidex | PD | |
| ILF3 | SNV | Missense_Mutation | c.2243N>G | p.Ser748Cys | p.S748C | Q12906 | protein_coding | deleterious(0.01) | possibly_damaging(0.634) | TCGA-EW-A1J6-01 | Breast | breast invasive carcinoma | Female | >=65 | I/II | Hormone Therapy | femara | SD | |
| ILF3 | insertion | Frame_Shift_Ins | novel | c.2555_2556insGATGCCTTTGACAGTGATGAAAACGATTT | p.Lys853MetfsTer51 | p.K853Mfs*51 | Q12906 | protein_coding | TCGA-AN-A0FT-01 | Breast | breast invasive carcinoma | Female | <65 | I/II | Unknown | Unknown | SD | ||
| ILF3 | insertion | Frame_Shift_Ins | novel | c.713_714insCTCAACAAATTCGACCCCAAAAGAGGCTGAGACTGAGT | p.Arg239SerfsTer59 | p.R239Sfs*59 | Q12906 | protein_coding | TCGA-B6-A0RE-01 | Breast | breast invasive carcinoma | Female | <65 | I/II | Unknown | Unknown | SD | ||
| ILF3 | SNV | Missense_Mutation | novel | c.1421N>T | p.Arg474Met | p.R474M | Q12906 | protein_coding | deleterious(0) | possibly_damaging(0.742) | TCGA-IR-A3LF-01 | Cervix | cervical & endocervical cancer | Female | <65 | I/II | Unknown | Unknown | SD |
| ILF3 | SNV | Missense_Mutation | novel | c.634N>A | p.His212Asn | p.H212N | Q12906 | protein_coding | deleterious(0) | probably_damaging(0.986) | TCGA-VS-A94Z-01 | Cervix | cervical & endocervical cancer | Female | <65 | I/II | Chemotherapy | cisplatin | CR |
| ILF3 | SNV | Missense_Mutation | c.1103N>T | p.Thr368Met | p.T368M | Q12906 | protein_coding | tolerated(0.11) | possibly_damaging(0.78) | TCGA-AA-3492-01 | Colorectum | colon adenocarcinoma | Female | >=65 | I/II | Unknown | Unknown | SD |
| Page: 1 2 3 4 5 6 7 8 |
Top |
Related drugs of malignant transformation related genes |
| Identification of chemicals and drugs interact with genes involved in malignant transfromation |
| (DGIdb 4.0) |
| Entrez ID | Symbol | Category | Interaction Types | Drug Claim Name | Drug Name | PMIDs |
| 3609 | ILF3 | KINASE, TRANSCRIPTION FACTOR | CSA | CYCLOSPORINE | 9843854 | |
| 3609 | ILF3 | KINASE, TRANSCRIPTION FACTOR | IL-2 | ALDESLEUKIN | 12504009 |
| Page: 1 |

Copyright 2023-Present -The University of Texas Health Science Center at Houston |