
|
|||||
|
 | |
| |
| |
| |
| |
| |
|
Gene: ILF2 |
Gene summary for ILF2 |
| Gene information | Species | Human | Gene symbol | ILF2 | Gene ID | 3608 |
| Gene name | interleukin enhancer binding factor 2 | |
| Gene Alias | NF45 | |
| Cytomap | 1q21.3 | |
| Gene Type | protein-coding | GO ID | GO:0006139 | UniProtAcc | B4DY09 |
Top |
Malignant transformation analysis |
| Identification of the aberrant gene expression in precancerous and cancerous lesions by comparing the gene expression of stem-like cells in diseased tissues with normal stem cells |
| Entrez ID | Symbol | Replicates | Species | Organ | Tissue | Adj P-value | Log2FC | Malignancy |
| 3608 | ILF2 | GSM4909285 | Human | Breast | IDC | 3.38e-16 | 5.76e-01 | 0.21 |
| 3608 | ILF2 | GSM4909286 | Human | Breast | IDC | 8.80e-05 | -1.95e-01 | 0.1081 |
| 3608 | ILF2 | GSM4909287 | Human | Breast | IDC | 7.24e-08 | 3.85e-01 | 0.2057 |
| 3608 | ILF2 | GSM4909294 | Human | Breast | IDC | 1.55e-04 | -5.81e-02 | 0.2022 |
| 3608 | ILF2 | GSM4909296 | Human | Breast | IDC | 5.13e-20 | -4.10e-01 | 0.1524 |
| 3608 | ILF2 | GSM4909297 | Human | Breast | IDC | 2.32e-18 | -3.24e-01 | 0.1517 |
| 3608 | ILF2 | GSM4909298 | Human | Breast | IDC | 3.36e-04 | -2.20e-01 | 0.1551 |
| 3608 | ILF2 | GSM4909301 | Human | Breast | IDC | 1.41e-35 | -5.45e-01 | 0.1577 |
| 3608 | ILF2 | GSM4909302 | Human | Breast | IDC | 1.57e-05 | -3.82e-01 | 0.1545 |
| 3608 | ILF2 | GSM4909311 | Human | Breast | IDC | 7.31e-42 | -4.08e-01 | 0.1534 |
| 3608 | ILF2 | GSM4909312 | Human | Breast | IDC | 9.90e-13 | -1.41e-01 | 0.1552 |
| 3608 | ILF2 | GSM4909318 | Human | Breast | IDC | 1.92e-02 | 2.43e-01 | 0.2031 |
| 3608 | ILF2 | GSM4909319 | Human | Breast | IDC | 8.85e-41 | -4.73e-01 | 0.1563 |
| 3608 | ILF2 | GSM4909320 | Human | Breast | IDC | 1.54e-05 | -5.13e-01 | 0.1575 |
| 3608 | ILF2 | GSM4909321 | Human | Breast | IDC | 1.80e-15 | -1.31e-01 | 0.1559 |
| 3608 | ILF2 | brca1 | Human | Breast | Precancer | 2.10e-16 | 4.83e-01 | -0.0338 |
| 3608 | ILF2 | brca2 | Human | Breast | Precancer | 7.26e-04 | 3.47e-01 | -0.024 |
| 3608 | ILF2 | brca3 | Human | Breast | Precancer | 1.09e-03 | 3.10e-01 | -0.0263 |
| 3608 | ILF2 | M2 | Human | Breast | IDC | 6.78e-06 | 3.62e-01 | 0.21 |
| 3608 | ILF2 | NCCBC14 | Human | Breast | DCIS | 4.73e-11 | 1.24e-01 | 0.2021 |
| Page: 1 2 3 4 5 6 7 8 9 10 11 |
| Tissue | Expression Dynamics | Abbreviation |
| Breast | 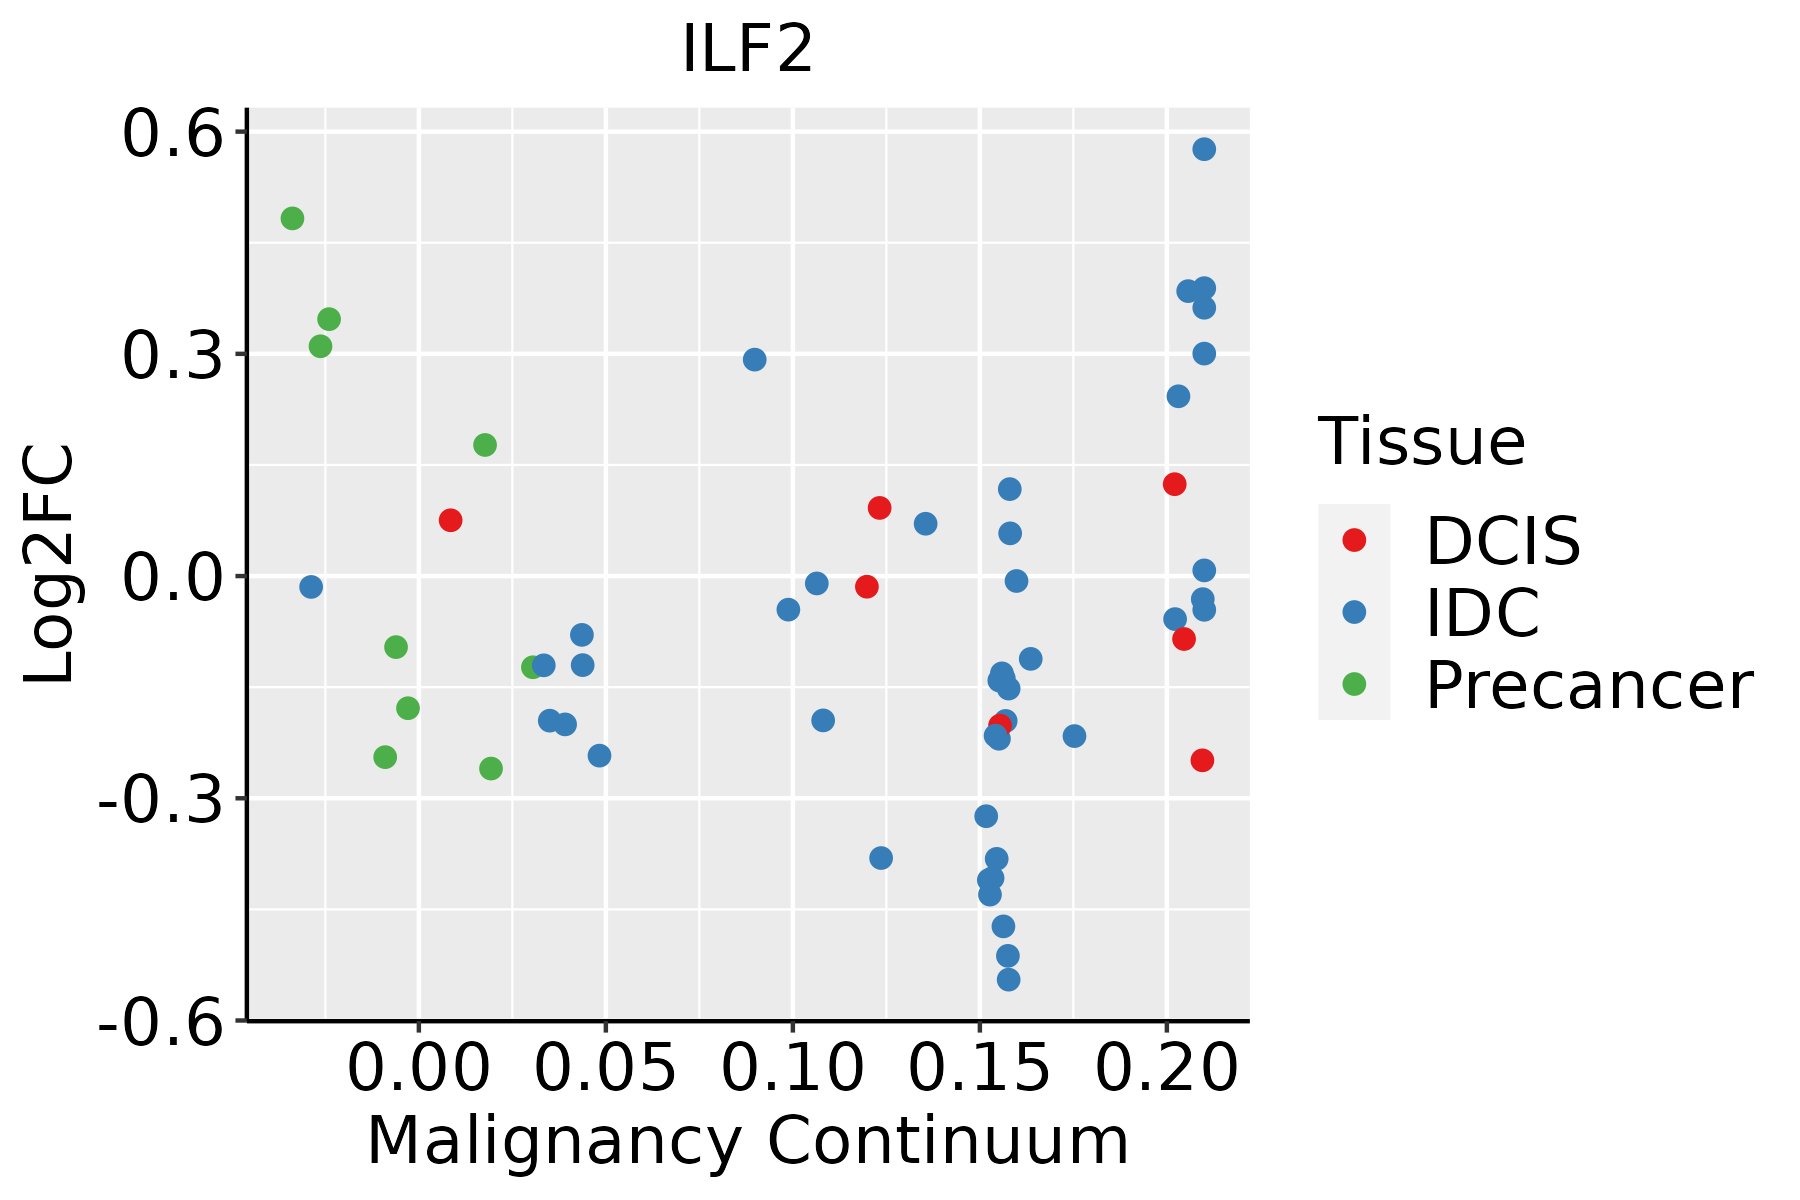 | IDC: Invasive ductal carcinoma |
| DCIS: Ductal carcinoma in situ | ||
| Precancer(BRCA1-mut): Precancerous lesion from BRCA1 mutation carriers | ||
| Colorectum (GSE201348) |  | FAP: Familial adenomatous polyposis |
| CRC: Colorectal cancer | ||
| Colorectum (HTA11) |  | AD: Adenomas |
| SER: Sessile serrated lesions | ||
| MSI-H: Microsatellite-high colorectal cancer | ||
| MSS: Microsatellite stable colorectal cancer | ||
| Endometrium | 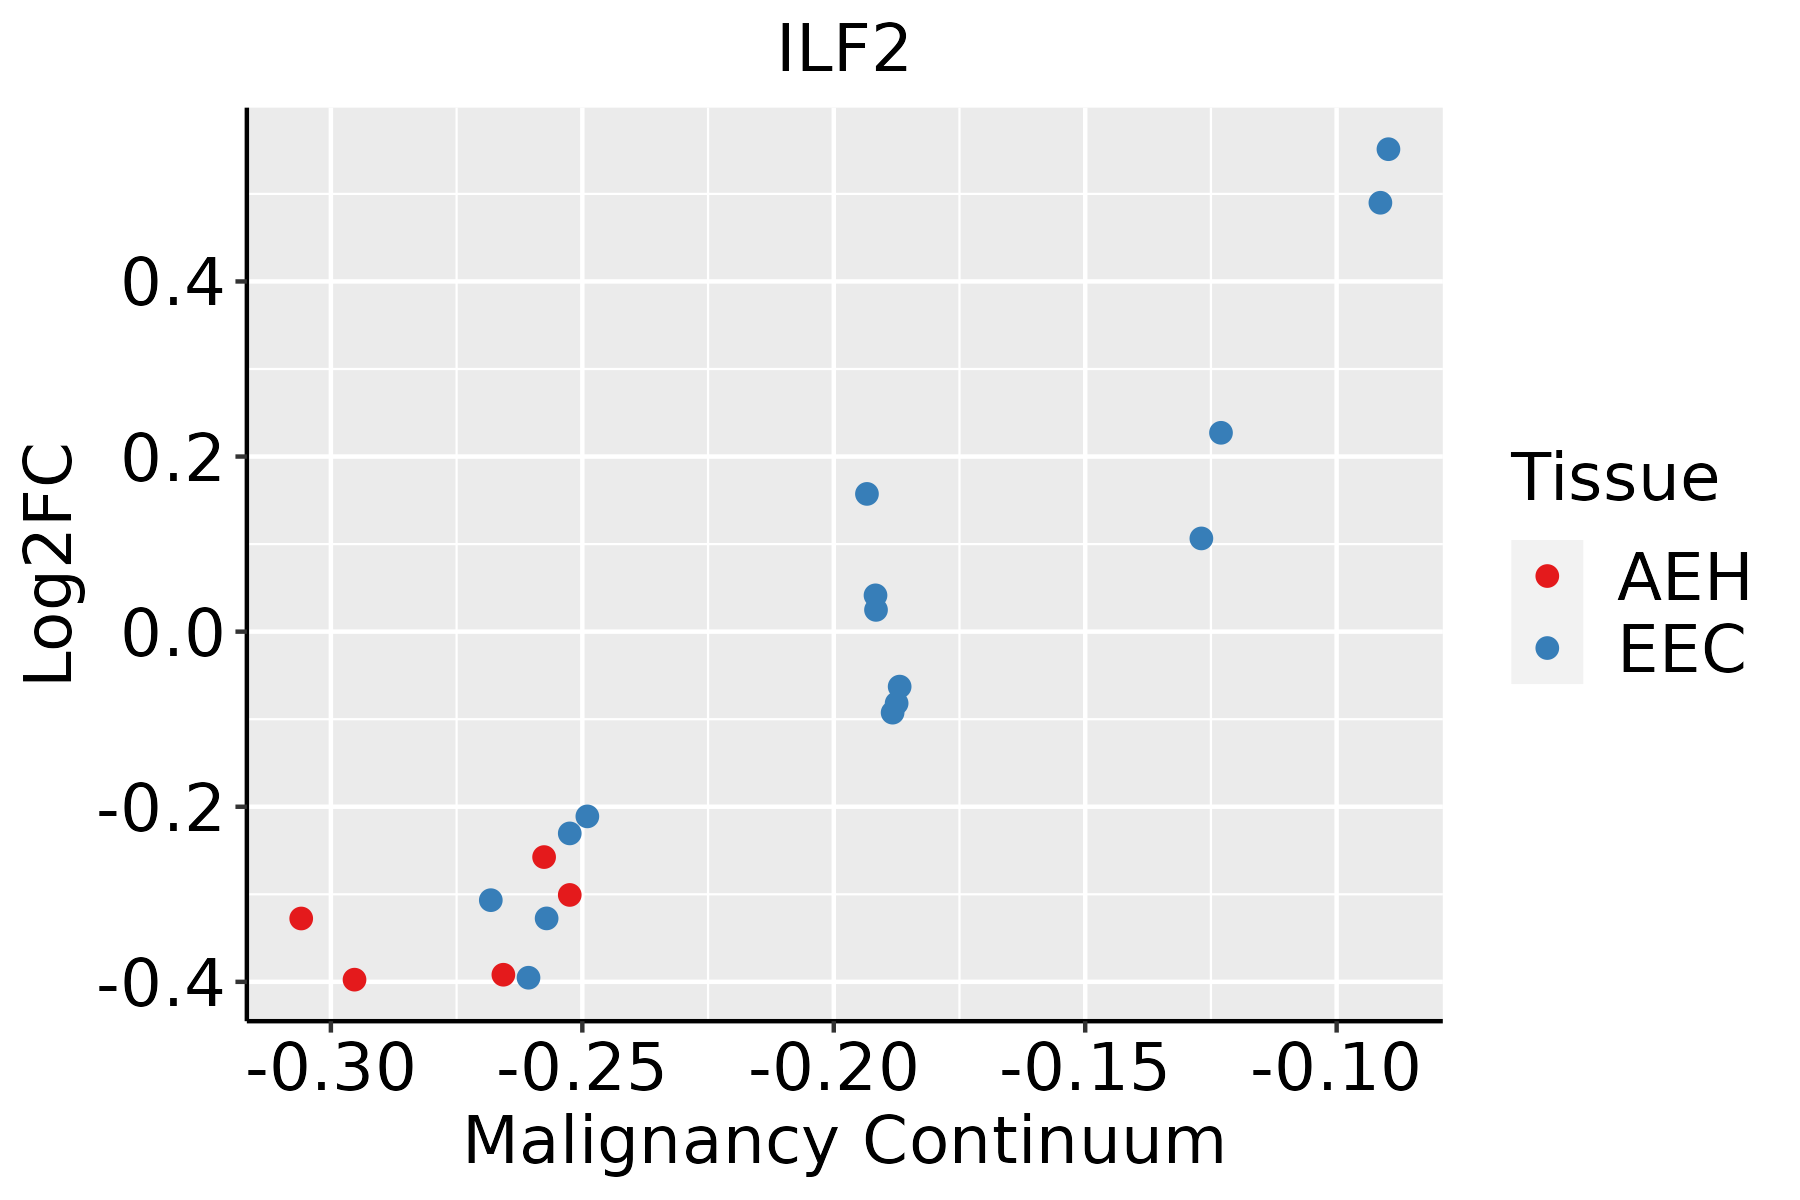 | AEH: Atypical endometrial hyperplasia |
| EEC: Endometrioid Cancer | ||
| Esophagus | 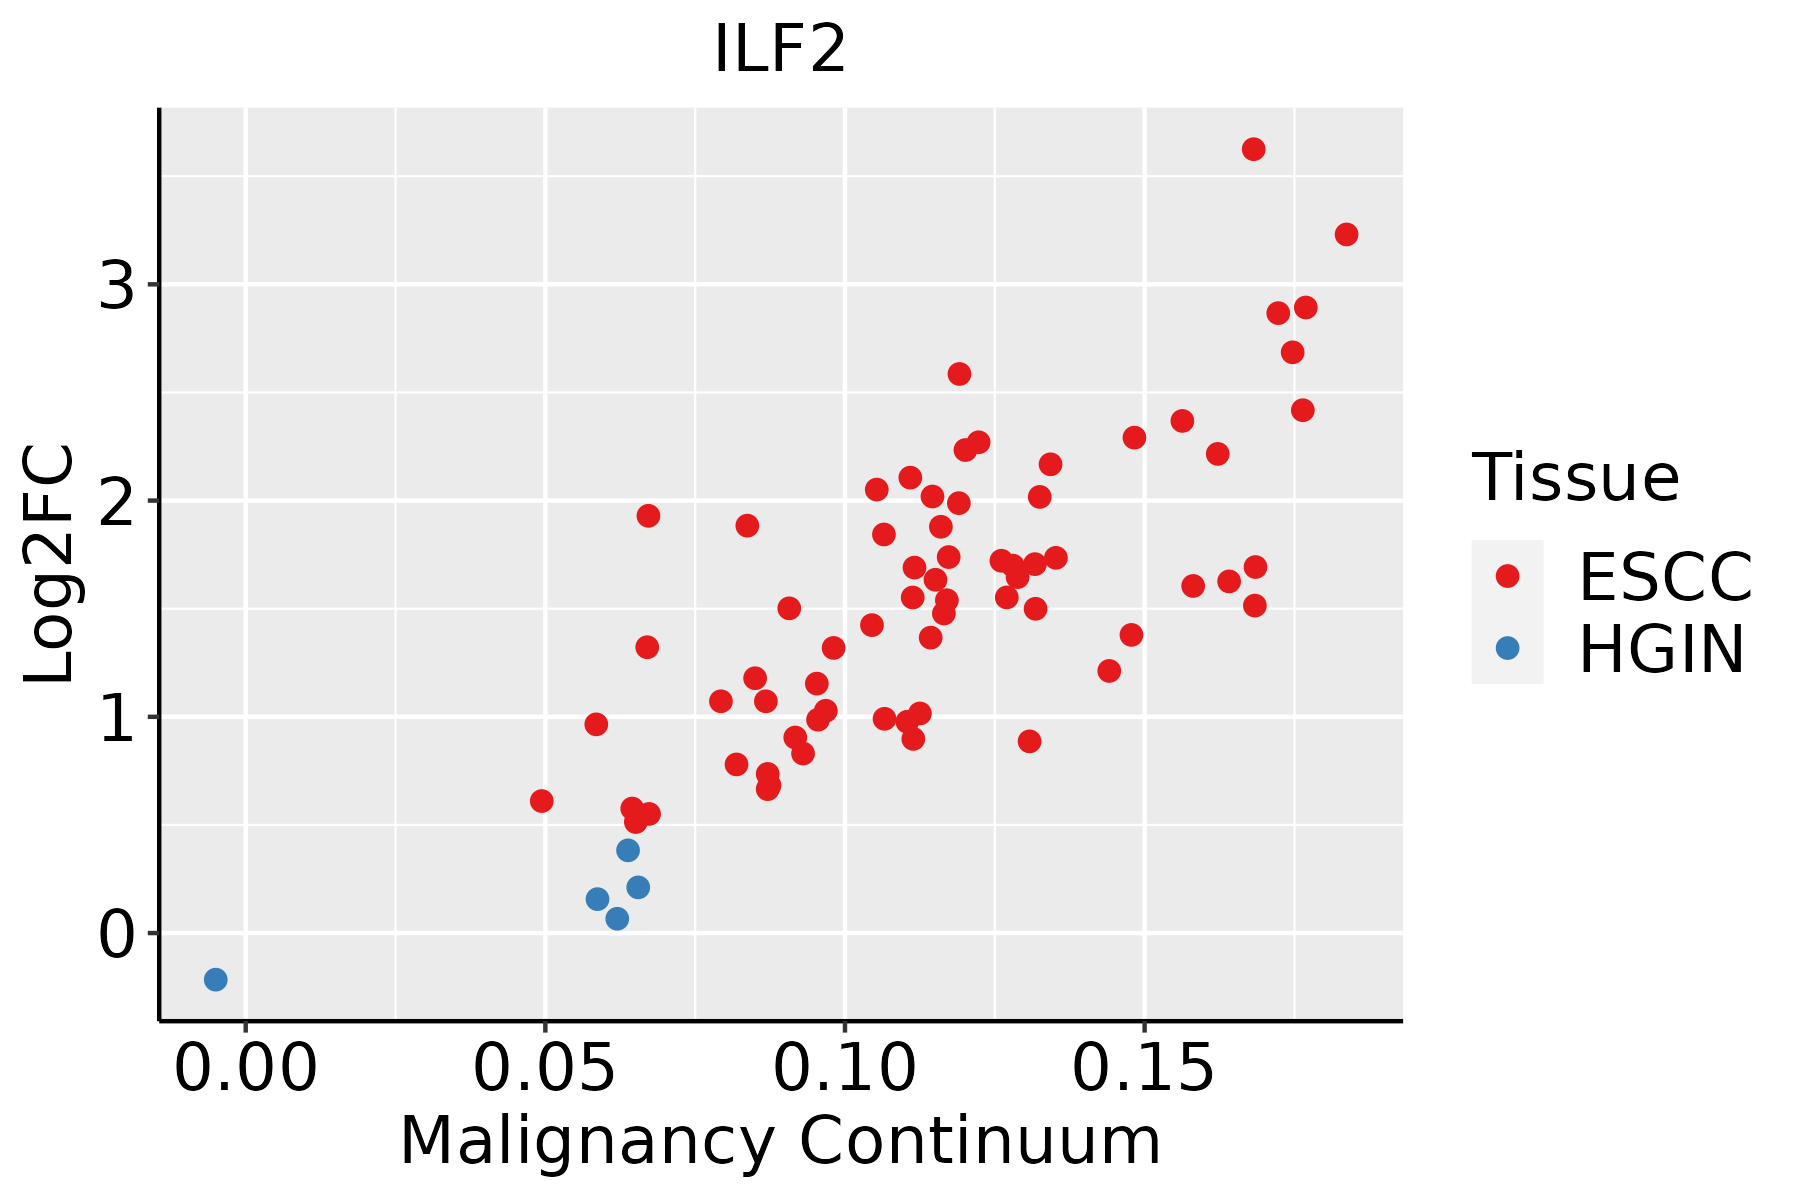 | ESCC: Esophageal squamous cell carcinoma |
| HGIN: High-grade intraepithelial neoplasias | ||
| LGIN: Low-grade intraepithelial neoplasias | ||
| Liver | 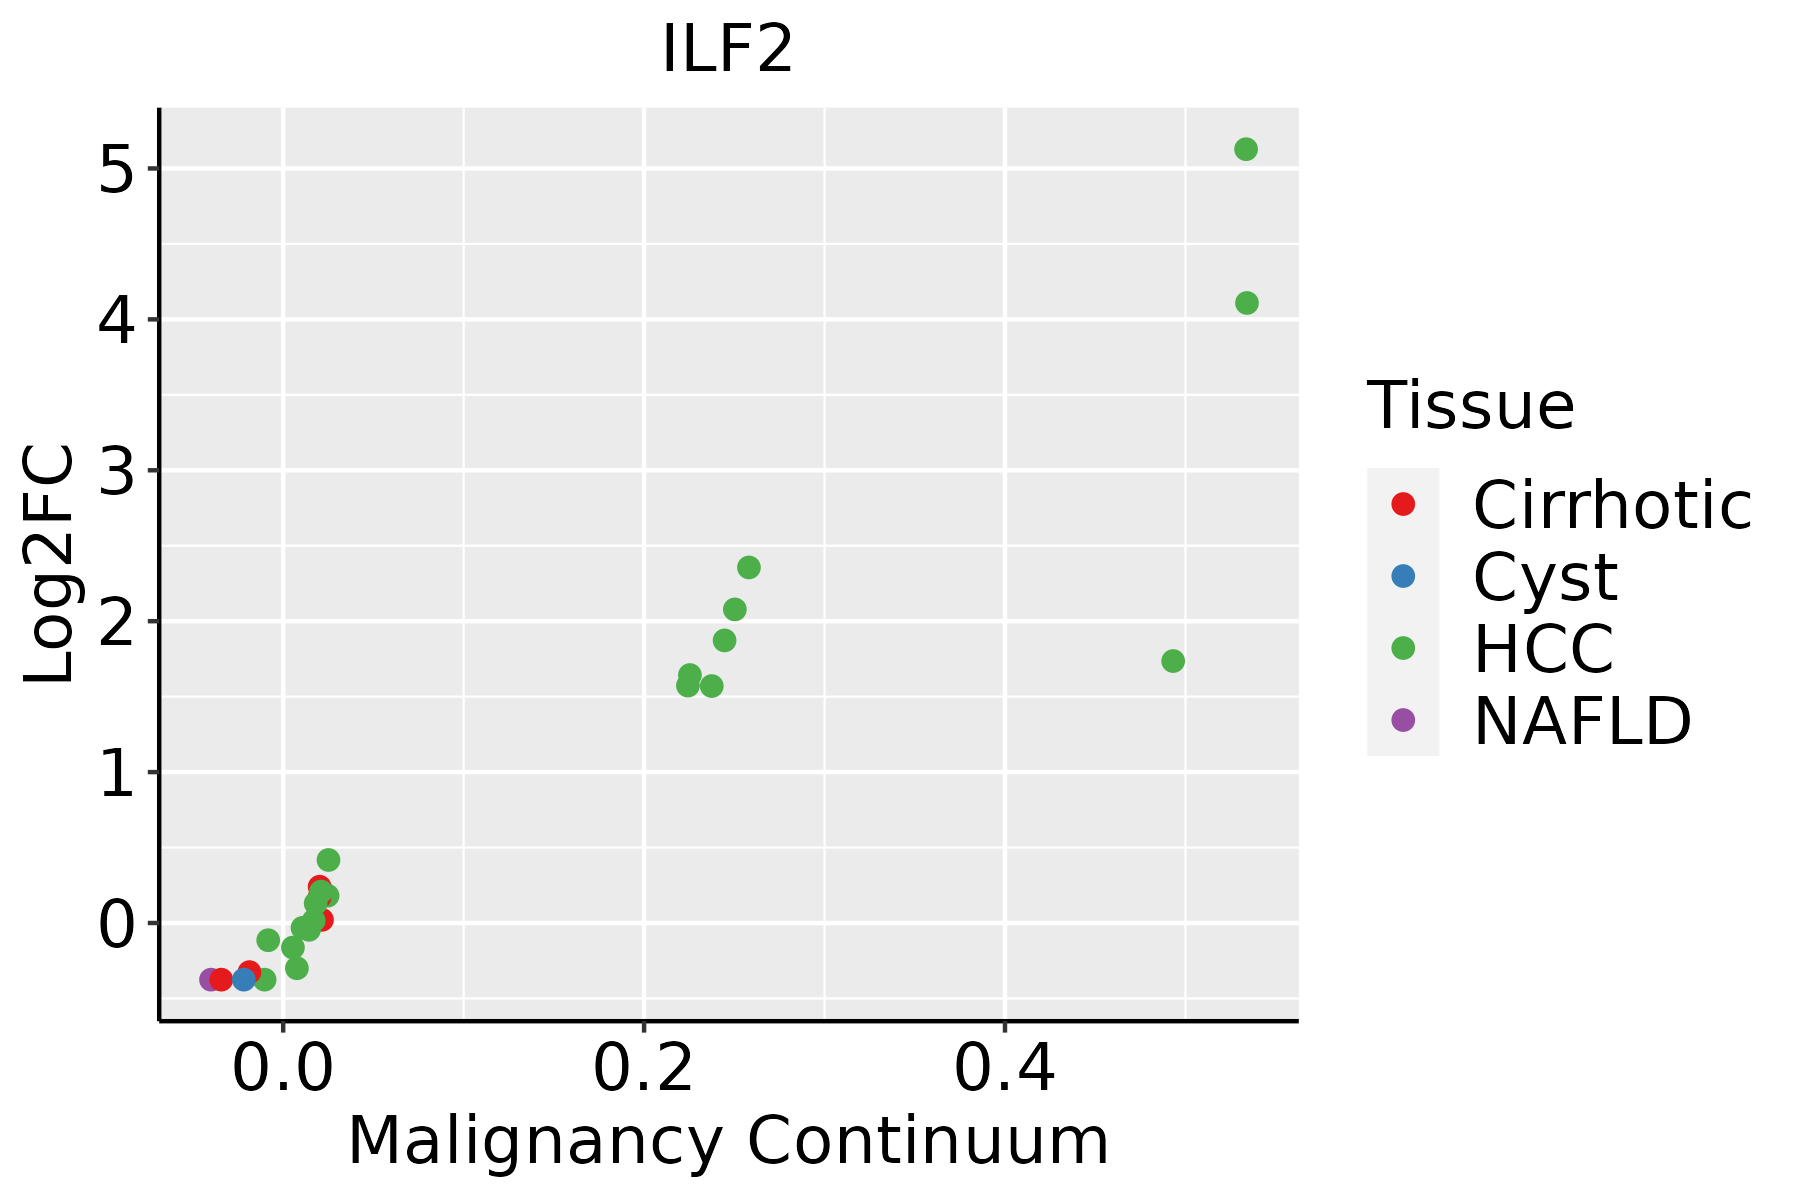 | HCC: Hepatocellular carcinoma |
| NAFLD: Non-alcoholic fatty liver disease | ||
| Oral Cavity |  | EOLP: Erosive Oral lichen planus |
| LP: leukoplakia | ||
| NEOLP: Non-erosive oral lichen planus | ||
| OSCC: Oral squamous cell carcinoma | ||
| Prostate |  | BPH: Benign Prostatic Hyperplasia |
| Skin |  | AK: Actinic keratosis |
| cSCC: Cutaneous squamous cell carcinoma | ||
| SCCIS:squamous cell carcinoma in situ | ||
| Thyroid | 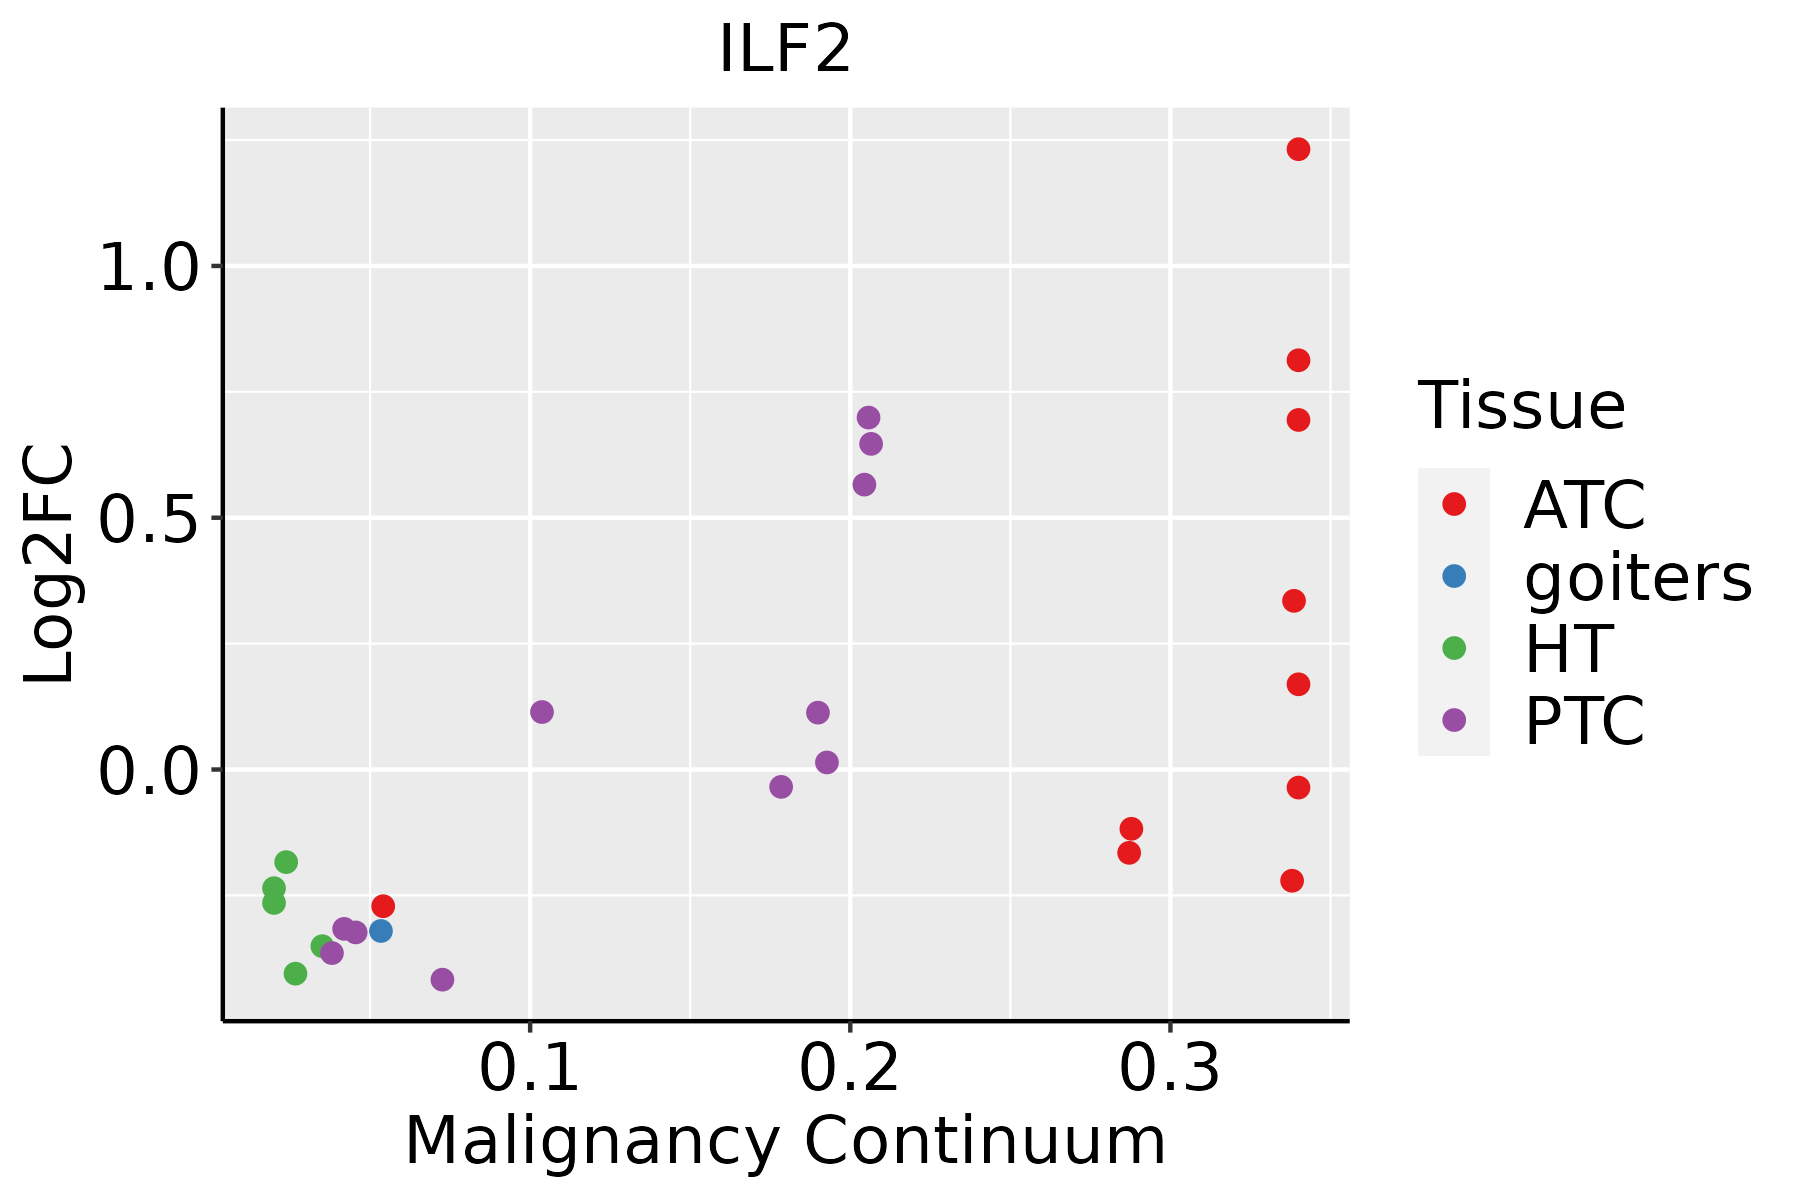 | ATC: Anaplastic thyroid cancer |
| HT: Hashimoto's thyroiditis | ||
| PTC: Papillary thyroid cancer |
| ∗log2FC in expression of this searched gene in stem-like cells from each diseased tissue sample relative to stem-like cells in normal samples in each tissue plotted against the malignancy continuum. Samples are colored based on if they are from different disease stage. |
Top |
Malignant transformation related pathway analysis |
| Find out the enriched GO biological processes and KEGG pathways involved in transition from healthy to precancer to cancer |
| Tissue | Disease Stage | Enriched GO biological Processes |
| Colorectum | AD |  |
| Colorectum | SER |  |
| Colorectum | MSS |  |
| Colorectum | MSI-H |  |
| Colorectum | FAP |  |
| ∗Top 15 enriched GO BP terms are showed in the bar plot of each disease state in each tissue. Each row represents a significant GO biological process which is colored according to the -log10(p.adjust). |
| Page: 1 2 3 4 5 6 7 8 9 |
| GO ID | Tissue | Disease Stage | Description | Gene Ratio | Bg Ratio | pvalue | p.adjust | Count |
| Page: 1 |
| Pathway ID | Tissue | Disease Stage | Description | Gene Ratio | Bg Ratio | pvalue | p.adjust | qvalue | Count |
| Page: 1 |
Top |
Cell-cell communication analysis |
| Identification of potential cell-cell interactions between two cell types and their ligand-receptor pairs for different disease states |
| Ligand | Receptor | LRpair | Pathway | Tissue | Disease Stage |
| Page: 1 |
Top |
Single-cell gene regulatory network inference analysis |
| Find out the significant the regulons (TFs) and the target genes of each regulon across cell types for different disease states |
| TF | Cell Type | Tissue | Disease Stage | Target Gene | RSS | Regulon Activity |
| ILF2 | TFH | Breast | ADJ | RAN,PPA1,CIP2A, etc. | 7.34e-02 |  |
| ILF2 | TFH | Breast | Precancer | RAN,PPA1,CIP2A, etc. | 3.43e-02 |  |
| ILF2 | pDC | Lung | MIAC | SOX4,C12orf73,S100A12, etc. | 1.75e-02 |  |
| ILF2 | M1MAC | Lung | MIAC | SOX4,C12orf73,S100A12, etc. | 2.13e-02 | |
| ILF2 | FIB | Lung | ADJ | ACKR1,SLC12A8,RHOD, etc. | 6.57e-03 |  |
| ILF2 | ICAF | Lung | ADJ | ACKR1,SLC12A8,RHOD, etc. | 3.24e-03 | |
| ILF2 | ADIPO | Lung | AIS | ACKR1,SLC12A8,RHOD, etc. | 1.04e-02 |  |
| ILF2 | LYMEND | Lung | AIS | ACKR1,SLC12A8,RHOD, etc. | 2.68e-03 | |
| ILF2 | MEGA | Lung | AIS | ACKR1,SLC12A8,RHOD, etc. | 0.00e+00 | |
| ILF2 | MSC.MVA | Lung | Healthy | ACKR1,SLC12A8,RHOD, etc. | 2.39e-02 |  |
| ∗The dot plots of a searched regulon are shown for all cell subpopulations in each disease state of each tissue based on the regulon specific score inferred using pySCENIC and by calculating the average expression. |
| Page: 1 2 |
Top |
Somatic mutation of malignant transformation related genes |
| Annotation of somatic variants for genes involved in malignant transformation |
| Hugo Symbol | Variant Class | Variant Classification | dbSNP RS | HGVSc | HGVSp | HGVSp Short | SWISSPROT | BIOTYPE | SIFT | PolyPhen | Tumor Sample Barcode | Tissue | Histology | Sex | Age | Stage | Therapy Types | Drugs | Outcome |
| ILF2 | SNV | Missense_Mutation | c.1170G>T | p.Glu390Asp | p.E390D | Q12905 | protein_coding | tolerated_low_confidence(0.06) | benign(0) | TCGA-BH-A18G-01 | Breast | breast invasive carcinoma | Female | >=65 | I/II | Unknown | Unknown | SD | |
| ILF2 | SNV | Missense_Mutation | c.910C>A | p.Leu304Ile | p.L304I | Q12905 | protein_coding | deleterious(0.02) | possibly_damaging(0.871) | TCGA-BH-A1F5-01 | Breast | breast invasive carcinoma | Female | <65 | I/II | Unknown | Unknown | SD | |
| ILF2 | SNV | Missense_Mutation | c.890N>C | p.Arg297Thr | p.R297T | Q12905 | protein_coding | deleterious(0.01) | probably_damaging(0.987) | TCGA-C8-A12V-01 | Breast | breast invasive carcinoma | Female | <65 | I/II | Unknown | Unknown | SD | |
| ILF2 | SNV | Missense_Mutation | rs767092802 | c.725C>T | p.Pro242Leu | p.P242L | Q12905 | protein_coding | deleterious(0.03) | possibly_damaging(0.543) | TCGA-D8-A1Y3-01 | Breast | breast invasive carcinoma | Female | <65 | III/IV | Chemotherapy | doxorubicine+cyclophosphamide | SD |
| ILF2 | SNV | Missense_Mutation | novel | c.119C>T | p.Ala40Val | p.A40V | Q12905 | protein_coding | tolerated(0.3) | benign(0.076) | TCGA-EW-A6SA-01 | Breast | breast invasive carcinoma | Male | <65 | I/II | Unknown | Unknown | SD |
| ILF2 | SNV | Missense_Mutation | novel | c.937N>G | p.Thr313Ala | p.T313A | Q12905 | protein_coding | deleterious(0.04) | possibly_damaging(0.863) | TCGA-PL-A8LX-01 | Breast | breast invasive carcinoma | Female | <65 | III/IV | Unknown | Unknown | SD |
| ILF2 | SNV | Missense_Mutation | novel | c.644C>T | p.Ala215Val | p.A215V | Q12905 | protein_coding | deleterious(0.04) | possibly_damaging(0.777) | TCGA-2W-A8YY-01 | Cervix | cervical & endocervical cancer | Female | <65 | I/II | Chemotherapy | cisplatin | CR |
| ILF2 | SNV | Missense_Mutation | rs768322800 | c.481N>A | p.Glu161Lys | p.E161K | Q12905 | protein_coding | tolerated(0.09) | benign(0.392) | TCGA-EK-A3GK-01 | Cervix | cervical & endocervical cancer | Female | <65 | I/II | Unknown | Unknown | SD |
| ILF2 | SNV | Missense_Mutation | c.493G>A | p.Glu165Lys | p.E165K | Q12905 | protein_coding | tolerated(0.11) | benign(0.211) | TCGA-AY-6196-01 | Colorectum | colon adenocarcinoma | Male | <65 | III/IV | Unknown | Unknown | SD | |
| ILF2 | SNV | Missense_Mutation | c.1155N>A | p.Ser385Arg | p.S385R | Q12905 | protein_coding | deleterious_low_confidence(0.03) | benign(0.207) | TCGA-CM-4744-01 | Colorectum | colon adenocarcinoma | Male | >=65 | I/II | Unknown | Unknown | SD |
| Page: 1 2 3 4 |
Top |
Related drugs of malignant transformation related genes |
| Identification of chemicals and drugs interact with genes involved in malignant transfromation |
| (DGIdb 4.0) |
| Entrez ID | Symbol | Category | Interaction Types | Drug Claim Name | Drug Name | PMIDs |
| Page: 1 |

Copyright 2023-Present -The University of Texas Health Science Center at Houston |