
|
|||||
|
 | |
| |
| |
| |
| |
| |
|
Gene: IL7R |
Gene summary for IL7R |
| Gene information | Species | Human | Gene symbol | IL7R | Gene ID | 3575 |
| Gene name | interleukin 7 receptor | |
| Gene Alias | CD127 | |
| Cytomap | 5p13.2 | |
| Gene Type | protein-coding | GO ID | GO:0000018 | UniProtAcc | P16871 |
Top |
Malignant transformation analysis |
| Identification of the aberrant gene expression in precancerous and cancerous lesions by comparing the gene expression of stem-like cells in diseased tissues with normal stem cells |
| Entrez ID | Symbol | Replicates | Species | Organ | Tissue | Adj P-value | Log2FC | Malignancy |
| 3575 | IL7R | LZE4T | Human | Esophagus | ESCC | 2.85e-09 | 6.02e-01 | 0.0811 |
| 3575 | IL7R | LZE7T | Human | Esophagus | ESCC | 2.64e-11 | 1.57e+00 | 0.0667 |
| 3575 | IL7R | LZE6T | Human | Esophagus | ESCC | 1.31e-15 | 1.31e+00 | 0.0845 |
| 3575 | IL7R | P15T-E | Human | Esophagus | ESCC | 8.15e-03 | 3.60e-01 | 0.1149 |
| 3575 | IL7R | P19T-E | Human | Esophagus | ESCC | 1.09e-02 | 1.81e-01 | 0.1662 |
| 3575 | IL7R | P24T-E | Human | Esophagus | ESCC | 3.67e-07 | 3.20e-01 | 0.1287 |
| 3575 | IL7R | P32T-E | Human | Esophagus | ESCC | 7.75e-30 | 1.06e+00 | 0.1666 |
| 3575 | IL7R | P37T-E | Human | Esophagus | ESCC | 5.39e-19 | 4.26e-01 | 0.1371 |
| 3575 | IL7R | P49T-E | Human | Esophagus | ESCC | 4.27e-05 | 9.05e-01 | 0.1768 |
| 3575 | IL7R | P52T-E | Human | Esophagus | ESCC | 1.23e-38 | 1.46e+00 | 0.1555 |
| 3575 | IL7R | P83T-E | Human | Esophagus | ESCC | 2.13e-08 | 1.30e+00 | 0.1738 |
| 3575 | IL7R | P89T-E | Human | Esophagus | ESCC | 9.56e-07 | 9.79e-01 | 0.1752 |
| 3575 | IL7R | P107T-E | Human | Esophagus | ESCC | 1.59e-11 | 7.68e-01 | 0.171 |
| 3575 | IL7R | P126T-E | Human | Esophagus | ESCC | 5.33e-03 | 4.98e-01 | 0.1125 |
| 3575 | IL7R | C04 | Human | Oral cavity | OSCC | 2.55e-06 | 7.03e-01 | 0.2633 |
| 3575 | IL7R | C21 | Human | Oral cavity | OSCC | 1.55e-17 | 8.56e-01 | 0.2678 |
| 3575 | IL7R | C30 | Human | Oral cavity | OSCC | 9.36e-17 | 1.12e+00 | 0.3055 |
| 3575 | IL7R | C38 | Human | Oral cavity | OSCC | 2.82e-02 | 2.32e-01 | 0.172 |
| 3575 | IL7R | C51 | Human | Oral cavity | OSCC | 2.13e-09 | 7.15e-01 | 0.2674 |
| 3575 | IL7R | C06 | Human | Oral cavity | OSCC | 4.81e-06 | 1.22e+00 | 0.2699 |
| Page: 1 2 |
| Tissue | Expression Dynamics | Abbreviation |
| Esophagus | 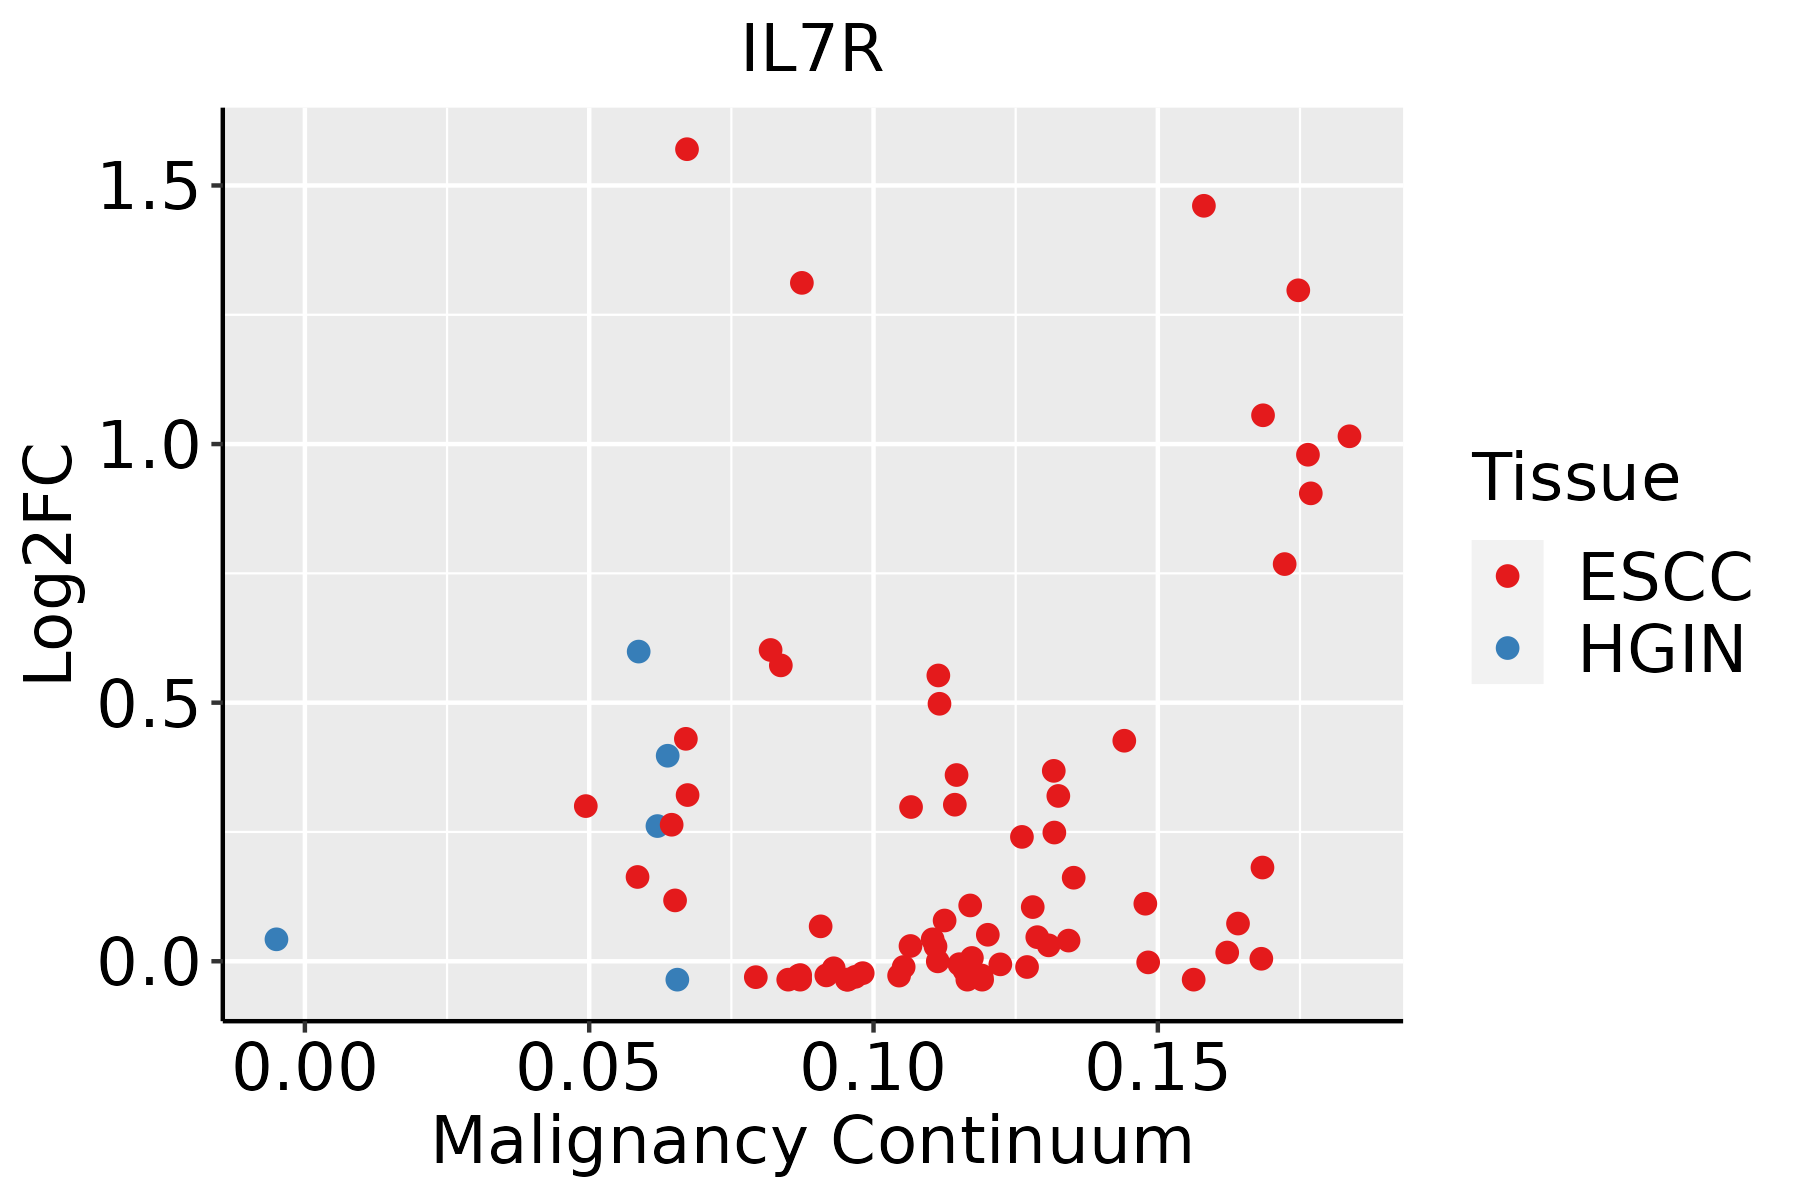 | ESCC: Esophageal squamous cell carcinoma |
| HGIN: High-grade intraepithelial neoplasias | ||
| LGIN: Low-grade intraepithelial neoplasias | ||
| Oral Cavity | 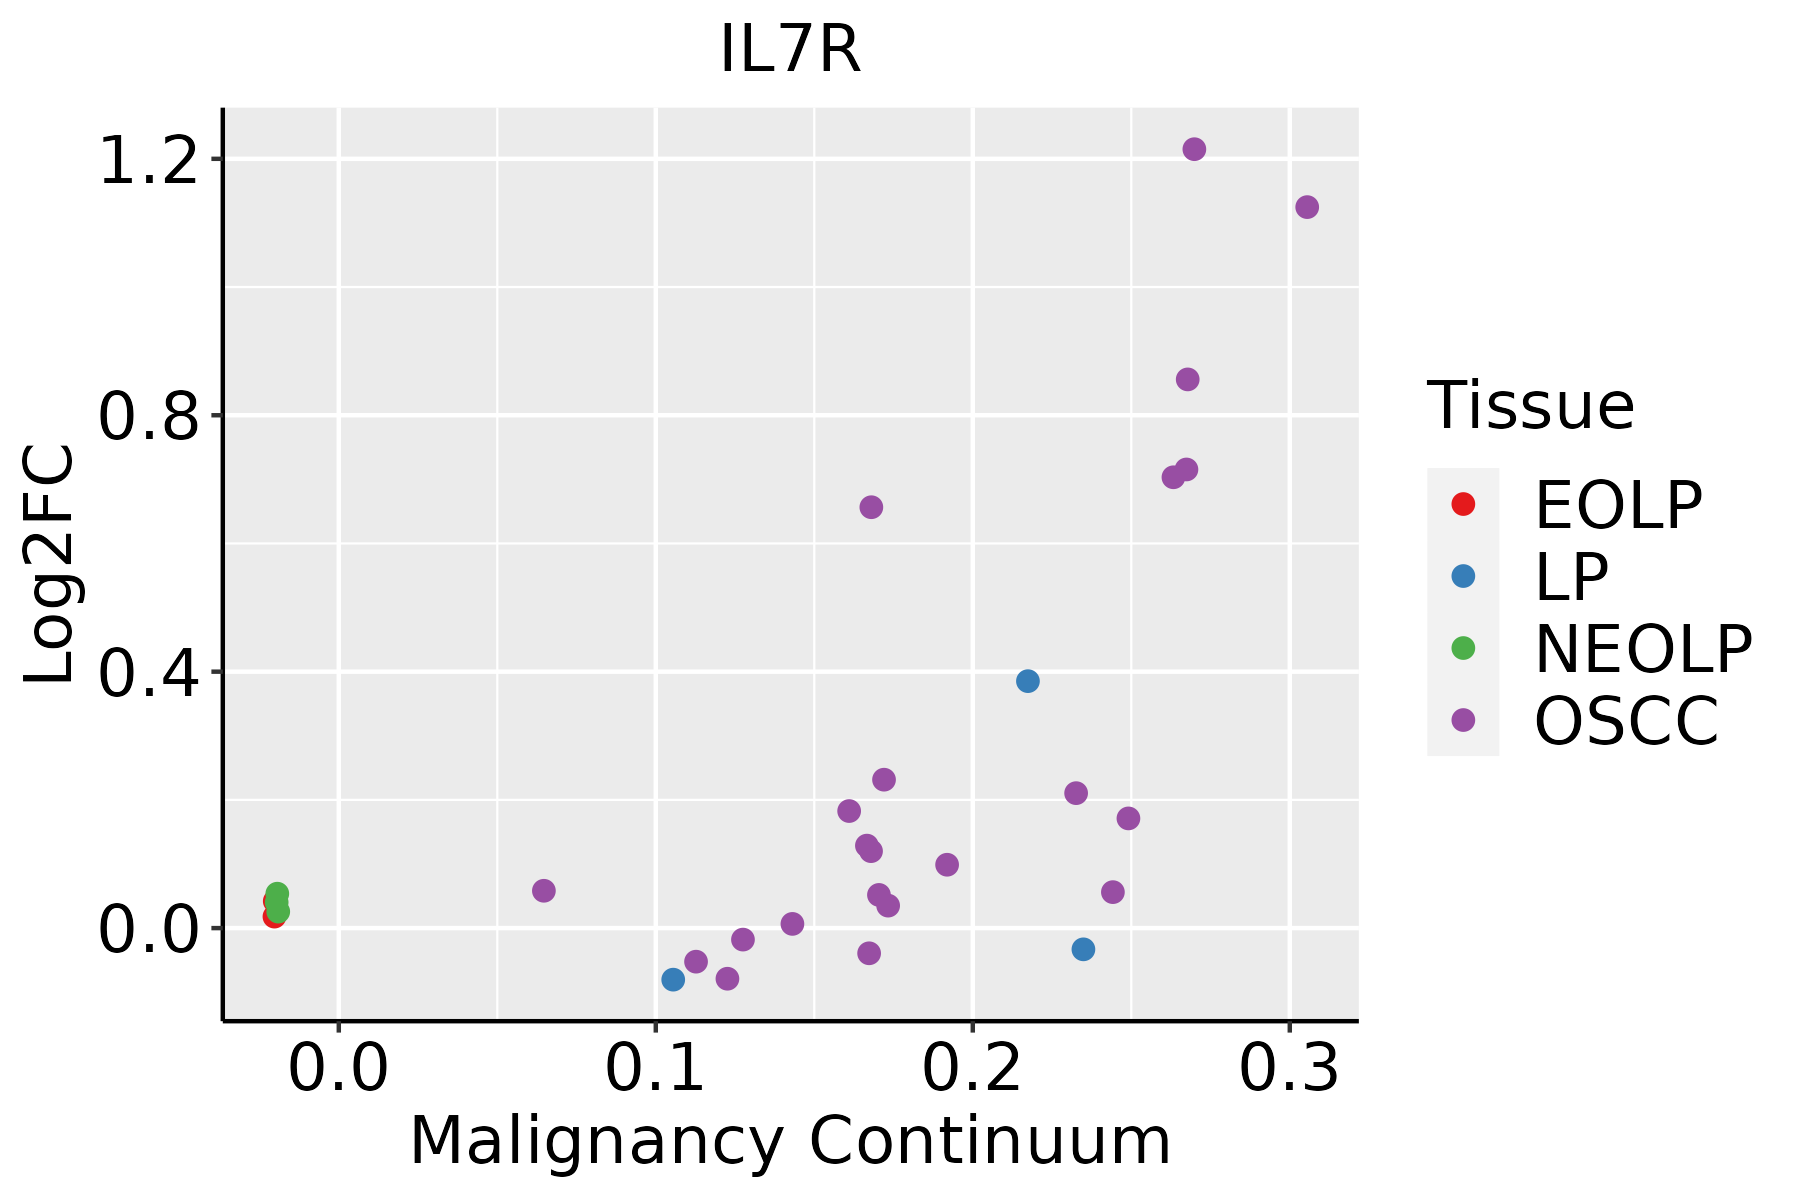 | EOLP: Erosive Oral lichen planus |
| LP: leukoplakia | ||
| NEOLP: Non-erosive oral lichen planus | ||
| OSCC: Oral squamous cell carcinoma | ||
| Thyroid |  | ATC: Anaplastic thyroid cancer |
| HT: Hashimoto's thyroiditis | ||
| PTC: Papillary thyroid cancer |
| ∗log2FC in expression of this searched gene in stem-like cells from each diseased tissue sample relative to stem-like cells in normal samples in each tissue plotted against the malignancy continuum. Samples are colored based on if they are from different disease stage. |
Top |
Malignant transformation related pathway analysis |
| Find out the enriched GO biological processes and KEGG pathways involved in transition from healthy to precancer to cancer |
| Tissue | Disease Stage | Enriched GO biological Processes |
| Colorectum | AD |  |
| Colorectum | SER |  |
| Colorectum | MSS |  |
| Colorectum | MSI-H |  |
| Colorectum | FAP |  |
| ∗Top 15 enriched GO BP terms are showed in the bar plot of each disease state in each tissue. Each row represents a significant GO biological process which is colored according to the -log10(p.adjust). |
| Page: 1 2 3 4 5 6 7 8 9 |
| GO ID | Tissue | Disease Stage | Description | Gene Ratio | Bg Ratio | pvalue | p.adjust | Count |
| GO:005105215 | Esophagus | ESCC | regulation of DNA metabolic process | 232/8552 | 359/18723 | 2.40e-13 | 1.13e-11 | 232 |
| GO:003253520 | Esophagus | ESCC | regulation of cellular component size | 227/8552 | 383/18723 | 4.77e-08 | 8.60e-07 | 227 |
| GO:004578527 | Esophagus | ESCC | positive regulation of cell adhesion | 255/8552 | 437/18723 | 5.07e-08 | 9.11e-07 | 255 |
| GO:0048872111 | Esophagus | ESCC | homeostasis of number of cells | 163/8552 | 272/18723 | 1.40e-06 | 1.69e-05 | 163 |
| GO:0098760110 | Esophagus | ESCC | response to interleukin-7 | 14/8552 | 15/18723 | 1.47e-04 | 9.85e-04 | 14 |
| GO:0098761110 | Esophagus | ESCC | cellular response to interleukin-7 | 14/8552 | 15/18723 | 1.47e-04 | 9.85e-04 | 14 |
| GO:00083619 | Esophagus | ESCC | regulation of cell size | 107/8552 | 181/18723 | 1.81e-04 | 1.16e-03 | 107 |
| GO:1903706110 | Esophagus | ESCC | regulation of hemopoiesis | 201/8552 | 367/18723 | 2.60e-04 | 1.58e-03 | 201 |
| GO:19021076 | Esophagus | ESCC | positive regulation of leukocyte differentiation | 93/8552 | 157/18723 | 4.20e-04 | 2.39e-03 | 93 |
| GO:19037086 | Esophagus | ESCC | positive regulation of hemopoiesis | 93/8552 | 157/18723 | 4.20e-04 | 2.39e-03 | 93 |
| GO:00507775 | Esophagus | ESCC | negative regulation of immune response | 112/8552 | 194/18723 | 4.67e-04 | 2.62e-03 | 112 |
| GO:00063101 | Esophagus | ESCC | DNA recombination | 168/8552 | 305/18723 | 5.58e-04 | 3.05e-03 | 168 |
| GO:002240720 | Esophagus | ESCC | regulation of cell-cell adhesion | 239/8552 | 448/18723 | 5.88e-04 | 3.19e-03 | 239 |
| GO:00718871 | Esophagus | ESCC | leukocyte apoptotic process | 65/8552 | 106/18723 | 8.39e-04 | 4.32e-03 | 65 |
| GO:000268316 | Esophagus | ESCC | negative regulation of immune system process | 231/8552 | 434/18723 | 8.48e-04 | 4.36e-03 | 231 |
| GO:004211018 | Esophagus | ESCC | T cell activation | 256/8552 | 487/18723 | 1.18e-03 | 5.87e-03 | 256 |
| GO:19031317 | Esophagus | ESCC | mononuclear cell differentiation | 226/8552 | 426/18723 | 1.20e-03 | 5.88e-03 | 226 |
| GO:00702271 | Esophagus | ESCC | lymphocyte apoptotic process | 46/8552 | 72/18723 | 1.39e-03 | 6.62e-03 | 46 |
| GO:002240919 | Esophagus | ESCC | positive regulation of cell-cell adhesion | 155/8552 | 284/18723 | 1.50e-03 | 7.06e-03 | 155 |
| GO:190210510 | Esophagus | ESCC | regulation of leukocyte differentiation | 152/8552 | 279/18723 | 1.82e-03 | 8.35e-03 | 152 |
| Page: 1 2 3 4 |
| Pathway ID | Tissue | Disease Stage | Description | Gene Ratio | Bg Ratio | pvalue | p.adjust | qvalue | Count |
| hsa040689 | Esophagus | ESCC | FoxO signaling pathway | 89/4205 | 131/8465 | 1.56e-05 | 7.98e-05 | 4.09e-05 | 89 |
| hsa041517 | Esophagus | ESCC | PI3K-Akt signaling pathway | 197/4205 | 354/8465 | 1.24e-02 | 2.83e-02 | 1.45e-02 | 197 |
| hsa0406814 | Esophagus | ESCC | FoxO signaling pathway | 89/4205 | 131/8465 | 1.56e-05 | 7.98e-05 | 4.09e-05 | 89 |
| hsa0415114 | Esophagus | ESCC | PI3K-Akt signaling pathway | 197/4205 | 354/8465 | 1.24e-02 | 2.83e-02 | 1.45e-02 | 197 |
| hsa040688 | Oral cavity | OSCC | FoxO signaling pathway | 85/3704 | 131/8465 | 7.50e-07 | 4.33e-06 | 2.21e-06 | 85 |
| hsa041516 | Oral cavity | OSCC | PI3K-Akt signaling pathway | 185/3704 | 354/8465 | 6.26e-04 | 1.86e-03 | 9.49e-04 | 185 |
| hsa0406813 | Oral cavity | OSCC | FoxO signaling pathway | 85/3704 | 131/8465 | 7.50e-07 | 4.33e-06 | 2.21e-06 | 85 |
| hsa0415113 | Oral cavity | OSCC | PI3K-Akt signaling pathway | 185/3704 | 354/8465 | 6.26e-04 | 1.86e-03 | 9.49e-04 | 185 |
| Page: 1 |
Top |
Cell-cell communication analysis |
| Identification of potential cell-cell interactions between two cell types and their ligand-receptor pairs for different disease states |
| Ligand | Receptor | LRpair | Pathway | Tissue | Disease Stage |
| IL7 | IL7R_IL2RG | IL7_IL7R_IL2RG | IL2 | Cervix | CC |
| IL7 | IL7R_IL2RG | IL7_IL7R_IL2RG | IL2 | CRC | ADJ |
| IL7 | IL7R_IL2RG | IL7_IL7R_IL2RG | IL2 | CRC | MSI-H |
| IL7 | IL7R_IL2RG | IL7_IL7R_IL2RG | IL2 | Endometrium | ADJ |
| IL7 | IL7R_IL2RG | IL7_IL7R_IL2RG | IL2 | Endometrium | AEH |
| IL7 | IL7R_IL2RG | IL7_IL7R_IL2RG | IL2 | Endometrium | EEC |
| IL7 | IL7R_IL2RG | IL7_IL7R_IL2RG | IL2 | Endometrium | Healthy |
| IL7 | IL7R_IL2RG | IL7_IL7R_IL2RG | IL2 | GC | ADJ |
| IL7 | IL7R_IL2RG | IL7_IL7R_IL2RG | IL2 | GC | GC |
| IL7 | IL7R_IL2RG | IL7_IL7R_IL2RG | IL2 | HNSCC | ADJ |
| IL7 | IL7R_IL2RG | IL7_IL7R_IL2RG | IL2 | HNSCC | Precancer |
| IL7 | IL7R_IL2RG | IL7_IL7R_IL2RG | IL2 | Liver | Healthy |
| IL7 | IL7R_IL2RG | IL7_IL7R_IL2RG | IL2 | Lung | AAH |
| IL7 | IL7R_IL2RG | IL7_IL7R_IL2RG | IL2 | Lung | ADJ |
| IL7 | IL7R_IL2RG | IL7_IL7R_IL2RG | IL2 | Lung | AIS |
| IL7 | IL7R_IL2RG | IL7_IL7R_IL2RG | IL2 | Lung | IAC |
| IL7 | IL7R_IL2RG | IL7_IL7R_IL2RG | IL2 | Lung | MIAC |
| IL7 | IL7R_IL2RG | IL7_IL7R_IL2RG | IL2 | Lung | Precancer |
| IL7 | IL7R_IL2RG | IL7_IL7R_IL2RG | IL2 | Skin | AK |
| Page: 1 |
Top |
Single-cell gene regulatory network inference analysis |
| Find out the significant the regulons (TFs) and the target genes of each regulon across cell types for different disease states |
| TF | Cell Type | Tissue | Disease Stage | Target Gene | RSS | Regulon Activity |
| ∗The dot plots of a searched regulon are shown for all cell subpopulations in each disease state of each tissue based on the regulon specific score inferred using pySCENIC and by calculating the average expression. |
| Page: 1 |
Top |
Somatic mutation of malignant transformation related genes |
| Annotation of somatic variants for genes involved in malignant transformation |
| Hugo Symbol | Variant Class | Variant Classification | dbSNP RS | HGVSc | HGVSp | HGVSp Short | SWISSPROT | BIOTYPE | SIFT | PolyPhen | Tumor Sample Barcode | Tissue | Histology | Sex | Age | Stage | Therapy Types | Drugs | Outcome |
| IL7R | SNV | Missense_Mutation | c.359N>C | p.Lys120Thr | p.K120T | P16871 | protein_coding | tolerated(0.4) | benign(0.001) | TCGA-BH-A0AW-01 | Breast | breast invasive carcinoma | Female | <65 | I/II | Chemotherapy | carboplatin | SD | |
| IL7R | SNV | Missense_Mutation | c.38N>G | p.Ser13Cys | p.S13C | P16871 | protein_coding | tolerated(0.24) | benign(0.001) | TCGA-BH-A1F8-01 | Breast | breast invasive carcinoma | Female | >=65 | III/IV | Unknown | Unknown | PD | |
| IL7R | SNV | Missense_Mutation | c.490N>G | p.Met164Val | p.M164V | P16871 | protein_coding | tolerated(0.29) | benign(0) | TCGA-C8-A12L-01 | Breast | breast invasive carcinoma | Female | >=65 | I/II | Unknown | Unknown | SD | |
| IL7R | SNV | Missense_Mutation | c.544N>T | p.Asn182Tyr | p.N182Y | P16871 | protein_coding | tolerated(0.06) | benign(0.1) | TCGA-E9-A1NH-01 | Breast | breast invasive carcinoma | Female | >=65 | I/II | Hormone Therapy | tamoxiphen | SD | |
| IL7R | SNV | Missense_Mutation | c.785T>C | p.Val262Ala | p.V262A | P16871 | protein_coding | tolerated(0.28) | benign(0.007) | TCGA-E9-A1R7-01 | Breast | breast invasive carcinoma | Female | <65 | I/II | Hormone Therapy | fareston | SD | |
| IL7R | insertion | Nonsense_Mutation | novel | c.953_954insATCAGCATTTTGAGTTTTTTCTCTGTCGCTCTGTTGGTCATCT | p.Asp318GlufsTer5 | p.D318Efs*5 | P16871 | protein_coding | TCGA-A2-A0EQ-01 | Breast | breast invasive carcinoma | Female | <65 | I/II | Chemotherapy | adriamycin | SD | ||
| IL7R | insertion | Frame_Shift_Ins | novel | c.861_862insCCCAGAGGTATATTATTGTCATGTCTTGTTC | p.Lys288ProfsTer24 | p.K288Pfs*24 | P16871 | protein_coding | TCGA-AO-A03R-01 | Breast | breast invasive carcinoma | Female | <65 | I/II | Chemotherapy | doxorubicin | SD | ||
| IL7R | insertion | Frame_Shift_Ins | novel | c.70_71insTAATTTGCAGGAGCAAGTTG | p.Tyr24LeufsTer32 | p.Y24Lfs*32 | P16871 | protein_coding | TCGA-AO-A128-01 | Breast | breast invasive carcinoma | Female | <65 | I/II | Chemotherapy | doxorubicin | SD | ||
| IL7R | SNV | Missense_Mutation | novel | c.1265A>T | p.Gln422Leu | p.Q422L | P16871 | protein_coding | deleterious(0.01) | possibly_damaging(0.875) | TCGA-5M-AAT6-01 | Colorectum | colon adenocarcinoma | Female | <65 | III/IV | Unknown | Unknown | PD |
| IL7R | SNV | Missense_Mutation | novel | c.337N>A | p.Glu113Lys | p.E113K | P16871 | protein_coding | tolerated(0.96) | benign(0.001) | TCGA-AA-3510-01 | Colorectum | colon adenocarcinoma | Male | >=65 | I/II | Unknown | Unknown | SD |
| Page: 1 2 3 4 5 6 7 8 9 10 11 12 13 |
Top |
Related drugs of malignant transformation related genes |
| Identification of chemicals and drugs interact with genes involved in malignant transfromation |
| (DGIdb 4.0) |
| Entrez ID | Symbol | Category | Interaction Types | Drug Claim Name | Drug Name | PMIDs |
| 3575 | IL7R | CLINICALLY ACTIONABLE, EXTERNAL SIDE OF PLASMA MEMBRANE, DRUGGABLE GENOME | PF-06342674 | |||
| 3575 | IL7R | CLINICALLY ACTIONABLE, EXTERNAL SIDE OF PLASMA MEMBRANE, DRUGGABLE GENOME | antibody | 340590234 | ||
| 3575 | IL7R | CLINICALLY ACTIONABLE, EXTERNAL SIDE OF PLASMA MEMBRANE, DRUGGABLE GENOME | CYT-107 | |||
| 3575 | IL7R | CLINICALLY ACTIONABLE, EXTERNAL SIDE OF PLASMA MEMBRANE, DRUGGABLE GENOME | RUXOLITINIB (IN SH2B3 DELETED) | 22897847,22955920 | ||
| 3575 | IL7R | CLINICALLY ACTIONABLE, EXTERNAL SIDE OF PLASMA MEMBRANE, DRUGGABLE GENOME | CYT 99007 |
| Page: 1 |

Copyright 2023-Present -The University of Texas Health Science Center at Houston |