| Tissue | Expression Dynamics | Abbreviation |
| Breast | 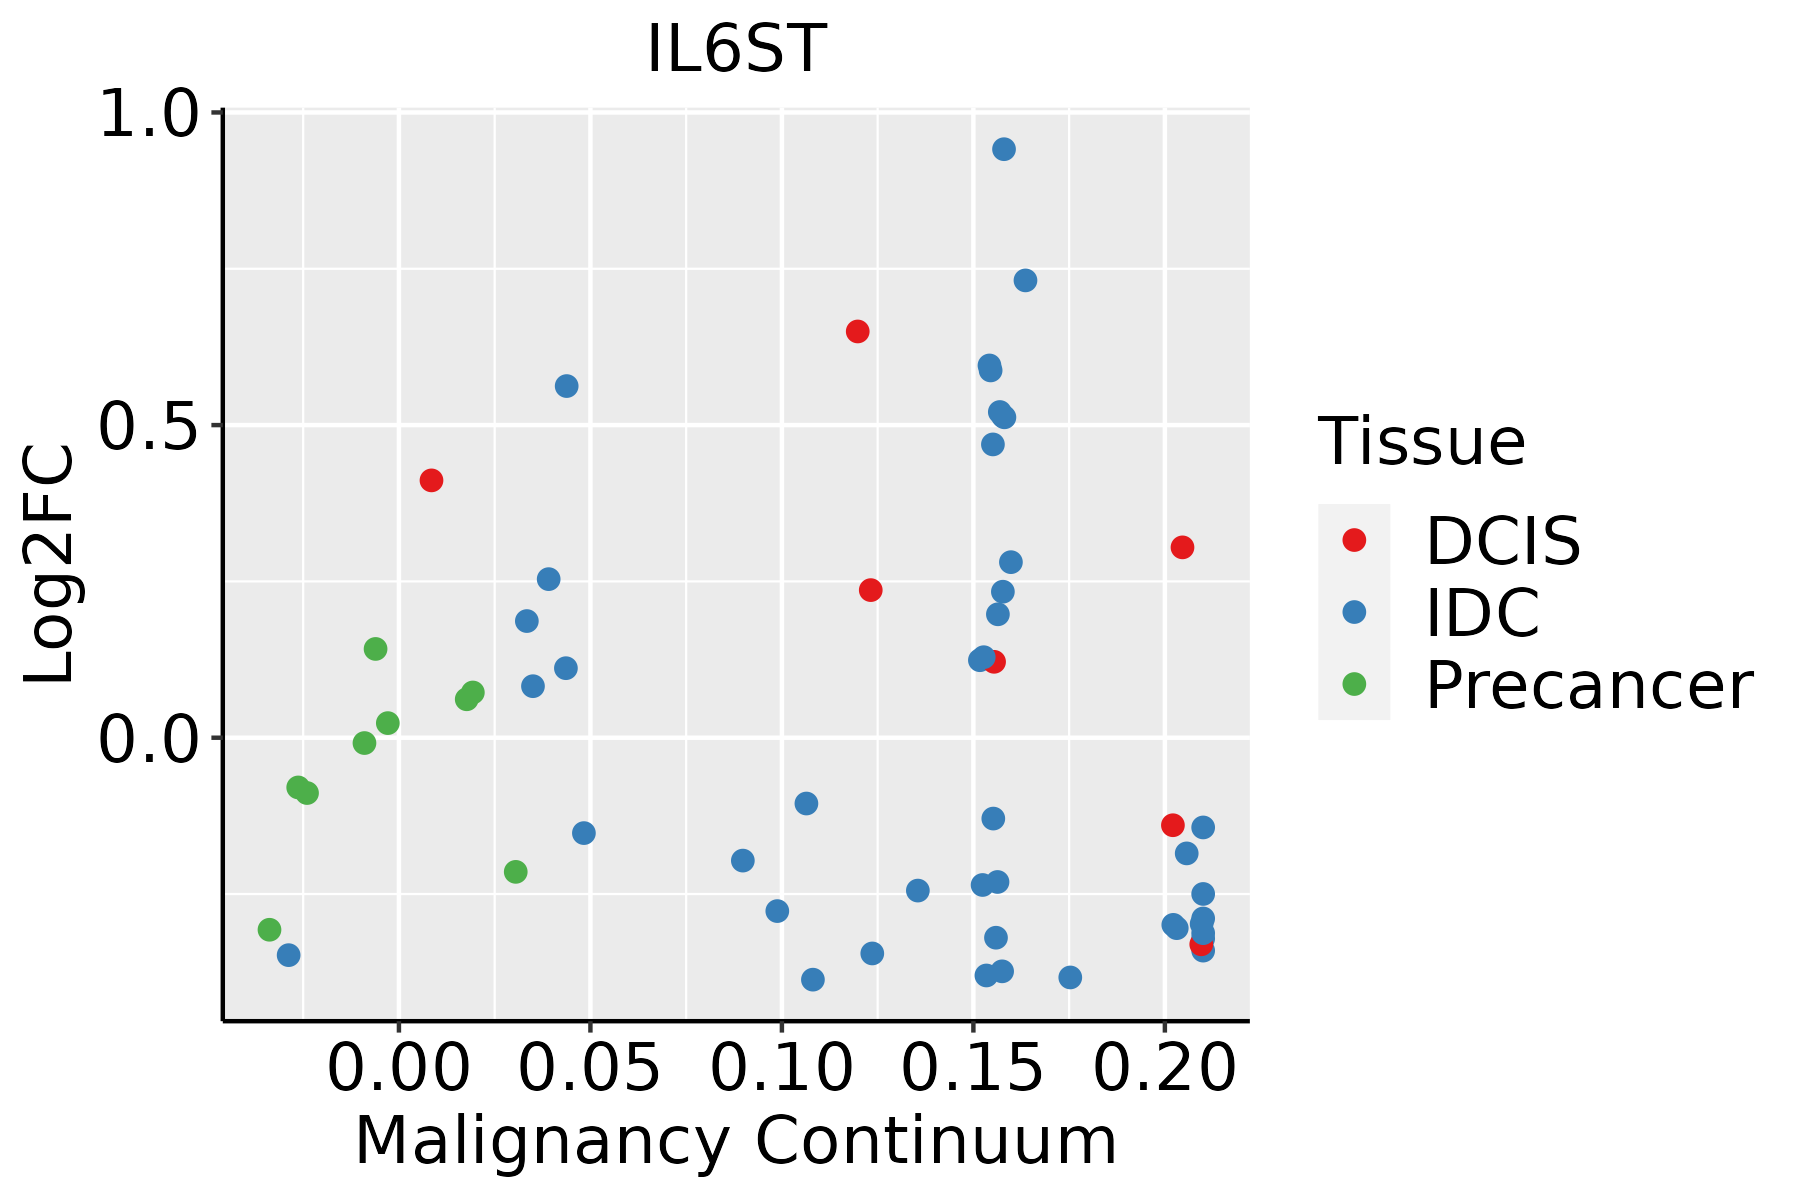 | IDC: Invasive ductal carcinoma |
| DCIS: Ductal carcinoma in situ |
| Precancer(BRCA1-mut): Precancerous lesion from BRCA1 mutation carriers |
| Colorectum (GSE201348) |  | FAP: Familial adenomatous polyposis |
| CRC: Colorectal cancer |
| Colorectum (HTA11) |  | AD: Adenomas |
| SER: Sessile serrated lesions |
| MSI-H: Microsatellite-high colorectal cancer |
| MSS: Microsatellite stable colorectal cancer |
| Esophagus | 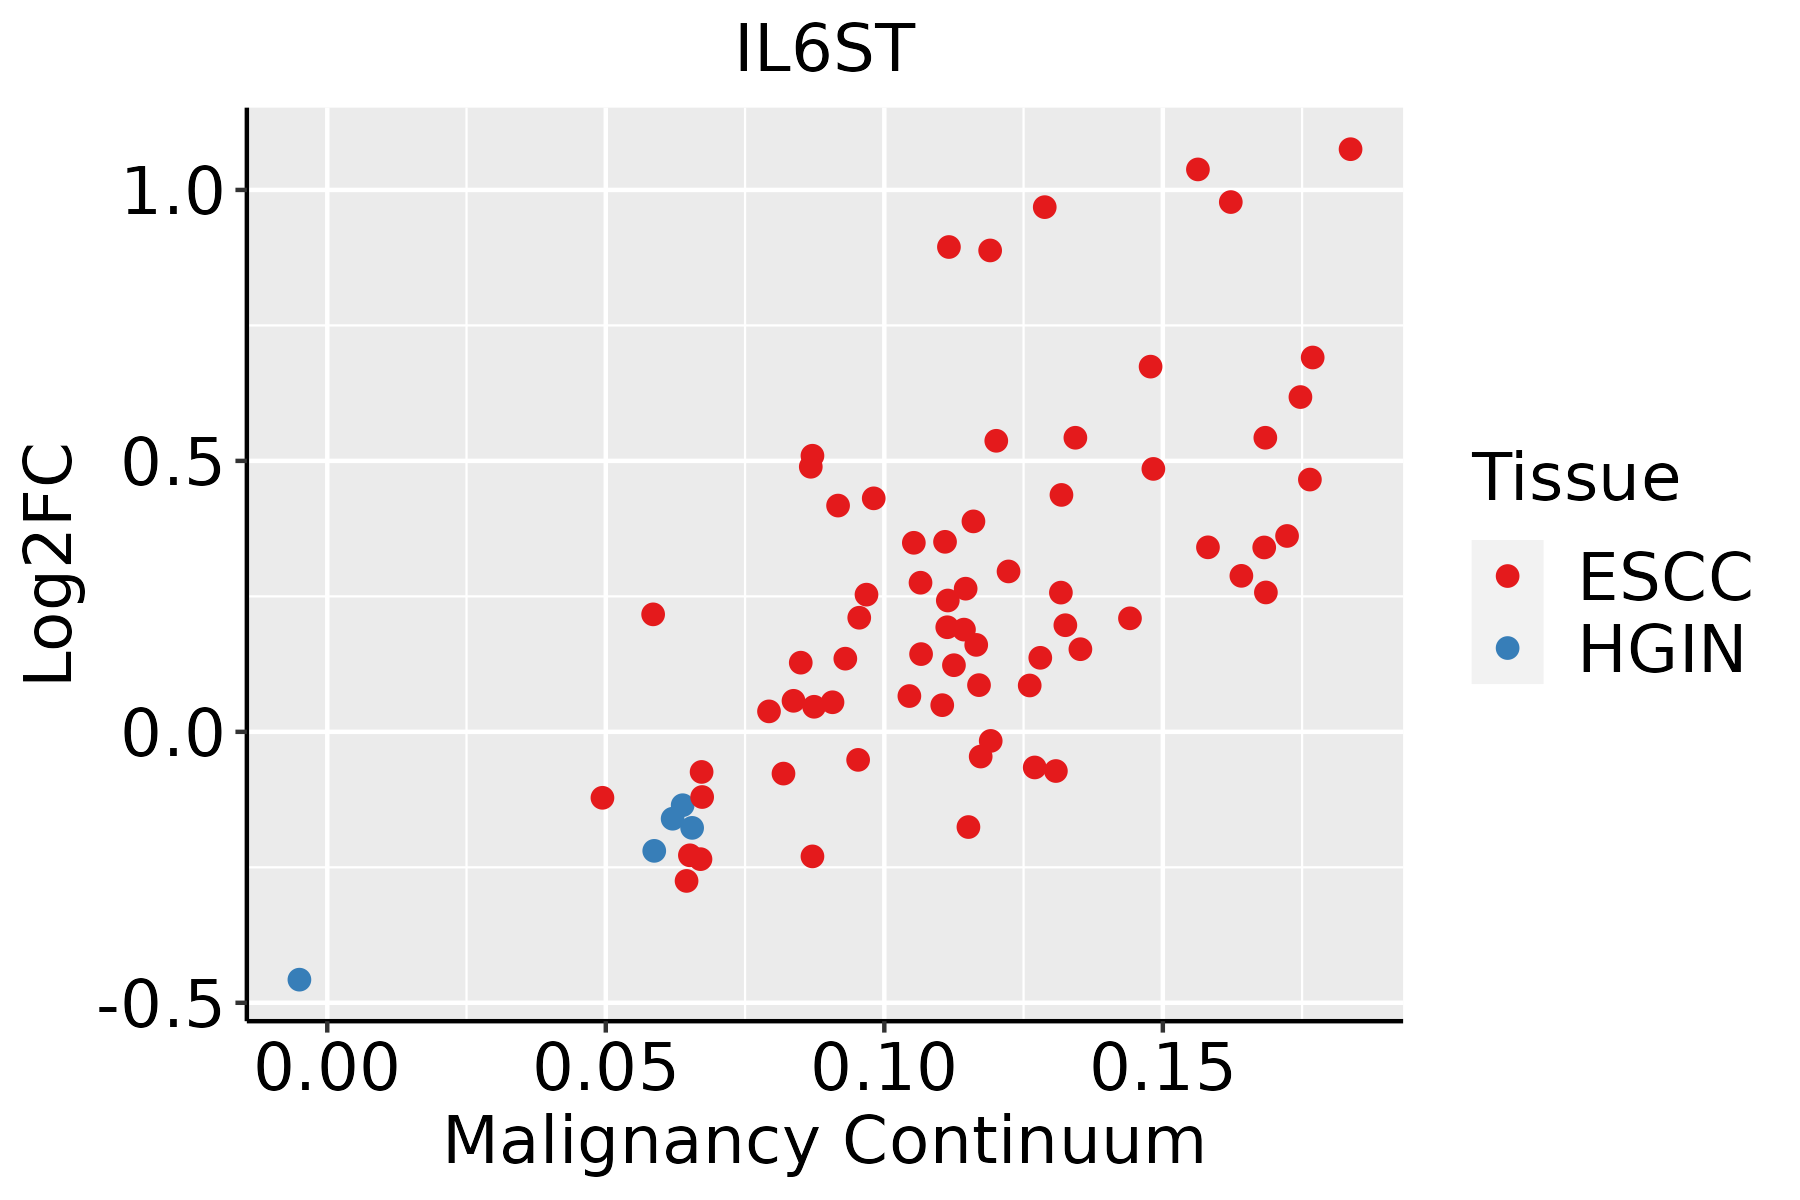 | ESCC: Esophageal squamous cell carcinoma |
| HGIN: High-grade intraepithelial neoplasias |
| LGIN: Low-grade intraepithelial neoplasias |
| Liver |  | HCC: Hepatocellular carcinoma |
| NAFLD: Non-alcoholic fatty liver disease |
| Oral Cavity | 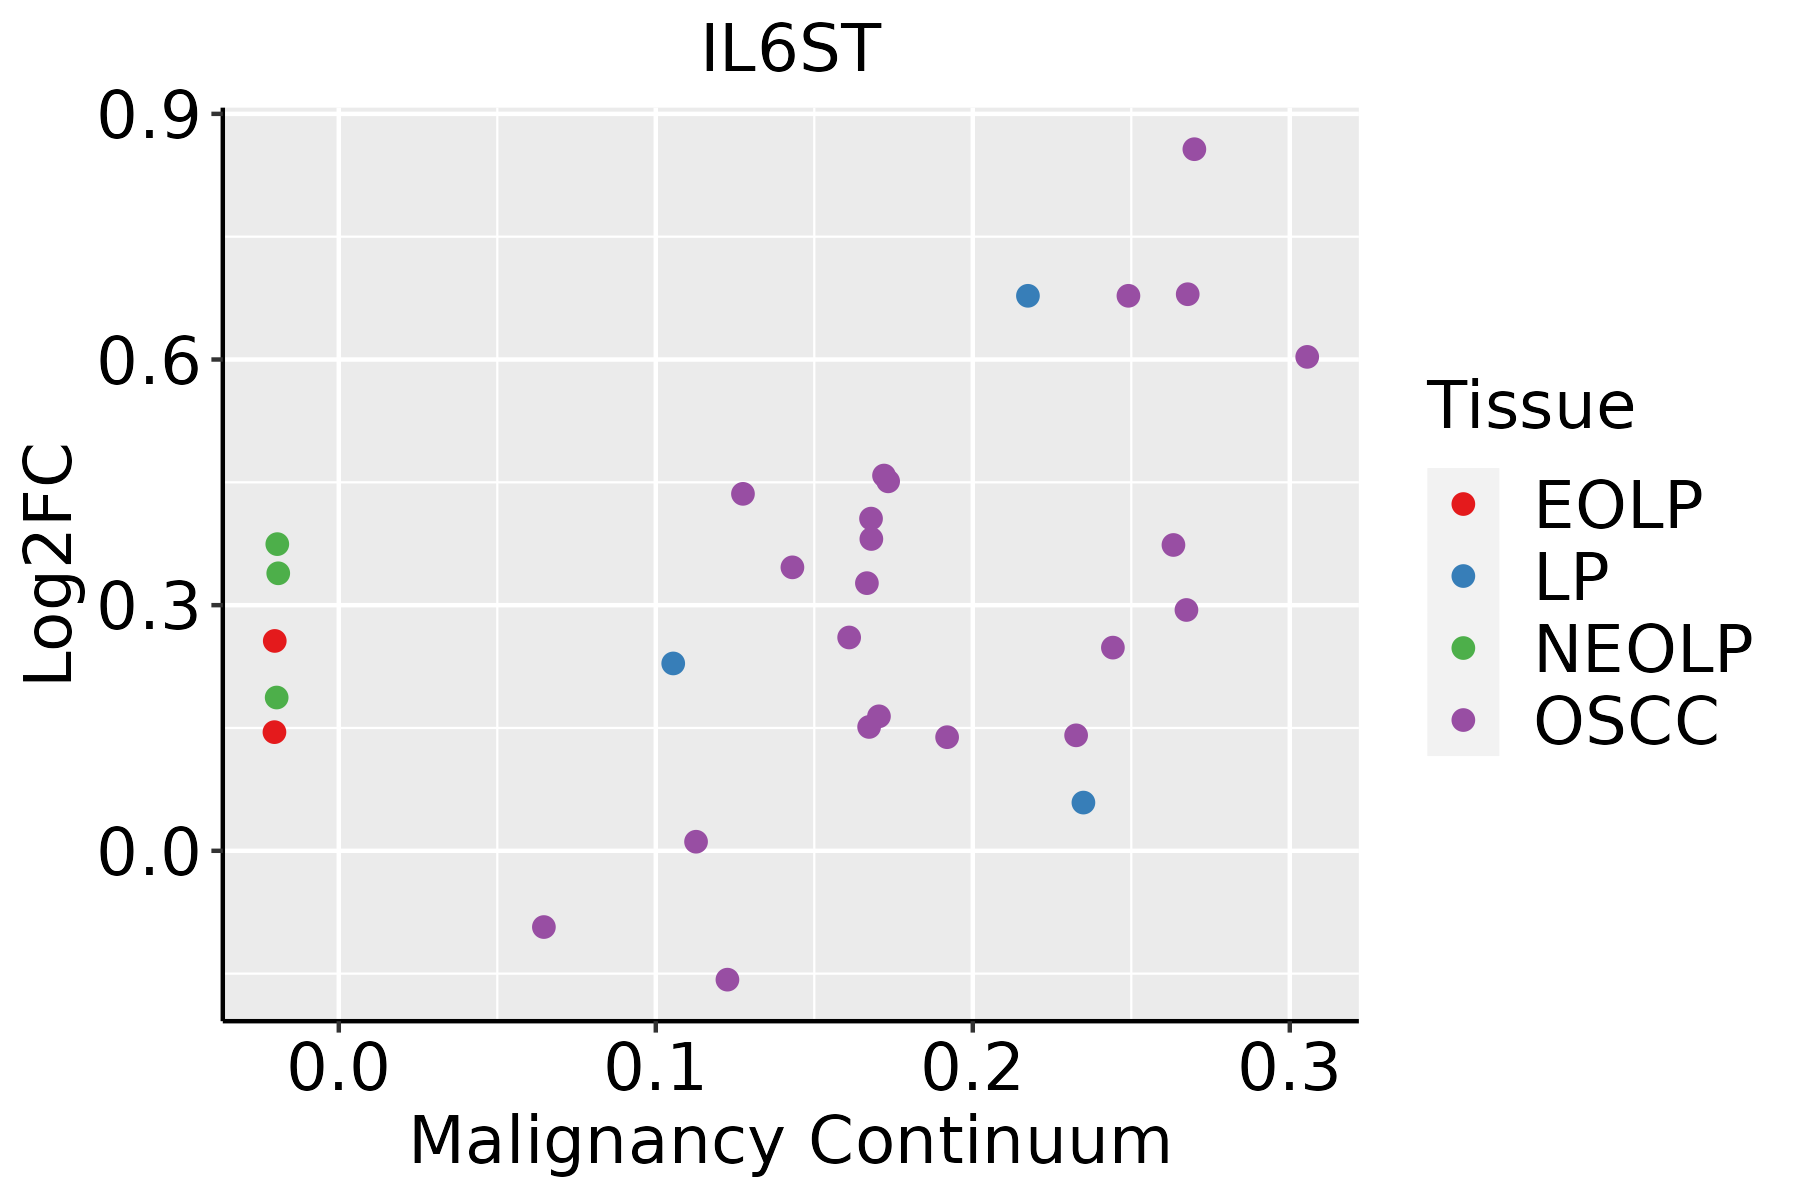 | EOLP: Erosive Oral lichen planus |
| LP: leukoplakia |
| NEOLP: Non-erosive oral lichen planus |
| OSCC: Oral squamous cell carcinoma |
| Prostate | 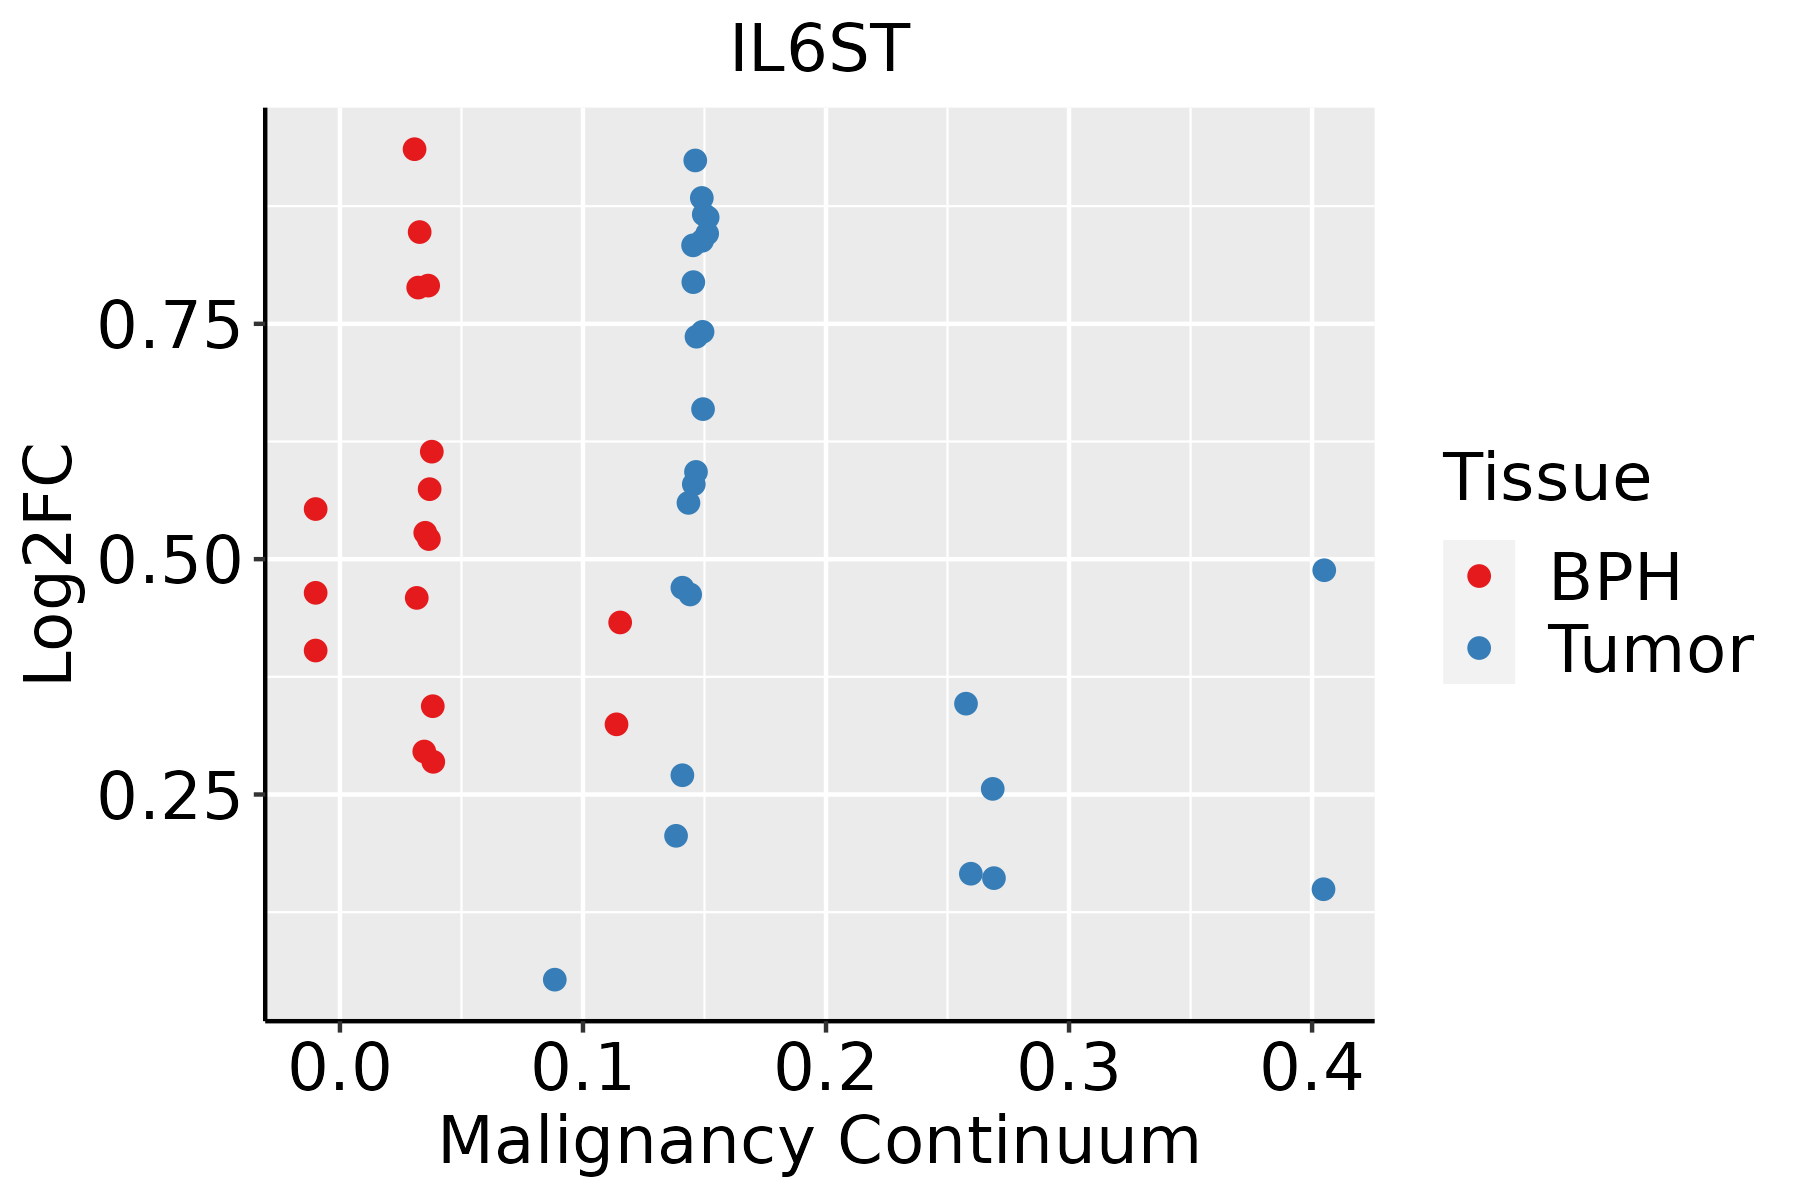 | BPH: Benign Prostatic Hyperplasia |
| Thyroid | 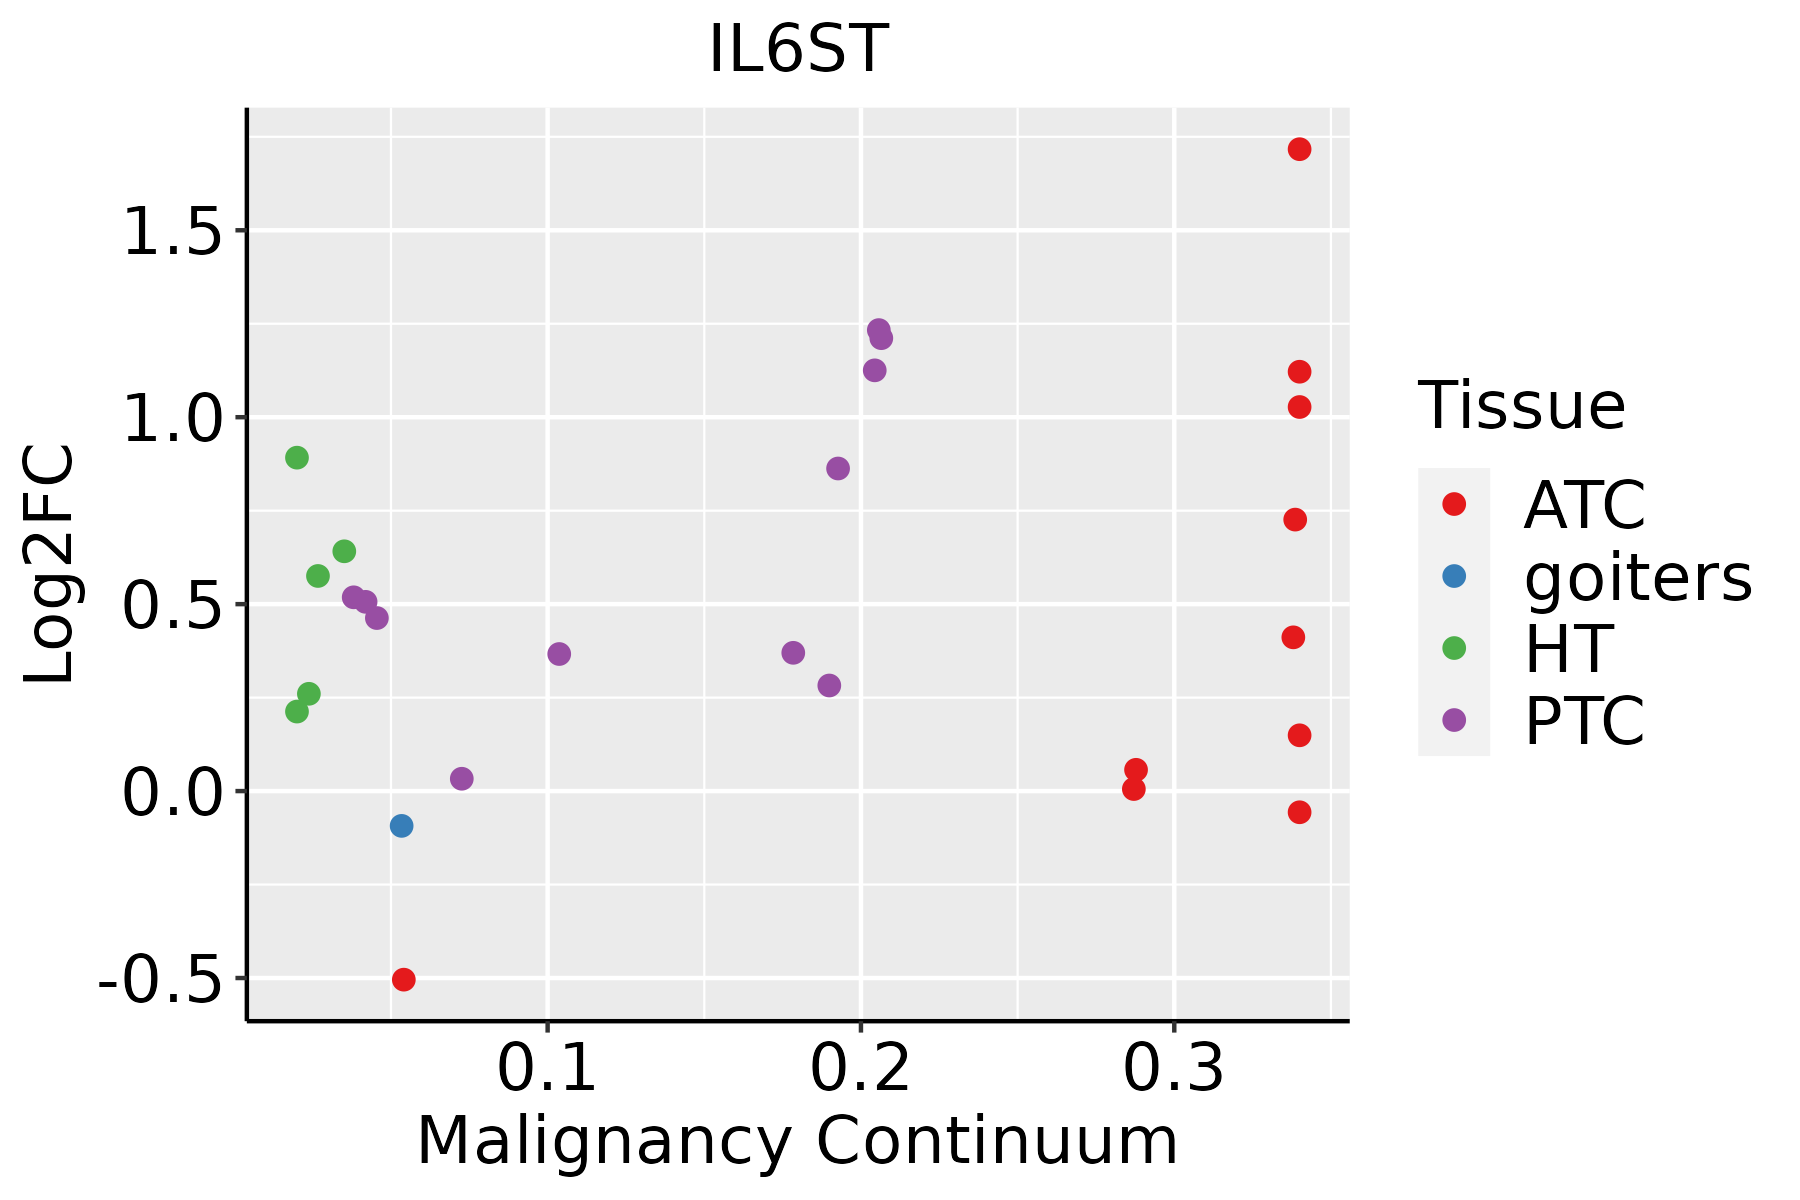 | ATC: Anaplastic thyroid cancer |
| HT: Hashimoto's thyroiditis |
| PTC: Papillary thyroid cancer |
| GO ID | Tissue | Disease Stage | Description | Gene Ratio | Bg Ratio | pvalue | p.adjust | Count |
| GO:00060918 | Breast | Precancer | generation of precursor metabolites and energy | 94/1080 | 490/18723 | 1.54e-25 | 1.64e-22 | 94 |
| GO:00159808 | Breast | Precancer | energy derivation by oxidation of organic compounds | 70/1080 | 318/18723 | 8.33e-23 | 6.37e-20 | 70 |
| GO:00457859 | Breast | Precancer | positive regulation of cell adhesion | 52/1080 | 437/18723 | 5.74e-07 | 2.49e-05 | 52 |
| GO:00341099 | Breast | Precancer | homotypic cell-cell adhesion | 18/1080 | 90/18723 | 3.15e-06 | 1.03e-04 | 18 |
| GO:00018196 | Breast | Precancer | positive regulation of cytokine production | 52/1080 | 467/18723 | 4.18e-06 | 1.29e-04 | 52 |
| GO:00420609 | Breast | Precancer | wound healing | 48/1080 | 422/18723 | 5.48e-06 | 1.63e-04 | 48 |
| GO:00507293 | Breast | Precancer | positive regulation of inflammatory response | 23/1080 | 142/18723 | 6.51e-06 | 1.81e-04 | 23 |
| GO:0050727 | Breast | Precancer | regulation of inflammatory response | 44/1080 | 386/18723 | 1.26e-05 | 3.22e-04 | 44 |
| GO:00421107 | Breast | Precancer | T cell activation | 52/1080 | 487/18723 | 1.37e-05 | 3.42e-04 | 52 |
| GO:00508707 | Breast | Precancer | positive regulation of T cell activation | 29/1080 | 216/18723 | 1.94e-05 | 4.58e-04 | 29 |
| GO:00321034 | Breast | Precancer | positive regulation of response to external stimulus | 46/1080 | 427/18723 | 3.41e-05 | 7.40e-04 | 46 |
| GO:19030396 | Breast | Precancer | positive regulation of leukocyte cell-cell adhesion | 30/1080 | 239/18723 | 5.13e-05 | 1.07e-03 | 30 |
| GO:00313493 | Breast | Precancer | positive regulation of defense response | 33/1080 | 278/18723 | 6.79e-05 | 1.36e-03 | 33 |
| GO:00508637 | Breast | Precancer | regulation of T cell activation | 37/1080 | 329/18723 | 8.04e-05 | 1.56e-03 | 37 |
| GO:00224098 | Breast | Precancer | positive regulation of cell-cell adhesion | 33/1080 | 284/18723 | 1.03e-04 | 1.89e-03 | 33 |
| GO:00071597 | Breast | Precancer | leukocyte cell-cell adhesion | 40/1080 | 371/18723 | 1.07e-04 | 1.94e-03 | 40 |
| GO:00508789 | Breast | Precancer | regulation of body fluid levels | 40/1080 | 379/18723 | 1.68e-04 | 2.77e-03 | 40 |
| GO:00224079 | Breast | Precancer | regulation of cell-cell adhesion | 45/1080 | 448/18723 | 2.12e-04 | 3.30e-03 | 45 |
| GO:19030377 | Breast | Precancer | regulation of leukocyte cell-cell adhesion | 36/1080 | 336/18723 | 2.61e-04 | 3.84e-03 | 36 |
| GO:00420633 | Breast | Precancer | gliogenesis | 33/1080 | 301/18723 | 3.06e-04 | 4.40e-03 | 33 |
| Pathway ID | Tissue | Disease Stage | Description | Gene Ratio | Bg Ratio | pvalue | p.adjust | qvalue | Count |
| hsa0517118 | Breast | Precancer | Coronavirus disease - COVID-19 | 81/684 | 232/8465 | 3.74e-32 | 2.36e-30 | 1.81e-30 | 81 |
| hsa0516718 | Breast | Precancer | Kaposi sarcoma-associated herpesvirus infection | 36/684 | 194/8465 | 1.68e-06 | 2.53e-05 | 1.94e-05 | 36 |
| hsa052036 | Breast | Precancer | Viral carcinogenesis | 27/684 | 204/8465 | 7.19e-03 | 4.06e-02 | 3.11e-02 | 27 |
| hsa0517119 | Breast | Precancer | Coronavirus disease - COVID-19 | 81/684 | 232/8465 | 3.74e-32 | 2.36e-30 | 1.81e-30 | 81 |
| hsa0516719 | Breast | Precancer | Kaposi sarcoma-associated herpesvirus infection | 36/684 | 194/8465 | 1.68e-06 | 2.53e-05 | 1.94e-05 | 36 |
| hsa0520312 | Breast | Precancer | Viral carcinogenesis | 27/684 | 204/8465 | 7.19e-03 | 4.06e-02 | 3.11e-02 | 27 |
| hsa0517124 | Breast | IDC | Coronavirus disease - COVID-19 | 86/867 | 232/8465 | 1.50e-28 | 9.72e-27 | 7.27e-27 | 86 |
| hsa0516723 | Breast | IDC | Kaposi sarcoma-associated herpesvirus infection | 38/867 | 194/8465 | 5.87e-05 | 5.96e-04 | 4.46e-04 | 38 |
| hsa0520322 | Breast | IDC | Viral carcinogenesis | 34/867 | 204/8465 | 2.82e-03 | 1.86e-02 | 1.39e-02 | 34 |
| hsa0517134 | Breast | IDC | Coronavirus disease - COVID-19 | 86/867 | 232/8465 | 1.50e-28 | 9.72e-27 | 7.27e-27 | 86 |
| hsa0516733 | Breast | IDC | Kaposi sarcoma-associated herpesvirus infection | 38/867 | 194/8465 | 5.87e-05 | 5.96e-04 | 4.46e-04 | 38 |
| hsa0520332 | Breast | IDC | Viral carcinogenesis | 34/867 | 204/8465 | 2.82e-03 | 1.86e-02 | 1.39e-02 | 34 |
| hsa0517144 | Breast | DCIS | Coronavirus disease - COVID-19 | 86/846 | 232/8465 | 2.42e-29 | 1.56e-27 | 1.15e-27 | 86 |
| hsa0516743 | Breast | DCIS | Kaposi sarcoma-associated herpesvirus infection | 38/846 | 194/8465 | 3.43e-05 | 3.69e-04 | 2.72e-04 | 38 |
| hsa0520341 | Breast | DCIS | Viral carcinogenesis | 34/846 | 204/8465 | 1.88e-03 | 1.27e-02 | 9.33e-03 | 34 |
| hsa0517154 | Breast | DCIS | Coronavirus disease - COVID-19 | 86/846 | 232/8465 | 2.42e-29 | 1.56e-27 | 1.15e-27 | 86 |
| hsa0516753 | Breast | DCIS | Kaposi sarcoma-associated herpesvirus infection | 38/846 | 194/8465 | 3.43e-05 | 3.69e-04 | 2.72e-04 | 38 |
| hsa052035 | Breast | DCIS | Viral carcinogenesis | 34/846 | 204/8465 | 1.88e-03 | 1.27e-02 | 9.33e-03 | 34 |
| hsa05171 | Colorectum | AD | Coronavirus disease - COVID-19 | 113/2092 | 232/8465 | 9.90e-16 | 2.55e-14 | 1.63e-14 | 113 |
| hsa051711 | Colorectum | AD | Coronavirus disease - COVID-19 | 113/2092 | 232/8465 | 9.90e-16 | 2.55e-14 | 1.63e-14 | 113 |
| Hugo Symbol | Variant Class | Variant Classification | dbSNP RS | HGVSc | HGVSp | HGVSp Short | SWISSPROT | BIOTYPE | SIFT | PolyPhen | Tumor Sample Barcode | Tissue | Histology | Sex | Age | Stage | Therapy Types | Drugs | Outcome |
| IL6ST | SNV | Missense_Mutation | novel | c.1768N>A | p.Val590Ile | p.V590I | P40189 | protein_coding | tolerated(0.08) | possibly_damaging(0.682) | TCGA-AN-A046-01 | Breast | breast invasive carcinoma | Female | >=65 | I/II | Unknown | Unknown | SD |
| IL6ST | SNV | Missense_Mutation | rs764426398 | c.412N>A | p.Glu138Lys | p.E138K | P40189 | protein_coding | tolerated(0.06) | possibly_damaging(0.465) | TCGA-AN-A046-01 | Breast | breast invasive carcinoma | Female | >=65 | I/II | Unknown | Unknown | SD |
| IL6ST | SNV | Missense_Mutation | rs750312883 | c.1435C>T | p.Arg479Cys | p.R479C | P40189 | protein_coding | deleterious(0.02) | benign(0.37) | TCGA-AN-A0XW-01 | Breast | breast invasive carcinoma | Female | <65 | III/IV | Unknown | Unknown | SD |
| IL6ST | SNV | Missense_Mutation | | c.413N>C | p.Glu138Ala | p.E138A | P40189 | protein_coding | tolerated(0.06) | possibly_damaging(0.542) | TCGA-AR-A251-01 | Breast | breast invasive carcinoma | Female | <65 | III/IV | Chemotherapy | doxorubicin | SD |
| IL6ST | SNV | Missense_Mutation | | c.836N>G | p.Ser279Cys | p.S279C | P40189 | protein_coding | deleterious(0) | possibly_damaging(0.773) | TCGA-BH-A0WA-01 | Breast | breast invasive carcinoma | Female | >=65 | I/II | Unknown | Unknown | SD |
| IL6ST | SNV | Missense_Mutation | | c.1136A>G | p.Asn379Ser | p.N379S | P40189 | protein_coding | tolerated(0.85) | benign(0.003) | TCGA-C8-A12X-01 | Breast | breast invasive carcinoma | Female | <65 | I/II | Unknown | Unknown | SD |
| IL6ST | SNV | Missense_Mutation | | c.1520N>G | p.Pro507Arg | p.P507R | P40189 | protein_coding | tolerated(0.11) | benign(0.268) | TCGA-GI-A2C8-01 | Breast | breast invasive carcinoma | Female | <65 | III/IV | Unspecific | Adriamycin | SD |
| IL6ST | SNV | Missense_Mutation | rs755797298 | c.1436G>A | p.Arg479His | p.R479H | P40189 | protein_coding | tolerated(0.14) | benign(0) | TCGA-2W-A8YY-01 | Cervix | cervical & endocervical cancer | Female | <65 | I/II | Chemotherapy | cisplatin | CR |
| IL6ST | SNV | Missense_Mutation | rs747379809 | c.703N>A | p.Glu235Lys | p.E235K | P40189 | protein_coding | tolerated(0.23) | possibly_damaging(0.695) | TCGA-C5-A901-01 | Cervix | cervical & endocervical cancer | Female | <65 | I/II | Unknown | Unknown | SD |
| IL6ST | SNV | Missense_Mutation | | c.2471N>T | p.Ser824Phe | p.S824F | P40189 | protein_coding | tolerated(0.4) | benign(0) | TCGA-FU-A3HZ-01 | Cervix | cervical & endocervical cancer | Female | <65 | I/II | Chemotherapy | cisplatin | CR |


