
|
|||||
|
 | |
| |
| |
| |
| |
| |
|
Gene: IL6R |
Gene summary for IL6R |
| Gene information | Species | Human | Gene symbol | IL6R | Gene ID | 3570 |
| Gene name | interleukin 6 receptor | |
| Gene Alias | CD126 | |
| Cytomap | 1q21.3 | |
| Gene Type | protein-coding | GO ID | GO:0001503 | UniProtAcc | A0N0L5 |
Top |
Malignant transformation analysis |
| Identification of the aberrant gene expression in precancerous and cancerous lesions by comparing the gene expression of stem-like cells in diseased tissues with normal stem cells |
| Entrez ID | Symbol | Replicates | Species | Organ | Tissue | Adj P-value | Log2FC | Malignancy |
| 3570 | IL6R | HTA11_347_2000001011 | Human | Colorectum | AD | 7.35e-17 | 4.76e-01 | -0.1954 |
| 3570 | IL6R | HTA11_696_2000001011 | Human | Colorectum | AD | 1.81e-06 | 3.19e-01 | -0.1464 |
| 3570 | IL6R | A002-C-201 | Human | Colorectum | FAP | 8.13e-03 | -1.26e-01 | 0.0324 |
| 3570 | IL6R | F072B | Human | Colorectum | FAP | 1.92e-04 | -1.26e-01 | 0.257 |
| 3570 | IL6R | NAFLD1 | Human | Liver | NAFLD | 6.82e-09 | 1.16e+00 | -0.04 |
| 3570 | IL6R | S41 | Human | Liver | Cirrhotic | 8.74e-03 | 4.20e-01 | -0.0343 |
| 3570 | IL6R | S43 | Human | Liver | Cirrhotic | 2.84e-03 | -2.36e-01 | -0.0187 |
| 3570 | IL6R | HCC1_Meng | Human | Liver | HCC | 4.51e-41 | -2.30e-01 | 0.0246 |
| 3570 | IL6R | HCC2_Meng | Human | Liver | HCC | 1.20e-10 | -2.95e-01 | 0.0107 |
| 3570 | IL6R | cirrhotic1 | Human | Liver | Cirrhotic | 5.01e-07 | -2.97e-01 | 0.0202 |
| 3570 | IL6R | cirrhotic2 | Human | Liver | Cirrhotic | 7.62e-07 | -3.09e-01 | 0.0201 |
| 3570 | IL6R | cirrhotic3 | Human | Liver | Cirrhotic | 2.23e-02 | -2.83e-01 | 0.0215 |
| 3570 | IL6R | HCC1 | Human | Liver | HCC | 1.04e-08 | 2.90e+00 | 0.5336 |
| 3570 | IL6R | HCC2 | Human | Liver | HCC | 3.75e-38 | 5.23e+00 | 0.5341 |
| 3570 | IL6R | HCC5 | Human | Liver | HCC | 7.44e-07 | 2.67e+00 | 0.4932 |
| 3570 | IL6R | Pt13.a | Human | Liver | HCC | 4.77e-03 | -1.97e-01 | 0.021 |
| 3570 | IL6R | Pt13.b | Human | Liver | HCC | 1.40e-10 | -1.80e-01 | 0.0251 |
| 3570 | IL6R | S027 | Human | Liver | HCC | 1.57e-03 | 6.69e-01 | 0.2446 |
| 3570 | IL6R | S028 | Human | Liver | HCC | 1.36e-11 | 7.75e-01 | 0.2503 |
| 3570 | IL6R | S029 | Human | Liver | HCC | 7.40e-18 | 1.14e+00 | 0.2581 |
| Page: 1 2 |
| Tissue | Expression Dynamics | Abbreviation |
| Colorectum (GSE201348) |  | FAP: Familial adenomatous polyposis |
| CRC: Colorectal cancer | ||
| Colorectum (HTA11) |  | AD: Adenomas |
| SER: Sessile serrated lesions | ||
| MSI-H: Microsatellite-high colorectal cancer | ||
| MSS: Microsatellite stable colorectal cancer | ||
| Liver |  | HCC: Hepatocellular carcinoma |
| NAFLD: Non-alcoholic fatty liver disease | ||
| Skin | 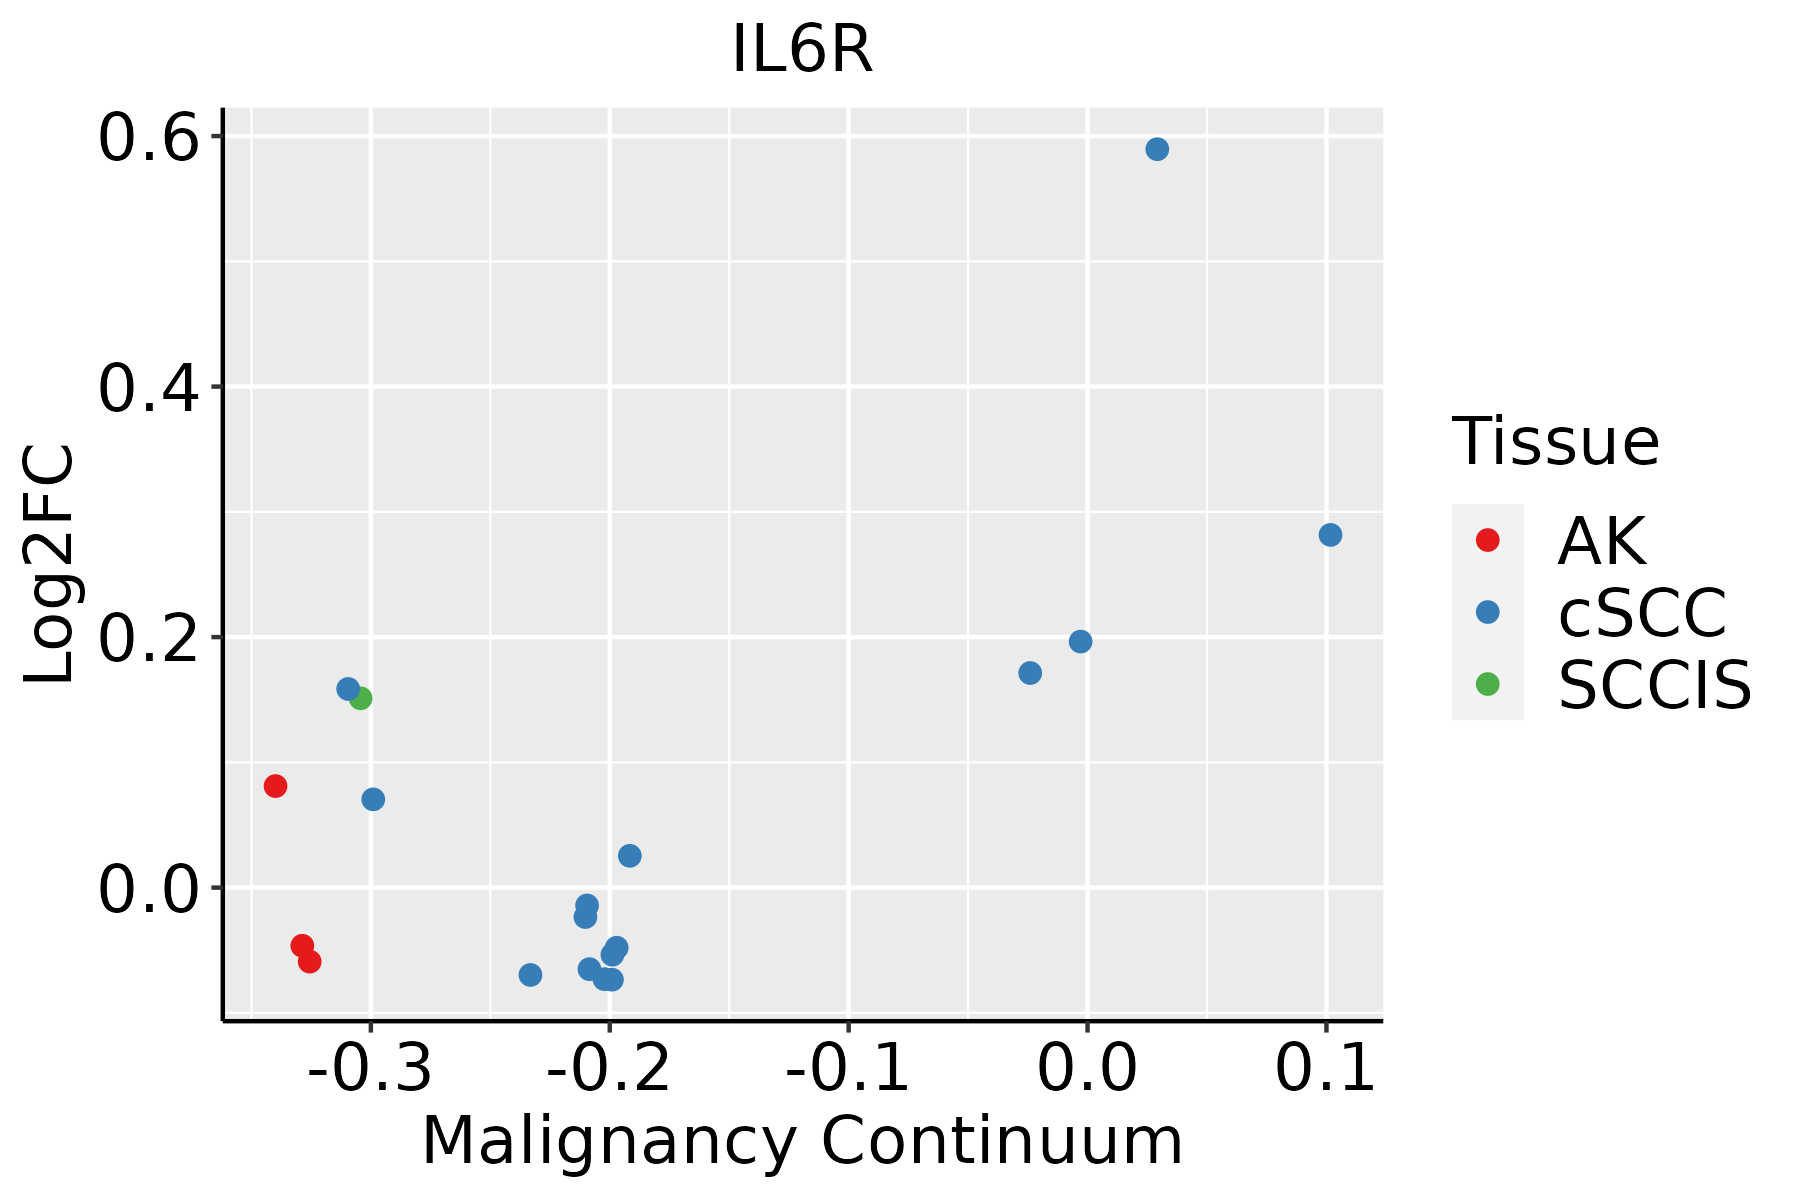 | AK: Actinic keratosis |
| cSCC: Cutaneous squamous cell carcinoma | ||
| SCCIS:squamous cell carcinoma in situ |
| ∗log2FC in expression of this searched gene in stem-like cells from each diseased tissue sample relative to stem-like cells in normal samples in each tissue plotted against the malignancy continuum. Samples are colored based on if they are from different disease stage. |
Top |
Malignant transformation related pathway analysis |
| Find out the enriched GO biological processes and KEGG pathways involved in transition from healthy to precancer to cancer |
| Tissue | Disease Stage | Enriched GO biological Processes |
| Colorectum | AD |  |
| Colorectum | SER |  |
| Colorectum | MSS |  |
| Colorectum | MSI-H |  |
| Colorectum | FAP |  |
| ∗Top 15 enriched GO BP terms are showed in the bar plot of each disease state in each tissue. Each row represents a significant GO biological process which is colored according to the -log10(p.adjust). |
| Page: 1 2 3 4 5 6 7 8 9 |
| GO ID | Tissue | Disease Stage | Description | Gene Ratio | Bg Ratio | pvalue | p.adjust | Count |
| GO:0033674 | Colorectum | AD | positive regulation of kinase activity | 131/3918 | 467/18723 | 1.28e-04 | 1.85e-03 | 131 |
| GO:0097191 | Colorectum | AD | extrinsic apoptotic signaling pathway | 68/3918 | 219/18723 | 2.64e-04 | 3.27e-03 | 68 |
| GO:0001649 | Colorectum | AD | osteoblast differentiation | 70/3918 | 229/18723 | 3.59e-04 | 4.18e-03 | 70 |
| GO:0045860 | Colorectum | AD | positive regulation of protein kinase activity | 107/3918 | 386/18723 | 8.01e-04 | 7.92e-03 | 107 |
| GO:0001503 | Colorectum | AD | ossification | 106/3918 | 408/18723 | 7.68e-03 | 4.64e-02 | 106 |
| GO:00016551 | Colorectum | FAP | urogenital system development | 70/2622 | 338/18723 | 4.26e-04 | 5.11e-03 | 70 |
| GO:00016493 | Colorectum | FAP | osteoblast differentiation | 51/2622 | 229/18723 | 4.40e-04 | 5.22e-03 | 51 |
| GO:0072001 | Colorectum | FAP | renal system development | 63/2622 | 302/18723 | 6.59e-04 | 7.19e-03 | 63 |
| GO:00458604 | Colorectum | FAP | positive regulation of protein kinase activity | 77/2622 | 386/18723 | 7.31e-04 | 7.81e-03 | 77 |
| GO:0001822 | Colorectum | FAP | kidney development | 61/2622 | 293/18723 | 8.38e-04 | 8.72e-03 | 61 |
| GO:00336744 | Colorectum | FAP | positive regulation of kinase activity | 89/2622 | 467/18723 | 1.33e-03 | 1.22e-02 | 89 |
| GO:00015033 | Colorectum | FAP | ossification | 79/2622 | 408/18723 | 1.53e-03 | 1.37e-02 | 79 |
| GO:0032835 | Colorectum | FAP | glomerulus development | 18/2622 | 62/18723 | 1.60e-03 | 1.42e-02 | 18 |
| GO:0072006 | Colorectum | FAP | nephron development | 33/2622 | 142/18723 | 2.02e-03 | 1.68e-02 | 33 |
| GO:1903131 | Colorectum | FAP | mononuclear cell differentiation | 79/2622 | 426/18723 | 5.00e-03 | 3.33e-02 | 79 |
| GO:00486601 | Colorectum | FAP | regulation of smooth muscle cell proliferation | 38/2622 | 180/18723 | 5.73e-03 | 3.67e-02 | 38 |
| GO:00486591 | Colorectum | FAP | smooth muscle cell proliferation | 38/2622 | 184/18723 | 8.29e-03 | 4.85e-02 | 38 |
| GO:00458606 | Liver | NAFLD | positive regulation of protein kinase activity | 65/1882 | 386/18723 | 2.22e-05 | 6.13e-04 | 65 |
| GO:0002526 | Liver | NAFLD | acute inflammatory response | 26/1882 | 112/18723 | 3.68e-05 | 9.23e-04 | 26 |
| GO:00336747 | Liver | NAFLD | positive regulation of kinase activity | 74/1882 | 467/18723 | 5.16e-05 | 1.19e-03 | 74 |
| Page: 1 2 3 |
| Pathway ID | Tissue | Disease Stage | Description | Gene Ratio | Bg Ratio | pvalue | p.adjust | qvalue | Count |
| hsa04932 | Colorectum | AD | Non-alcoholic fatty liver disease | 90/2092 | 155/8465 | 4.83e-19 | 1.80e-17 | 1.15e-17 | 90 |
| hsa05171 | Colorectum | AD | Coronavirus disease - COVID-19 | 113/2092 | 232/8465 | 9.90e-16 | 2.55e-14 | 1.63e-14 | 113 |
| hsa04066 | Colorectum | AD | HIF-1 signaling pathway | 48/2092 | 109/8465 | 7.25e-06 | 7.84e-05 | 5.00e-05 | 48 |
| hsa05163 | Colorectum | AD | Human cytomegalovirus infection | 75/2092 | 225/8465 | 2.00e-03 | 1.10e-02 | 7.01e-03 | 75 |
| hsa01521 | Colorectum | AD | EGFR tyrosine kinase inhibitor resistance | 29/2092 | 79/8465 | 1.15e-02 | 4.24e-02 | 2.71e-02 | 29 |
| hsa049321 | Colorectum | AD | Non-alcoholic fatty liver disease | 90/2092 | 155/8465 | 4.83e-19 | 1.80e-17 | 1.15e-17 | 90 |
| hsa051711 | Colorectum | AD | Coronavirus disease - COVID-19 | 113/2092 | 232/8465 | 9.90e-16 | 2.55e-14 | 1.63e-14 | 113 |
| hsa040661 | Colorectum | AD | HIF-1 signaling pathway | 48/2092 | 109/8465 | 7.25e-06 | 7.84e-05 | 5.00e-05 | 48 |
| hsa051631 | Colorectum | AD | Human cytomegalovirus infection | 75/2092 | 225/8465 | 2.00e-03 | 1.10e-02 | 7.01e-03 | 75 |
| hsa015211 | Colorectum | AD | EGFR tyrosine kinase inhibitor resistance | 29/2092 | 79/8465 | 1.15e-02 | 4.24e-02 | 2.71e-02 | 29 |
| hsa051718 | Colorectum | FAP | Coronavirus disease - COVID-19 | 78/1404 | 232/8465 | 9.94e-11 | 1.11e-08 | 6.73e-09 | 78 |
| hsa049328 | Colorectum | FAP | Non-alcoholic fatty liver disease | 54/1404 | 155/8465 | 1.98e-08 | 6.20e-07 | 3.77e-07 | 54 |
| hsa040666 | Colorectum | FAP | HIF-1 signaling pathway | 38/1404 | 109/8465 | 2.43e-06 | 4.28e-05 | 2.60e-05 | 38 |
| hsa015212 | Colorectum | FAP | EGFR tyrosine kinase inhibitor resistance | 26/1404 | 79/8465 | 2.69e-04 | 2.19e-03 | 1.33e-03 | 26 |
| hsa051636 | Colorectum | FAP | Human cytomegalovirus infection | 55/1404 | 225/8465 | 1.42e-03 | 7.67e-03 | 4.67e-03 | 55 |
| hsa04151 | Colorectum | FAP | PI3K-Akt signaling pathway | 75/1404 | 354/8465 | 1.23e-02 | 4.19e-02 | 2.55e-02 | 75 |
| hsa051719 | Colorectum | FAP | Coronavirus disease - COVID-19 | 78/1404 | 232/8465 | 9.94e-11 | 1.11e-08 | 6.73e-09 | 78 |
| hsa049329 | Colorectum | FAP | Non-alcoholic fatty liver disease | 54/1404 | 155/8465 | 1.98e-08 | 6.20e-07 | 3.77e-07 | 54 |
| hsa040667 | Colorectum | FAP | HIF-1 signaling pathway | 38/1404 | 109/8465 | 2.43e-06 | 4.28e-05 | 2.60e-05 | 38 |
| hsa015213 | Colorectum | FAP | EGFR tyrosine kinase inhibitor resistance | 26/1404 | 79/8465 | 2.69e-04 | 2.19e-03 | 1.33e-03 | 26 |
| Page: 1 2 3 |
Top |
Cell-cell communication analysis |
| Identification of potential cell-cell interactions between two cell types and their ligand-receptor pairs for different disease states |
| Ligand | Receptor | LRpair | Pathway | Tissue | Disease Stage |
| IL6 | IL6R_IL6ST | IL6_IL6R_IL6ST | IL6 | Breast | Healthy |
| IL6 | IL6R_IL6ST | IL6_IL6R_IL6ST | IL6 | Cervix | ADJ |
| IL6 | IL6R_IL6ST | IL6_IL6R_IL6ST | IL6 | Cervix | CC |
| IL6 | IL6R_IL6ST | IL6_IL6R_IL6ST | IL6 | Endometrium | EEC |
| IL6 | IL6R_IL6ST | IL6_IL6R_IL6ST | IL6 | HNSCC | OSCC |
| IL6 | IL6R_IL6ST | IL6_IL6R_IL6ST | IL6 | HNSCC | Precancer |
| IL6 | IL6R_IL6ST | IL6_IL6R_IL6ST | IL6 | Prostate | BPH |
| IL6 | IL6R_IL6ST | IL6_IL6R_IL6ST | IL6 | Prostate | Healthy |
| IL6 | IL6R_IL6ST | IL6_IL6R_IL6ST | IL6 | Prostate | Tumor |
| IL6 | IL6R_IL6ST | IL6_IL6R_IL6ST | IL6 | Skin | ADJ |
| IL6 | IL6R_IL6ST | IL6_IL6R_IL6ST | IL6 | Skin | AK |
| IL6 | IL6R_IL6ST | IL6_IL6R_IL6ST | IL6 | Skin | cSCC |
| IL6 | IL6R_IL6ST | IL6_IL6R_IL6ST | IL6 | THCA | Cancer |
| Page: 1 |
Top |
Single-cell gene regulatory network inference analysis |
| Find out the significant the regulons (TFs) and the target genes of each regulon across cell types for different disease states |
| TF | Cell Type | Tissue | Disease Stage | Target Gene | RSS | Regulon Activity |
| ∗The dot plots of a searched regulon are shown for all cell subpopulations in each disease state of each tissue based on the regulon specific score inferred using pySCENIC and by calculating the average expression. |
| Page: 1 |
Top |
Somatic mutation of malignant transformation related genes |
| Annotation of somatic variants for genes involved in malignant transformation |
| Hugo Symbol | Variant Class | Variant Classification | dbSNP RS | HGVSc | HGVSp | HGVSp Short | SWISSPROT | BIOTYPE | SIFT | PolyPhen | Tumor Sample Barcode | Tissue | Histology | Sex | Age | Stage | Therapy Types | Drugs | Outcome |
| IL6R | SNV | Missense_Mutation | c.1374N>G | p.Asp458Glu | p.D458E | P08887 | protein_coding | deleterious(0.04) | probably_damaging(0.997) | TCGA-AN-A0AT-01 | Breast | breast invasive carcinoma | Female | <65 | I/II | Unknown | Unknown | SD | |
| IL6R | deletion | Frame_Shift_Del | rs770415570 | c.148delG | p.Val50Ter | p.V50* | P08887 | protein_coding | TCGA-BH-A18G-01 | Breast | breast invasive carcinoma | Female | >=65 | I/II | Unknown | Unknown | SD | ||
| IL6R | SNV | Missense_Mutation | c.572C>G | p.Ser191Cys | p.S191C | P08887 | protein_coding | deleterious(0) | possibly_damaging(0.883) | TCGA-IR-A3LK-01 | Cervix | cervical & endocervical cancer | Female | >=65 | I/II | Chemotherapy | cisplatin | PD | |
| IL6R | SNV | Missense_Mutation | novel | c.435G>T | p.Lys145Asn | p.K145N | P08887 | protein_coding | deleterious(0.01) | benign(0.116) | TCGA-MA-AA42-01 | Cervix | cervical & endocervical cancer | Female | >=65 | I/II | Unknown | Unknown | SD |
| IL6R | SNV | Missense_Mutation | rs868345266 | c.92N>T | p.Ala31Val | p.A31V | P08887 | protein_coding | tolerated(0.17) | benign(0) | TCGA-A6-A565-01 | Colorectum | colon adenocarcinoma | Female | <65 | III/IV | Unspecific | 5FU | PD |
| IL6R | SNV | Missense_Mutation | rs747599074 | c.1018G>A | p.Asp340Asn | p.D340N | P08887 | protein_coding | tolerated(0.59) | benign(0) | TCGA-AA-3510-01 | Colorectum | colon adenocarcinoma | Male | >=65 | I/II | Unknown | Unknown | SD |
| IL6R | SNV | Missense_Mutation | c.1186N>A | p.Ala396Thr | p.A396T | P08887 | protein_coding | tolerated(0.2) | benign(0.284) | TCGA-AA-3715-01 | Colorectum | colon adenocarcinoma | Male | >=65 | I/II | Unknown | Unknown | PD | |
| IL6R | SNV | Missense_Mutation | c.841G>A | p.Asp281Asn | p.D281N | P08887 | protein_coding | deleterious(0.01) | probably_damaging(0.989) | TCGA-AA-3864-01 | Colorectum | colon adenocarcinoma | Male | >=65 | I/II | Unknown | Unknown | SD | |
| IL6R | SNV | Missense_Mutation | c.596N>A | p.Gly199Glu | p.G199E | P08887 | protein_coding | deleterious(0) | probably_damaging(0.988) | TCGA-AD-6895-01 | Colorectum | colon adenocarcinoma | Male | >=65 | III/IV | Unknown | Unknown | SD | |
| IL6R | SNV | Missense_Mutation | c.1336A>C | p.Asn446His | p.N446H | P08887 | protein_coding | deleterious(0.01) | benign(0.365) | TCGA-DM-A1HB-01 | Colorectum | colon adenocarcinoma | Male | >=65 | III/IV | Unknown | Unknown | SD |
| Page: 1 2 3 4 5 |
Top |
Related drugs of malignant transformation related genes |
| Identification of chemicals and drugs interact with genes involved in malignant transfromation |
| (DGIdb 4.0) |
| Entrez ID | Symbol | Category | Interaction Types | Drug Claim Name | Drug Name | PMIDs |
| 3570 | IL6R | EXTERNAL SIDE OF PLASMA MEMBRANE, CLINICALLY ACTIONABLE, DRUGGABLE GENOME | ALX-0061 | VOBARILIZUMAB | ||
| 3570 | IL6R | EXTERNAL SIDE OF PLASMA MEMBRANE, CLINICALLY ACTIONABLE, DRUGGABLE GENOME | inhibitor | CHEMBL1237022 | TOCILIZUMAB | |
| 3570 | IL6R | EXTERNAL SIDE OF PLASMA MEMBRANE, CLINICALLY ACTIONABLE, DRUGGABLE GENOME | TOCILIZUMAB | TOCILIZUMAB | ||
| 3570 | IL6R | EXTERNAL SIDE OF PLASMA MEMBRANE, CLINICALLY ACTIONABLE, DRUGGABLE GENOME | SAR153191 | |||
| 3570 | IL6R | EXTERNAL SIDE OF PLASMA MEMBRANE, CLINICALLY ACTIONABLE, DRUGGABLE GENOME | Sirukumab | SIRUKUMAB | ||
| 3570 | IL6R | EXTERNAL SIDE OF PLASMA MEMBRANE, CLINICALLY ACTIONABLE, DRUGGABLE GENOME | ALC-0061 | |||
| 3570 | IL6R | EXTERNAL SIDE OF PLASMA MEMBRANE, CLINICALLY ACTIONABLE, DRUGGABLE GENOME | THALIDOMIDE | THALIDOMIDE | 12515619 | |
| 3570 | IL6R | EXTERNAL SIDE OF PLASMA MEMBRANE, CLINICALLY ACTIONABLE, DRUGGABLE GENOME | antibody | 249565679 | SARILUMAB | |
| 3570 | IL6R | EXTERNAL SIDE OF PLASMA MEMBRANE, CLINICALLY ACTIONABLE, DRUGGABLE GENOME | agonist | 178101695 | ||
| 3570 | IL6R | EXTERNAL SIDE OF PLASMA MEMBRANE, CLINICALLY ACTIONABLE, DRUGGABLE GENOME | PROTEASOME INHIBITOR | 18298552 |
| Page: 1 2 3 |

Copyright 2023-Present -The University of Texas Health Science Center at Houston |