
|
|||||
|
 | |
| |
| |
| |
| |
| |
|
Gene: IL6 |
Gene summary for IL6 |
| Gene information | Species | Human | Gene symbol | IL6 | Gene ID | 3569 |
| Gene name | interleukin 6 | |
| Gene Alias | BSF-2 | |
| Cytomap | 7p15.3 | |
| Gene Type | protein-coding | GO ID | GO:0000165 | UniProtAcc | B4DVM1 |
Top |
Malignant transformation analysis |
| Identification of the aberrant gene expression in precancerous and cancerous lesions by comparing the gene expression of stem-like cells in diseased tissues with normal stem cells |
| Entrez ID | Symbol | Replicates | Species | Organ | Tissue | Adj P-value | Log2FC | Malignancy |
| 3569 | IL6 | ctrl6 | Human | Breast | Precancer | 2.12e-25 | 7.67e-01 | -0.0061 |
| 3569 | IL6 | brca7 | Human | Breast | Precancer | 4.03e-03 | 5.28e-01 | -0.009 |
| 3569 | IL6 | P9T-E | Human | Esophagus | ESCC | 1.31e-12 | 1.87e+00 | 0.1131 |
| 3569 | IL6 | P15T-E | Human | Esophagus | ESCC | 2.73e-02 | -9.11e-02 | 0.1149 |
| 3569 | IL6 | P49T-E | Human | Esophagus | ESCC | 2.67e-09 | 3.45e+00 | 0.1768 |
| 3569 | IL6 | C30 | Human | Oral cavity | OSCC | 3.25e-03 | 2.71e-01 | 0.3055 |
| 3569 | IL6 | C43 | Human | Oral cavity | OSCC | 7.70e-05 | -4.73e-01 | 0.1704 |
| 3569 | IL6 | C46 | Human | Oral cavity | OSCC | 2.38e-04 | -4.78e-01 | 0.1673 |
| 3569 | IL6 | C57 | Human | Oral cavity | OSCC | 2.92e-04 | -5.21e-01 | 0.1679 |
| 3569 | IL6 | C09 | Human | Oral cavity | OSCC | 1.71e-59 | 4.41e+00 | 0.1431 |
| 3569 | IL6 | LN46 | Human | Oral cavity | OSCC | 1.02e-02 | -2.10e-02 | 0.1666 |
| 3569 | IL6 | SYSMH1 | Human | Oral cavity | OSCC | 6.89e-14 | -5.44e-01 | 0.1127 |
| 3569 | IL6 | SYSMH2 | Human | Oral cavity | OSCC | 2.94e-09 | -5.13e-01 | 0.2326 |
| 3569 | IL6 | SYSMH3 | Human | Oral cavity | OSCC | 6.81e-13 | -5.34e-01 | 0.2442 |
| 3569 | IL6 | SYSMH4 | Human | Oral cavity | OSCC | 3.41e-13 | -5.46e-01 | 0.1226 |
| 3569 | IL6 | SYSMH5 | Human | Oral cavity | OSCC | 1.50e-12 | -5.45e-01 | 0.0647 |
| 3569 | IL6 | SYSMH6 | Human | Oral cavity | OSCC | 2.54e-12 | -4.84e-01 | 0.1275 |
| 3569 | IL6 | ATC09 | Human | Thyroid | ATC | 7.55e-05 | 6.18e-01 | 0.2871 |
| 3569 | IL6 | ATC1 | Human | Thyroid | ATC | 5.81e-03 | 5.73e-01 | 0.2878 |
| Page: 1 |
| Tissue | Expression Dynamics | Abbreviation |
| Breast |  | IDC: Invasive ductal carcinoma |
| DCIS: Ductal carcinoma in situ | ||
| Precancer(BRCA1-mut): Precancerous lesion from BRCA1 mutation carriers | ||
| Esophagus |  | ESCC: Esophageal squamous cell carcinoma |
| HGIN: High-grade intraepithelial neoplasias | ||
| LGIN: Low-grade intraepithelial neoplasias | ||
| Oral Cavity |  | EOLP: Erosive Oral lichen planus |
| LP: leukoplakia | ||
| NEOLP: Non-erosive oral lichen planus | ||
| OSCC: Oral squamous cell carcinoma | ||
| Thyroid | 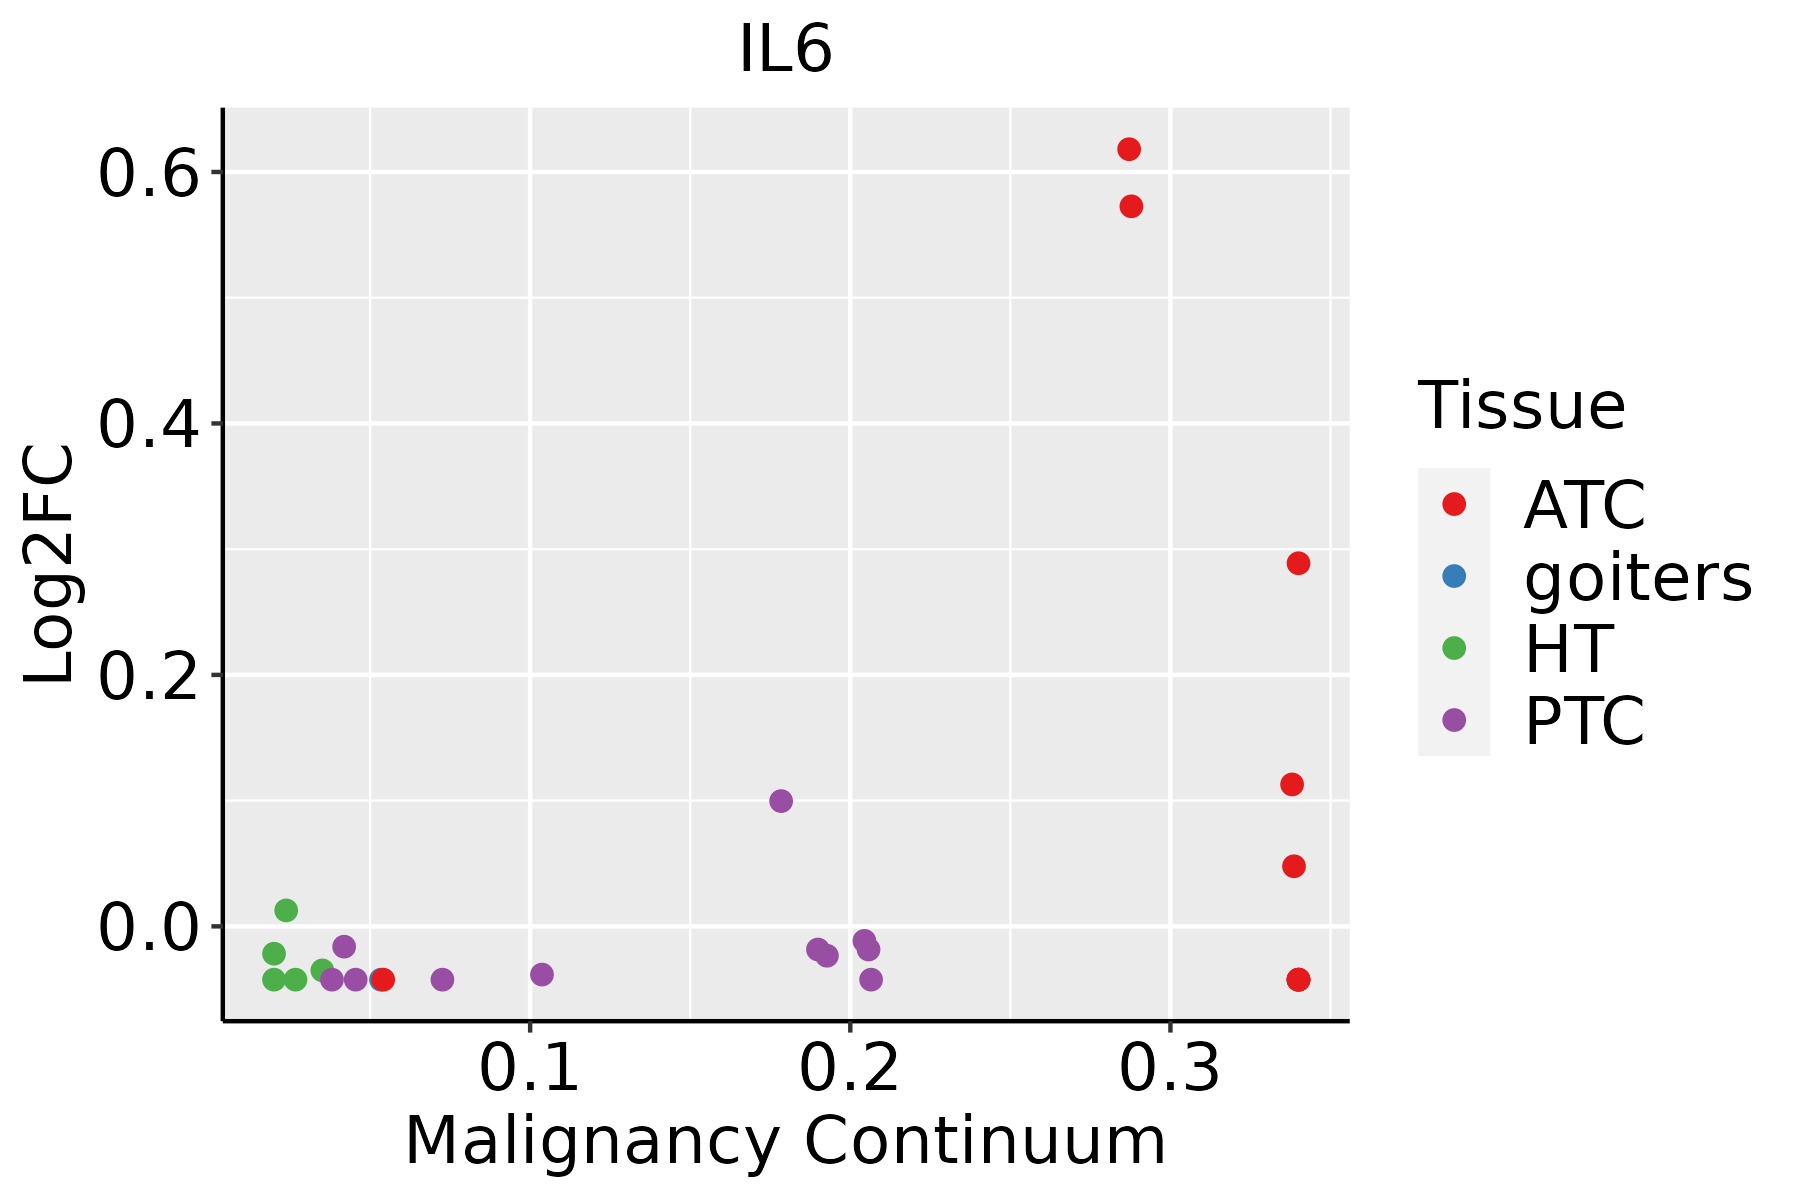 | ATC: Anaplastic thyroid cancer |
| HT: Hashimoto's thyroiditis | ||
| PTC: Papillary thyroid cancer |
| ∗log2FC in expression of this searched gene in stem-like cells from each diseased tissue sample relative to stem-like cells in normal samples in each tissue plotted against the malignancy continuum. Samples are colored based on if they are from different disease stage. |
Top |
Malignant transformation related pathway analysis |
| Find out the enriched GO biological processes and KEGG pathways involved in transition from healthy to precancer to cancer |
| Tissue | Disease Stage | Enriched GO biological Processes |
| Colorectum | AD |  |
| Colorectum | SER |  |
| Colorectum | MSS |  |
| Colorectum | MSI-H |  |
| Colorectum | FAP |  |
| ∗Top 15 enriched GO BP terms are showed in the bar plot of each disease state in each tissue. Each row represents a significant GO biological process which is colored according to the -log10(p.adjust). |
| Page: 1 2 3 4 5 6 7 8 9 |
| GO ID | Tissue | Disease Stage | Description | Gene Ratio | Bg Ratio | pvalue | p.adjust | Count |
| GO:00060918 | Breast | Precancer | generation of precursor metabolites and energy | 94/1080 | 490/18723 | 1.54e-25 | 1.64e-22 | 94 |
| GO:00159808 | Breast | Precancer | energy derivation by oxidation of organic compounds | 70/1080 | 318/18723 | 8.33e-23 | 6.37e-20 | 70 |
| GO:00069799 | Breast | Precancer | response to oxidative stress | 70/1080 | 446/18723 | 1.59e-14 | 4.26e-12 | 70 |
| GO:00064179 | Breast | Precancer | regulation of translation | 67/1080 | 468/18723 | 4.71e-12 | 7.64e-10 | 67 |
| GO:00457279 | Breast | Precancer | positive regulation of translation | 32/1080 | 136/18723 | 5.89e-12 | 9.27e-10 | 32 |
| GO:00485459 | Breast | Precancer | response to steroid hormone | 53/1080 | 339/18723 | 3.07e-11 | 3.66e-09 | 53 |
| GO:00342509 | Breast | Precancer | positive regulation of cellular amide metabolic process | 33/1080 | 162/18723 | 1.72e-10 | 1.77e-08 | 33 |
| GO:00621979 | Breast | Precancer | cellular response to chemical stress | 51/1080 | 337/18723 | 2.40e-10 | 2.34e-08 | 51 |
| GO:00003029 | Breast | Precancer | response to reactive oxygen species | 38/1080 | 222/18723 | 1.47e-09 | 1.23e-07 | 38 |
| GO:00319608 | Breast | Precancer | response to corticosteroid | 30/1080 | 167/18723 | 2.50e-08 | 1.65e-06 | 30 |
| GO:00345999 | Breast | Precancer | cellular response to oxidative stress | 42/1080 | 288/18723 | 2.78e-08 | 1.79e-06 | 42 |
| GO:00975297 | Breast | Precancer | myeloid leukocyte migration | 34/1080 | 220/18723 | 1.42e-07 | 7.82e-06 | 34 |
| GO:00425429 | Breast | Precancer | response to hydrogen peroxide | 26/1080 | 146/18723 | 2.52e-07 | 1.26e-05 | 26 |
| GO:00509006 | Breast | Precancer | leukocyte migration | 47/1080 | 369/18723 | 2.82e-07 | 1.39e-05 | 47 |
| GO:00022629 | Breast | Precancer | myeloid cell homeostasis | 27/1080 | 157/18723 | 3.10e-07 | 1.49e-05 | 27 |
| GO:00513848 | Breast | Precancer | response to glucocorticoid | 26/1080 | 148/18723 | 3.32e-07 | 1.57e-05 | 26 |
| GO:00305956 | Breast | Precancer | leukocyte chemotaxis | 34/1080 | 230/18723 | 4.16e-07 | 1.89e-05 | 34 |
| GO:00457859 | Breast | Precancer | positive regulation of cell adhesion | 52/1080 | 437/18723 | 5.74e-07 | 2.49e-05 | 52 |
| GO:00603266 | Breast | Precancer | cell chemotaxis | 41/1080 | 310/18723 | 5.99e-07 | 2.55e-05 | 41 |
| GO:00341099 | Breast | Precancer | homotypic cell-cell adhesion | 18/1080 | 90/18723 | 3.15e-06 | 1.03e-04 | 18 |
| Page: 1 2 3 4 5 6 7 8 9 10 11 12 13 14 15 16 17 18 19 20 21 22 23 24 25 26 27 28 29 30 31 32 33 34 35 36 37 38 39 40 41 42 43 44 45 46 47 48 49 50 51 52 53 54 55 |
| Pathway ID | Tissue | Disease Stage | Description | Gene Ratio | Bg Ratio | pvalue | p.adjust | qvalue | Count |
| hsa0502016 | Breast | Precancer | Prion disease | 95/684 | 273/8465 | 1.39e-37 | 1.46e-35 | 1.12e-35 | 95 |
| hsa0517118 | Breast | Precancer | Coronavirus disease - COVID-19 | 81/684 | 232/8465 | 3.74e-32 | 2.36e-30 | 1.81e-30 | 81 |
| hsa0501016 | Breast | Precancer | Alzheimer disease | 103/684 | 384/8465 | 1.03e-29 | 4.66e-28 | 3.57e-28 | 103 |
| hsa0502216 | Breast | Precancer | Pathways of neurodegeneration - multiple diseases | 112/684 | 476/8465 | 6.96e-27 | 2.44e-25 | 1.87e-25 | 112 |
| hsa0493216 | Breast | Precancer | Non-alcoholic fatty liver disease | 48/684 | 155/8465 | 6.16e-17 | 1.50e-15 | 1.15e-15 | 48 |
| hsa0513218 | Breast | Precancer | Salmonella infection | 49/684 | 249/8465 | 2.92e-09 | 6.15e-08 | 4.71e-08 | 49 |
| hsa0513414 | Breast | Precancer | Legionellosis | 19/684 | 57/8465 | 4.62e-08 | 9.12e-07 | 6.98e-07 | 19 |
| hsa0513018 | Breast | Precancer | Pathogenic Escherichia coli infection | 38/684 | 197/8465 | 3.12e-07 | 5.81e-06 | 4.45e-06 | 38 |
| hsa0516718 | Breast | Precancer | Kaposi sarcoma-associated herpesvirus infection | 36/684 | 194/8465 | 1.68e-06 | 2.53e-05 | 1.94e-05 | 36 |
| hsa0541718 | Breast | Precancer | Lipid and atherosclerosis | 37/684 | 215/8465 | 7.64e-06 | 9.29e-05 | 7.12e-05 | 37 |
| hsa0516918 | Breast | Precancer | Epstein-Barr virus infection | 35/684 | 202/8465 | 1.15e-05 | 1.26e-04 | 9.64e-05 | 35 |
| hsa0406616 | Breast | Precancer | HIF-1 signaling pathway | 23/684 | 109/8465 | 1.51e-05 | 1.59e-04 | 1.22e-04 | 23 |
| hsa042189 | Breast | Precancer | Cellular senescence | 29/684 | 156/8465 | 1.66e-05 | 1.69e-04 | 1.30e-04 | 29 |
| hsa0465716 | Breast | Precancer | IL-17 signaling pathway | 20/684 | 94/8465 | 4.74e-05 | 4.54e-04 | 3.48e-04 | 20 |
| hsa0532312 | Breast | Precancer | Rheumatoid arthritis | 19/684 | 93/8465 | 1.30e-04 | 1.14e-03 | 8.73e-04 | 19 |
| hsa0516618 | Breast | Precancer | Human T-cell leukemia virus 1 infection | 33/684 | 222/8465 | 4.29e-04 | 3.31e-03 | 2.53e-03 | 33 |
| hsa0516316 | Breast | Precancer | Human cytomegalovirus infection | 32/684 | 225/8465 | 1.13e-03 | 7.57e-03 | 5.80e-03 | 32 |
| hsa0502017 | Breast | Precancer | Prion disease | 95/684 | 273/8465 | 1.39e-37 | 1.46e-35 | 1.12e-35 | 95 |
| hsa0517119 | Breast | Precancer | Coronavirus disease - COVID-19 | 81/684 | 232/8465 | 3.74e-32 | 2.36e-30 | 1.81e-30 | 81 |
| hsa0501017 | Breast | Precancer | Alzheimer disease | 103/684 | 384/8465 | 1.03e-29 | 4.66e-28 | 3.57e-28 | 103 |
| Page: 1 2 3 4 5 6 7 |
Top |
Cell-cell communication analysis |
| Identification of potential cell-cell interactions between two cell types and their ligand-receptor pairs for different disease states |
| Ligand | Receptor | LRpair | Pathway | Tissue | Disease Stage |
| OSM | LIFR_IL6ST | OSM_LIFR_IL6ST | OSM | Breast | DCIS |
| OSM | OSMR_IL6ST | OSM_OSMR_IL6ST | OSM | Breast | DCIS |
| IL6 | IL6R_IL6ST | IL6_IL6R_IL6ST | IL6 | Breast | Healthy |
| LIF | LIFR_IL6ST | LIF_LIFR_IL6ST | LIFR | Breast | Healthy |
| OSM | LIFR_IL6ST | OSM_LIFR_IL6ST | OSM | Breast | Healthy |
| OSM | OSMR_IL6ST | OSM_OSMR_IL6ST | OSM | Breast | Healthy |
| LIF | LIFR_IL6ST | LIF_LIFR_IL6ST | LIFR | Cervix | ADJ |
| IL6 | IL6R_IL6ST | IL6_IL6R_IL6ST | IL6 | Cervix | ADJ |
| OSM | LIFR_IL6ST | OSM_LIFR_IL6ST | OSM | Cervix | CC |
| OSM | OSMR_IL6ST | OSM_OSMR_IL6ST | OSM | Cervix | CC |
| IL6 | IL6R_IL6ST | IL6_IL6R_IL6ST | IL6 | Cervix | CC |
| LIF | LIFR_IL6ST | LIF_LIFR_IL6ST | LIFR | Cervix | CC |
| OSM | OSMR_IL6ST | OSM_OSMR_IL6ST | OSM | Cervix | Healthy |
| OSM | LIFR_IL6ST | OSM_LIFR_IL6ST | OSM | Cervix | Precancer |
| OSM | OSMR_IL6ST | OSM_OSMR_IL6ST | OSM | Cervix | Precancer |
| LIF | LIFR_IL6ST | LIF_LIFR_IL6ST | LIFR | Endometrium | ADJ |
| OSM | LIFR_IL6ST | OSM_LIFR_IL6ST | OSM | Endometrium | ADJ |
| OSM | OSMR_IL6ST | OSM_OSMR_IL6ST | OSM | Endometrium | ADJ |
| LIF | LIFR_IL6ST | LIF_LIFR_IL6ST | LIFR | Endometrium | AEH |
| OSM | LIFR_IL6ST | OSM_LIFR_IL6ST | OSM | Endometrium | AEH |
| Page: 1 |
Top |
Single-cell gene regulatory network inference analysis |
| Find out the significant the regulons (TFs) and the target genes of each regulon across cell types for different disease states |
| TF | Cell Type | Tissue | Disease Stage | Target Gene | RSS | Regulon Activity |
| ∗The dot plots of a searched regulon are shown for all cell subpopulations in each disease state of each tissue based on the regulon specific score inferred using pySCENIC and by calculating the average expression. |
| Page: 1 |
Top |
Somatic mutation of malignant transformation related genes |
| Annotation of somatic variants for genes involved in malignant transformation |
| Hugo Symbol | Variant Class | Variant Classification | dbSNP RS | HGVSc | HGVSp | HGVSp Short | SWISSPROT | BIOTYPE | SIFT | PolyPhen | Tumor Sample Barcode | Tissue | Histology | Sex | Age | Stage | Therapy Types | Drugs | Outcome |
| IL6 | SNV | Missense_Mutation | c.146C>G | p.Ser49Cys | p.S49C | P05231 | protein_coding | deleterious(0.01) | possibly_damaging(0.838) | TCGA-A2-A0CL-01 | Breast | breast invasive carcinoma | Female | <65 | III/IV | Chemotherapy | cytoxan | SD | |
| IL6 | SNV | Missense_Mutation | novel | c.133N>A | p.Gln45Lys | p.Q45K | P05231 | protein_coding | tolerated(1) | benign(0.033) | TCGA-A2-A4S1-01 | Breast | breast invasive carcinoma | Female | >=65 | I/II | Unknown | Unknown | SD |
| IL6 | SNV | Missense_Mutation | c.184N>A | p.Asp62Asn | p.D62N | P05231 | protein_coding | tolerated(0.48) | benign(0.036) | TCGA-A6-5661-01 | Colorectum | colon adenocarcinoma | Female | >=65 | I/II | Unknown | Unknown | SD | |
| IL6 | SNV | Missense_Mutation | c.395G>T | p.Arg132Ile | p.R132I | P05231 | protein_coding | deleterious(0.05) | benign(0.223) | TCGA-AA-3977-01 | Colorectum | colon adenocarcinoma | Male | >=65 | I/II | Unknown | Unknown | SD | |
| IL6 | SNV | Missense_Mutation | rs775325818 | c.230N>C | p.Met77Thr | p.M77T | P05231 | protein_coding | tolerated(0.27) | benign(0.238) | TCGA-CK-5913-01 | Colorectum | colon adenocarcinoma | Female | <65 | I/II | Unknown | Unknown | SD |
| IL6 | SNV | Missense_Mutation | c.629N>A | p.Arg210Gln | p.R210Q | P05231 | protein_coding | deleterious(0.01) | probably_damaging(0.966) | TCGA-DM-A1HA-01 | Colorectum | colon adenocarcinoma | Male | >=65 | III/IV | Unknown | Unknown | SD | |
| IL6 | SNV | Missense_Mutation | c.172N>T | p.Arg58Trp | p.R58W | P05231 | protein_coding | deleterious(0.04) | benign(0.007) | TCGA-F4-6704-01 | Colorectum | colon adenocarcinoma | Male | <65 | III/IV | Unknown | Unknown | SD | |
| IL6 | SNV | Missense_Mutation | c.173N>A | p.Arg58Gln | p.R58Q | P05231 | protein_coding | tolerated(0.21) | benign(0.089) | TCGA-AF-6136-01 | Colorectum | rectum adenocarcinoma | Female | >=65 | III/IV | Chemotherapy | 5-fluorouracil | PD | |
| IL6 | SNV | Missense_Mutation | c.184G>A | p.Asp62Asn | p.D62N | P05231 | protein_coding | tolerated(0.48) | benign(0.036) | TCGA-AG-A002-01 | Colorectum | rectum adenocarcinoma | Male | <65 | I/II | Unknown | Unknown | SD | |
| IL6 | SNV | Missense_Mutation | novel | c.271A>C | p.Asn91His | p.N91H | P05231 | protein_coding | tolerated(0.17) | benign(0.082) | TCGA-F5-6814-01 | Colorectum | rectum adenocarcinoma | Male | <65 | I/II | Unknown | Unknown | SD |
| Page: 1 2 3 |
Top |
Related drugs of malignant transformation related genes |
| Identification of chemicals and drugs interact with genes involved in malignant transfromation |
| (DGIdb 4.0) |
| Entrez ID | Symbol | Category | Interaction Types | Drug Claim Name | Drug Name | PMIDs |
| 3569 | IL6 | DRUG RESISTANCE, DRUGGABLE GENOME, GROWTH FACTOR | Tumor necrosis factor alpha (TNF-alpha) inhibitors | 24776844,22158445 | ||
| 3569 | IL6 | DRUG RESISTANCE, DRUGGABLE GENOME, GROWTH FACTOR | Sirukumab | SIRUKUMAB | ||
| 3569 | IL6 | DRUG RESISTANCE, DRUGGABLE GENOME, GROWTH FACTOR | rituximab | RITUXIMAB | 26384320 | |
| 3569 | IL6 | DRUG RESISTANCE, DRUGGABLE GENOME, GROWTH FACTOR | METRONIDAZOLE | METRONIDAZOLE | 12111578 | |
| 3569 | IL6 | DRUG RESISTANCE, DRUGGABLE GENOME, GROWTH FACTOR | ARSENIC TRIOXIDE | 16638192 | ||
| 3569 | IL6 | DRUG RESISTANCE, DRUGGABLE GENOME, GROWTH FACTOR | SELENIUM | 16036356 | ||
| 3569 | IL6 | DRUG RESISTANCE, DRUGGABLE GENOME, GROWTH FACTOR | RECOMBINANT HUMAN IL-4 | 11228246 | ||
| 3569 | IL6 | DRUG RESISTANCE, DRUGGABLE GENOME, GROWTH FACTOR | IFOSFAMIDE | IFOSFAMIDE | 9260581 | |
| 3569 | IL6 | DRUG RESISTANCE, DRUGGABLE GENOME, GROWTH FACTOR | ECHINACEA | ECHINACEA, UNSPECIFIED | 9568541 | |
| 3569 | IL6 | DRUG RESISTANCE, DRUGGABLE GENOME, GROWTH FACTOR | YSIL6 |
| Page: 1 2 3 4 5 6 |

Copyright 2023-Present -The University of Texas Health Science Center at Houston |