
|
|||||
|
 | |
| |
| |
| |
| |
| |
|
Gene: IL36G |
Gene summary for IL36G |
| Gene information | Species | Human | Gene symbol | IL36G | Gene ID | 56300 |
| Gene name | interleukin 36 gamma | |
| Gene Alias | IL-1F9 | |
| Cytomap | 2q14.1 | |
| Gene Type | protein-coding | GO ID | GO:0002237 | UniProtAcc | Q9NZH8 |
Top |
Malignant transformation analysis |
| Identification of the aberrant gene expression in precancerous and cancerous lesions by comparing the gene expression of stem-like cells in diseased tissues with normal stem cells |
| Entrez ID | Symbol | Replicates | Species | Organ | Tissue | Adj P-value | Log2FC | Malignancy |
| 56300 | IL36G | P1T-E | Human | Esophagus | ESCC | 4.78e-05 | 1.20e+00 | 0.0875 |
| 56300 | IL36G | P5T-E | Human | Esophagus | ESCC | 3.60e-13 | 5.64e-01 | 0.1327 |
| 56300 | IL36G | P21T-E | Human | Esophagus | ESCC | 9.67e-18 | 7.44e-01 | 0.1617 |
| 56300 | IL36G | P23T-E | Human | Esophagus | ESCC | 1.01e-12 | 8.67e-01 | 0.108 |
| 56300 | IL36G | P24T-E | Human | Esophagus | ESCC | 8.40e-04 | 2.62e-01 | 0.1287 |
| 56300 | IL36G | P31T-E | Human | Esophagus | ESCC | 8.84e-05 | 3.02e-01 | 0.1251 |
| 56300 | IL36G | P42T-E | Human | Esophagus | ESCC | 3.42e-04 | 3.57e-01 | 0.1175 |
| 56300 | IL36G | P47T-E | Human | Esophagus | ESCC | 2.02e-06 | 2.31e-01 | 0.1067 |
| 56300 | IL36G | P49T-E | Human | Esophagus | ESCC | 2.45e-07 | 1.97e+00 | 0.1768 |
| 56300 | IL36G | P52T-E | Human | Esophagus | ESCC | 1.66e-02 | 2.20e-01 | 0.1555 |
| 56300 | IL36G | P54T-E | Human | Esophagus | ESCC | 2.73e-06 | 5.70e-01 | 0.0975 |
| 56300 | IL36G | P83T-E | Human | Esophagus | ESCC | 3.81e-19 | 1.41e+00 | 0.1738 |
| 56300 | IL36G | P84T-E | Human | Esophagus | ESCC | 1.15e-02 | 1.14e+00 | 0.0933 |
| 56300 | IL36G | P107T-E | Human | Esophagus | ESCC | 7.53e-10 | 1.10e+00 | 0.171 |
| 56300 | IL36G | C04 | Human | Oral cavity | OSCC | 4.60e-13 | 3.05e+00 | 0.2633 |
| 56300 | IL36G | C57 | Human | Oral cavity | OSCC | 8.25e-34 | 2.49e+00 | 0.1679 |
| 56300 | IL36G | EOLP-1 | Human | Oral cavity | EOLP | 7.87e-03 | -1.63e-01 | -0.0202 |
| 56300 | IL36G | EOLP-2 | Human | Oral cavity | EOLP | 7.87e-03 | -1.62e-01 | -0.0203 |
| 56300 | IL36G | NEOLP-2 | Human | Oral cavity | NEOLP | 3.73e-03 | -1.63e-01 | -0.0196 |
| 56300 | IL36G | NEOLP-3 | Human | Oral cavity | NEOLP | 1.77e-03 | -1.59e-01 | -0.0191 |
| Page: 1 2 |
| Tissue | Expression Dynamics | Abbreviation |
| Esophagus | 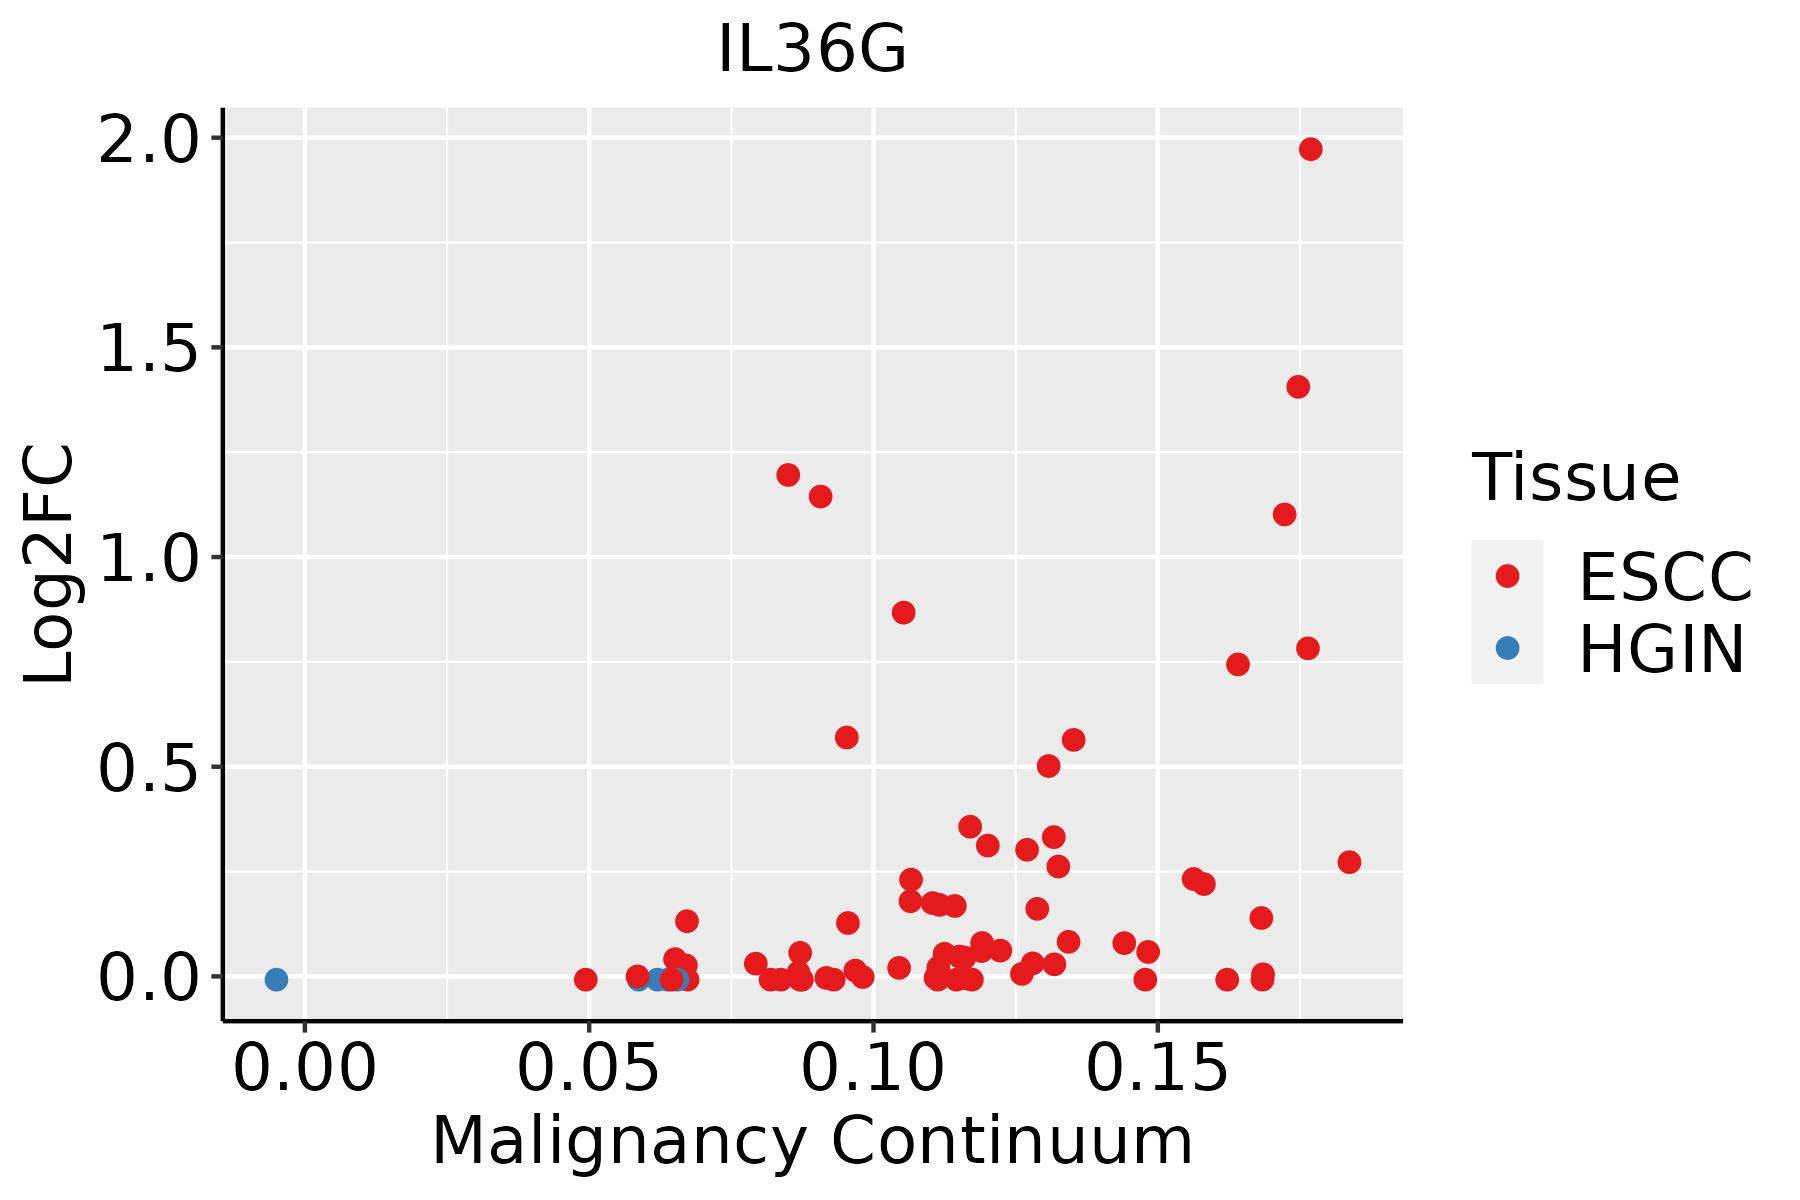 | ESCC: Esophageal squamous cell carcinoma |
| HGIN: High-grade intraepithelial neoplasias | ||
| LGIN: Low-grade intraepithelial neoplasias | ||
| Oral Cavity | 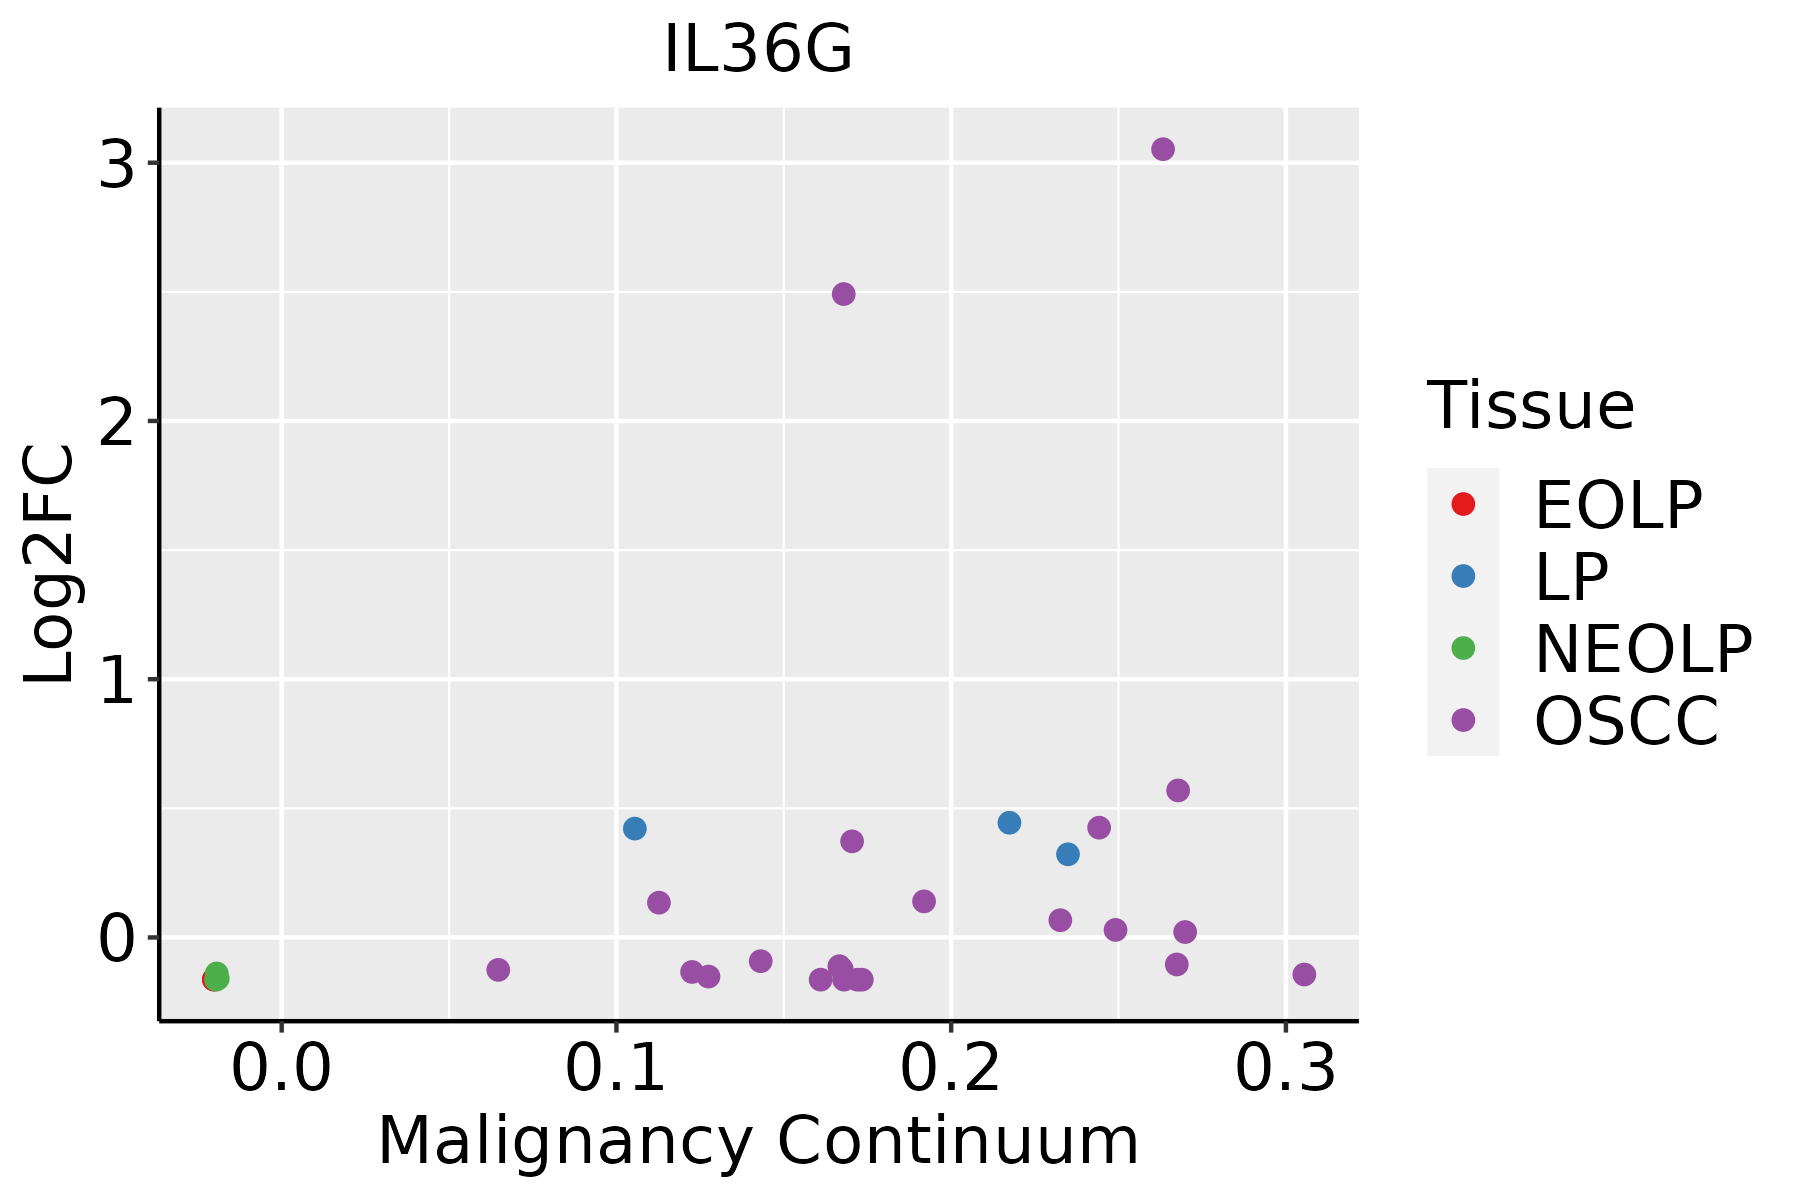 | EOLP: Erosive Oral lichen planus |
| LP: leukoplakia | ||
| NEOLP: Non-erosive oral lichen planus | ||
| OSCC: Oral squamous cell carcinoma |
| ∗log2FC in expression of this searched gene in stem-like cells from each diseased tissue sample relative to stem-like cells in normal samples in each tissue plotted against the malignancy continuum. Samples are colored based on if they are from different disease stage. |
Top |
Malignant transformation related pathway analysis |
| Find out the enriched GO biological processes and KEGG pathways involved in transition from healthy to precancer to cancer |
| Tissue | Disease Stage | Enriched GO biological Processes |
| Colorectum | AD |  |
| Colorectum | SER |  |
| Colorectum | MSS |  |
| Colorectum | MSI-H |  |
| Colorectum | FAP |  |
| ∗Top 15 enriched GO BP terms are showed in the bar plot of each disease state in each tissue. Each row represents a significant GO biological process which is colored according to the -log10(p.adjust). |
| Page: 1 2 3 4 5 6 7 8 9 |
| GO ID | Tissue | Disease Stage | Description | Gene Ratio | Bg Ratio | pvalue | p.adjust | Count |
| GO:003249619 | Esophagus | ESCC | response to lipopolysaccharide | 191/8552 | 343/18723 | 1.11e-04 | 7.73e-04 | 191 |
| GO:000223719 | Esophagus | ESCC | response to molecule of bacterial origin | 194/8552 | 363/18723 | 1.64e-03 | 7.61e-03 | 194 |
| GO:007122215 | Esophagus | ESCC | cellular response to lipopolysaccharide | 113/8552 | 209/18723 | 8.79e-03 | 3.10e-02 | 113 |
| GO:007121617 | Esophagus | ESCC | cellular response to biotic stimulus | 131/8552 | 246/18723 | 9.85e-03 | 3.39e-02 | 131 |
| GO:003249617 | Oral cavity | OSCC | response to lipopolysaccharide | 178/7305 | 343/18723 | 7.27e-07 | 1.03e-05 | 178 |
| GO:007121615 | Oral cavity | OSCC | cellular response to biotic stimulus | 129/7305 | 246/18723 | 1.20e-05 | 1.23e-04 | 129 |
| GO:000223717 | Oral cavity | OSCC | response to molecule of bacterial origin | 181/7305 | 363/18723 | 1.48e-05 | 1.49e-04 | 181 |
| GO:007122210 | Oral cavity | OSCC | cellular response to lipopolysaccharide | 110/7305 | 209/18723 | 4.15e-05 | 3.60e-04 | 110 |
| GO:00192214 | Oral cavity | OSCC | cytokine-mediated signaling pathway | 222/7305 | 472/18723 | 2.02e-04 | 1.35e-03 | 222 |
| GO:007121910 | Oral cavity | OSCC | cellular response to molecule of bacterial origin | 112/7305 | 221/18723 | 2.64e-04 | 1.69e-03 | 112 |
| GO:001922112 | Oral cavity | EOLP | cytokine-mediated signaling pathway | 94/2218 | 472/18723 | 2.36e-07 | 7.37e-06 | 94 |
| GO:003249623 | Oral cavity | EOLP | response to lipopolysaccharide | 65/2218 | 343/18723 | 8.02e-05 | 9.65e-04 | 65 |
| GO:000223724 | Oral cavity | EOLP | response to molecule of bacterial origin | 67/2218 | 363/18723 | 1.42e-04 | 1.53e-03 | 67 |
| GO:00024371 | Oral cavity | EOLP | inflammatory response to antigenic stimulus | 19/2218 | 74/18723 | 7.90e-04 | 6.26e-03 | 19 |
| GO:007121623 | Oral cavity | EOLP | cellular response to biotic stimulus | 46/2218 | 246/18723 | 1.10e-03 | 8.08e-03 | 46 |
| GO:007122222 | Oral cavity | EOLP | cellular response to lipopolysaccharide | 39/2218 | 209/18723 | 2.62e-03 | 1.58e-02 | 39 |
| GO:007121914 | Oral cavity | EOLP | cellular response to molecule of bacterial origin | 39/2218 | 221/18723 | 6.97e-03 | 3.39e-02 | 39 |
| GO:001922122 | Oral cavity | NEOLP | cytokine-mediated signaling pathway | 88/2005 | 472/18723 | 1.37e-07 | 4.80e-06 | 88 |
| GO:003249631 | Oral cavity | NEOLP | response to lipopolysaccharide | 65/2005 | 343/18723 | 3.30e-06 | 7.40e-05 | 65 |
| GO:000223731 | Oral cavity | NEOLP | response to molecule of bacterial origin | 67/2005 | 363/18723 | 5.94e-06 | 1.20e-04 | 67 |
| Page: 1 2 |
| Pathway ID | Tissue | Disease Stage | Description | Gene Ratio | Bg Ratio | pvalue | p.adjust | qvalue | Count |
| Page: 1 |
Top |
Cell-cell communication analysis |
| Identification of potential cell-cell interactions between two cell types and their ligand-receptor pairs for different disease states |
| Ligand | Receptor | LRpair | Pathway | Tissue | Disease Stage |
| Page: 1 |
Top |
Single-cell gene regulatory network inference analysis |
| Find out the significant the regulons (TFs) and the target genes of each regulon across cell types for different disease states |
| TF | Cell Type | Tissue | Disease Stage | Target Gene | RSS | Regulon Activity |
| ∗The dot plots of a searched regulon are shown for all cell subpopulations in each disease state of each tissue based on the regulon specific score inferred using pySCENIC and by calculating the average expression. |
| Page: 1 |
Top |
Somatic mutation of malignant transformation related genes |
| Annotation of somatic variants for genes involved in malignant transformation |
| Hugo Symbol | Variant Class | Variant Classification | dbSNP RS | HGVSc | HGVSp | HGVSp Short | SWISSPROT | BIOTYPE | SIFT | PolyPhen | Tumor Sample Barcode | Tissue | Histology | Sex | Age | Stage | Therapy Types | Drugs | Outcome |
| IL36G | SNV | Missense_Mutation | novel | c.256N>G | p.Leu86Val | p.L86V | Q9NZH8 | protein_coding | deleterious(0.01) | probably_damaging(0.964) | TCGA-AN-A046-01 | Breast | breast invasive carcinoma | Female | >=65 | I/II | Unknown | Unknown | SD |
| IL36G | SNV | Missense_Mutation | c.212N>A | p.Arg71Lys | p.R71K | Q9NZH8 | protein_coding | tolerated(1) | benign(0.001) | TCGA-VS-A94Z-01 | Cervix | cervical & endocervical cancer | Female | <65 | I/II | Chemotherapy | cisplatin | CR | |
| IL36G | SNV | Missense_Mutation | rs143518613 | c.233N>A | p.Gly78Glu | p.G78E | Q9NZH8 | protein_coding | deleterious(0.01) | probably_damaging(0.98) | TCGA-VS-A958-01 | Cervix | cervical & endocervical cancer | Female | <65 | I/II | Chemotherapy | cisplatin | CR |
| IL36G | SNV | Missense_Mutation | c.364N>A | p.Ala122Thr | p.A122T | Q9NZH8 | protein_coding | tolerated(0.68) | benign(0.007) | TCGA-AJ-A3EK-01 | Endometrium | uterine corpus endometrioid carcinoma | Female | <65 | I/II | Chemotherapy | carboplatin | CR | |
| IL36G | SNV | Missense_Mutation | novel | c.250N>C | p.Met84Leu | p.M84L | Q9NZH8 | protein_coding | tolerated(0.69) | benign(0.007) | TCGA-AP-A0LM-01 | Endometrium | uterine corpus endometrioid carcinoma | Female | <65 | III/IV | Chemotherapy | cisplatin | SD |
| IL36G | SNV | Missense_Mutation | c.197N>A | p.Ala66Asp | p.A66D | Q9NZH8 | protein_coding | deleterious(0.02) | possibly_damaging(0.519) | TCGA-B5-A11E-01 | Endometrium | uterine corpus endometrioid carcinoma | Female | <65 | I/II | Unknown | Unknown | SD | |
| IL36G | SNV | Missense_Mutation | rs764738286 | c.43N>A | p.Val15Ile | p.V15I | Q9NZH8 | protein_coding | tolerated(0.45) | benign(0) | TCGA-B5-A1MV-01 | Endometrium | uterine corpus endometrioid carcinoma | Female | >=65 | I/II | Unknown | Unknown | SD |
| IL36G | SNV | Missense_Mutation | novel | c.380C>T | p.Thr127Ile | p.T127I | Q9NZH8 | protein_coding | deleterious(0.04) | probably_damaging(0.919) | TCGA-B5-A1MX-01 | Endometrium | uterine corpus endometrioid carcinoma | Female | <65 | I/II | Hormone Therapy | megace | SD |
| IL36G | SNV | Missense_Mutation | novel | c.85N>T | p.Asp29Tyr | p.D29Y | Q9NZH8 | protein_coding | deleterious(0) | probably_damaging(1) | TCGA-BG-A3EW-01 | Endometrium | uterine corpus endometrioid carcinoma | Female | <65 | III/IV | Unknown | Unknown | SD |
| IL36G | SNV | Missense_Mutation | novel | c.240G>T | p.Gln80His | p.Q80H | Q9NZH8 | protein_coding | deleterious(0.01) | benign(0.155) | TCGA-E6-A1LX-01 | Endometrium | uterine corpus endometrioid carcinoma | Female | <65 | I/II | Unknown | Unknown | SD |
| Page: 1 2 |
Top |
Related drugs of malignant transformation related genes |
| Identification of chemicals and drugs interact with genes involved in malignant transfromation |
| (DGIdb 4.0) |
| Entrez ID | Symbol | Category | Interaction Types | Drug Claim Name | Drug Name | PMIDs |
| Page: 1 |

Copyright 2023-Present -The University of Texas Health Science Center at Houston |