
|
|||||
|
 | |
| |
| |
| |
| |
| |
|
Gene: IL33 |
Gene summary for IL33 |
| Gene information | Species | Human | Gene symbol | IL33 | Gene ID | 90865 |
| Gene name | interleukin 33 | |
| Gene Alias | C9orf26 | |
| Cytomap | 9p24.1 | |
| Gene Type | protein-coding | GO ID | GO:0000122 | UniProtAcc | O95760 |
Top |
Malignant transformation analysis |
| Identification of the aberrant gene expression in precancerous and cancerous lesions by comparing the gene expression of stem-like cells in diseased tissues with normal stem cells |
| Entrez ID | Symbol | Replicates | Species | Organ | Tissue | Adj P-value | Log2FC | Malignancy |
| 90865 | IL33 | LZE8T | Human | Esophagus | ESCC | 5.00e-05 | 3.87e-01 | 0.067 |
| 90865 | IL33 | LZE6T | Human | Esophagus | ESCC | 4.30e-07 | 6.43e-01 | 0.0845 |
| 90865 | IL33 | P2T-E | Human | Esophagus | ESCC | 8.84e-05 | -2.03e-01 | 0.1177 |
| 90865 | IL33 | P12T-E | Human | Esophagus | ESCC | 4.30e-02 | -2.18e-01 | 0.1122 |
| 90865 | IL33 | P22T-E | Human | Esophagus | ESCC | 5.36e-03 | -2.14e-01 | 0.1236 |
| 90865 | IL33 | P26T-E | Human | Esophagus | ESCC | 3.97e-04 | -2.23e-01 | 0.1276 |
| 90865 | IL33 | P31T-E | Human | Esophagus | ESCC | 5.79e-03 | -2.17e-01 | 0.1251 |
| 90865 | IL33 | P32T-E | Human | Esophagus | ESCC | 5.14e-03 | -1.98e-01 | 0.1666 |
| 90865 | IL33 | P47T-E | Human | Esophagus | ESCC | 2.20e-03 | -2.14e-01 | 0.1067 |
| 90865 | IL33 | P52T-E | Human | Esophagus | ESCC | 1.45e-02 | -6.31e-02 | 0.1555 |
| 90865 | IL33 | P62T-E | Human | Esophagus | ESCC | 2.67e-21 | 9.05e-01 | 0.1302 |
| 90865 | IL33 | P65T-E | Human | Esophagus | ESCC | 2.37e-06 | 1.08e-01 | 0.0978 |
| 90865 | IL33 | P75T-E | Human | Esophagus | ESCC | 4.86e-03 | -2.14e-01 | 0.1125 |
| 90865 | IL33 | P79T-E | Human | Esophagus | ESCC | 2.56e-03 | -2.79e-02 | 0.1154 |
| 90865 | IL33 | P80T-E | Human | Esophagus | ESCC | 4.40e-05 | 5.19e-01 | 0.155 |
| 90865 | IL33 | P130T-E | Human | Esophagus | ESCC | 3.97e-04 | -2.23e-01 | 0.1676 |
| 90865 | IL33 | Pat01-B | Human | Stomach | GC | 2.76e-34 | -1.05e+00 | 0.5754 |
| 90865 | IL33 | Pat02-B | Human | Stomach | GC | 4.20e-41 | -1.03e+00 | 0.0368 |
| 90865 | IL33 | Pat03-B | Human | Stomach | GC | 1.65e-30 | -1.03e+00 | 0.3693 |
| 90865 | IL33 | Pat04-B | Human | Stomach | GC | 1.02e-15 | -1.03e+00 | -0.1483 |
| Page: 1 2 3 |
| Tissue | Expression Dynamics | Abbreviation |
| Esophagus | 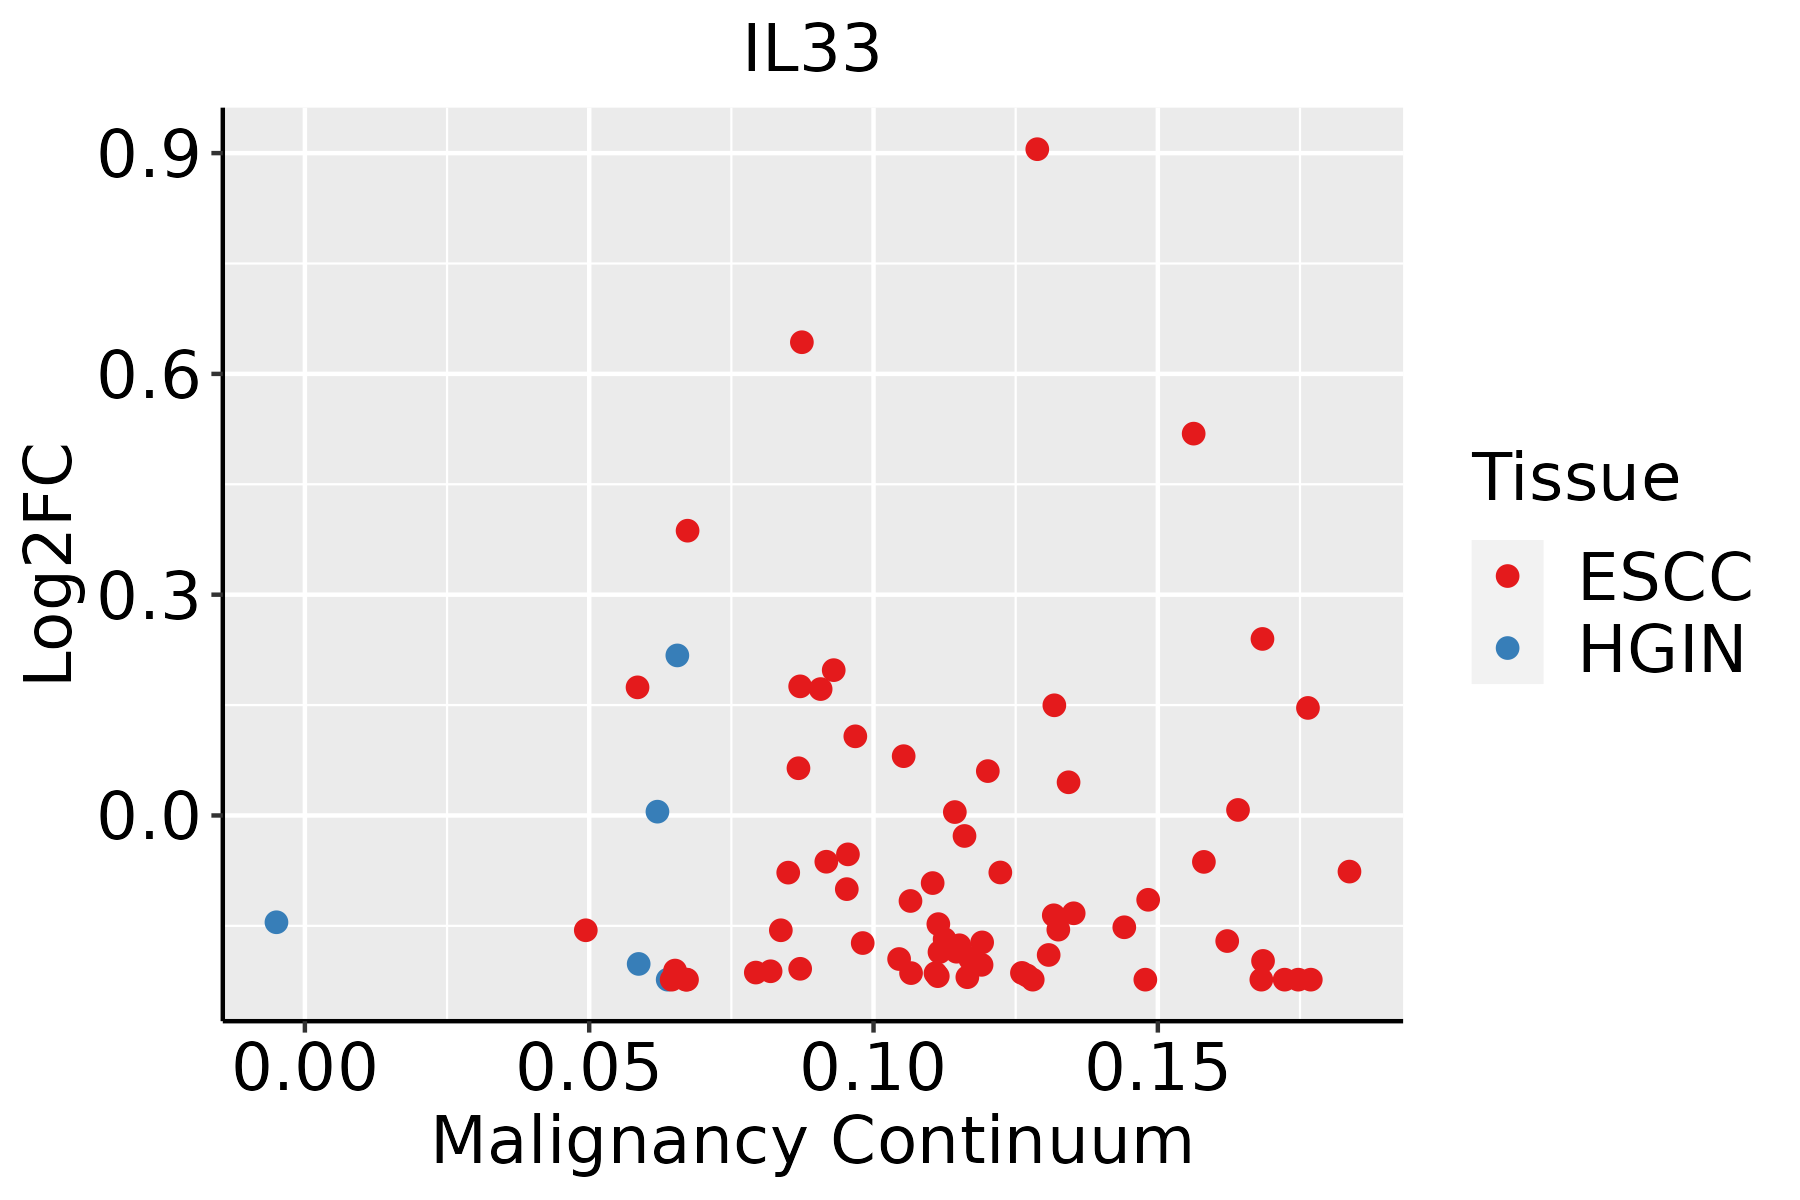 | ESCC: Esophageal squamous cell carcinoma |
| HGIN: High-grade intraepithelial neoplasias | ||
| LGIN: Low-grade intraepithelial neoplasias | ||
| GC | 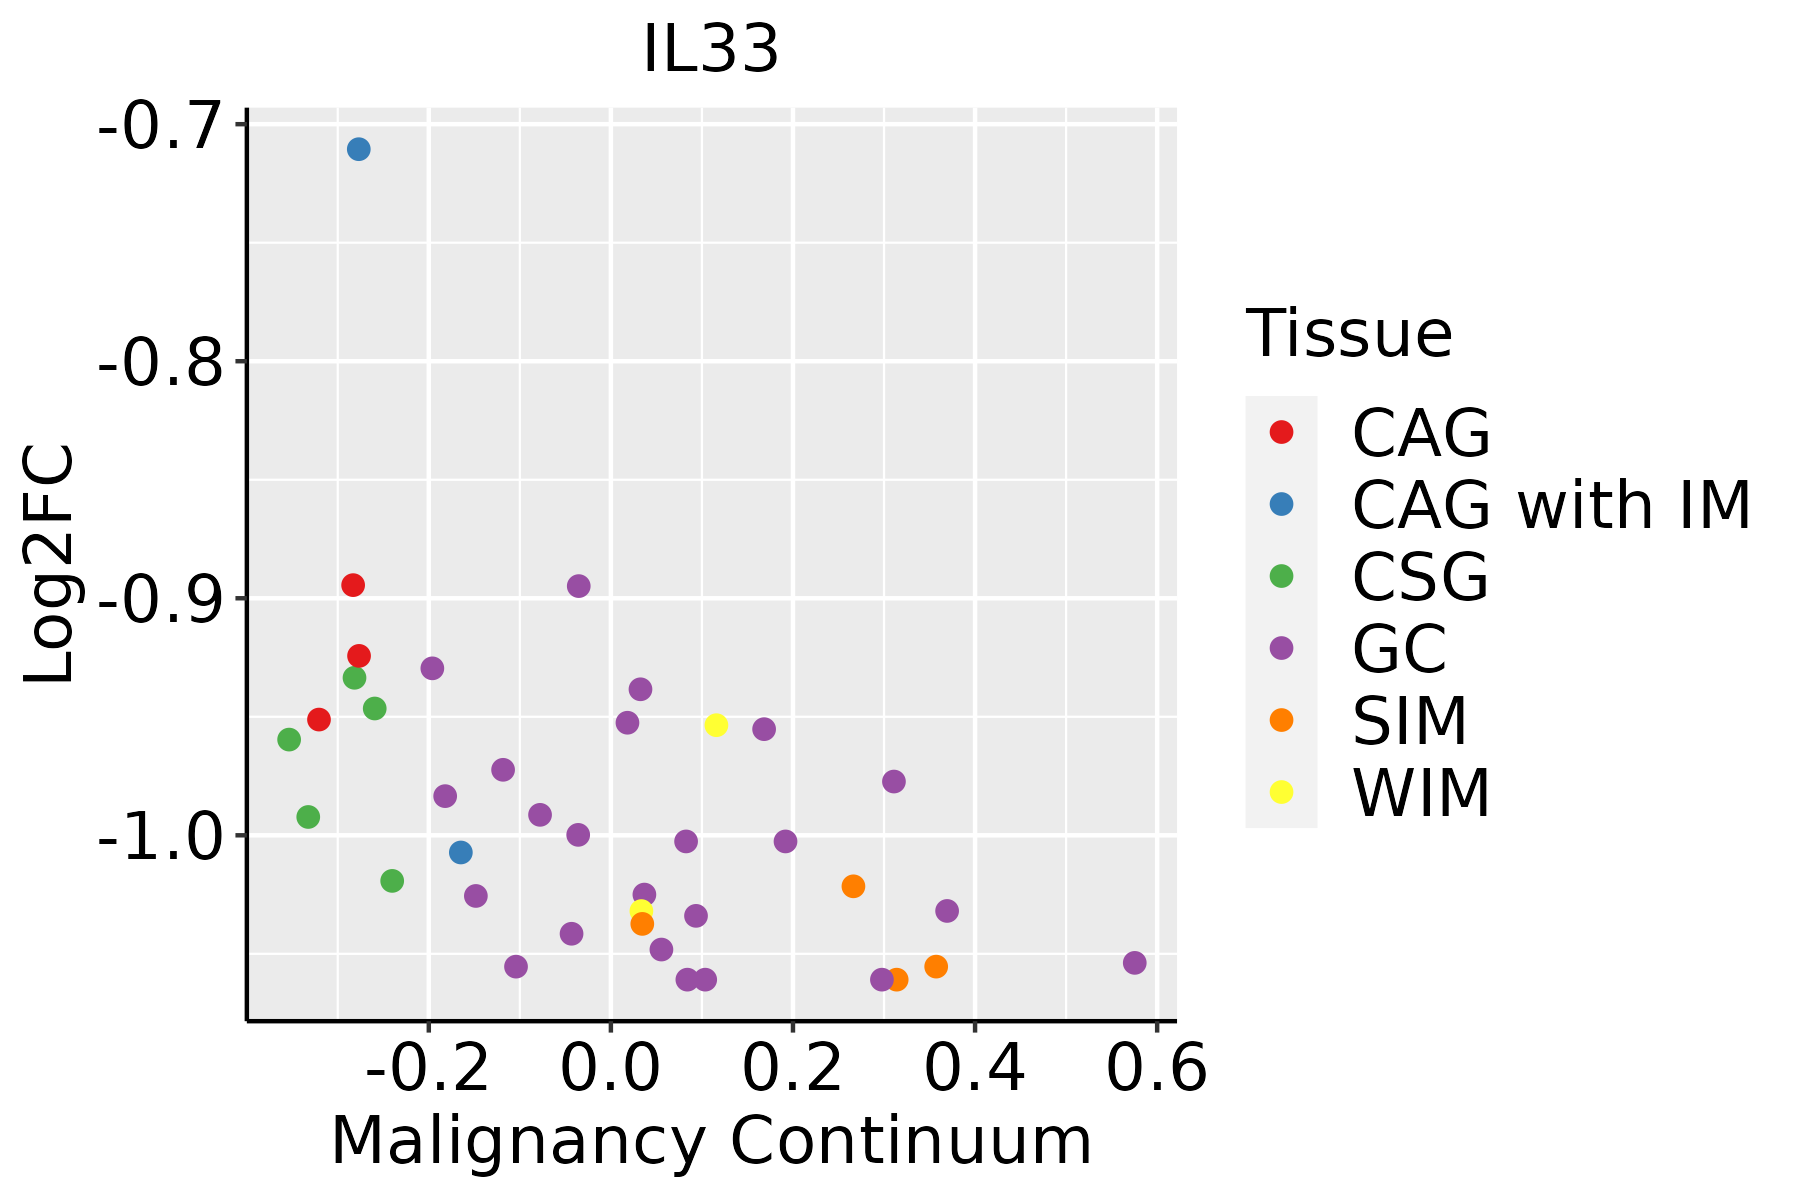 | CAG: Chronic atrophic gastritis |
| CAG with IM: Chronic atrophic gastritis with intestinal metaplasia | ||
| CSG: Chronic superficial gastritis | ||
| GC: Gastric cancer | ||
| SIM: Severe intestinal metaplasia | ||
| WIM: Wild intestinal metaplasia | ||
| Thyroid | 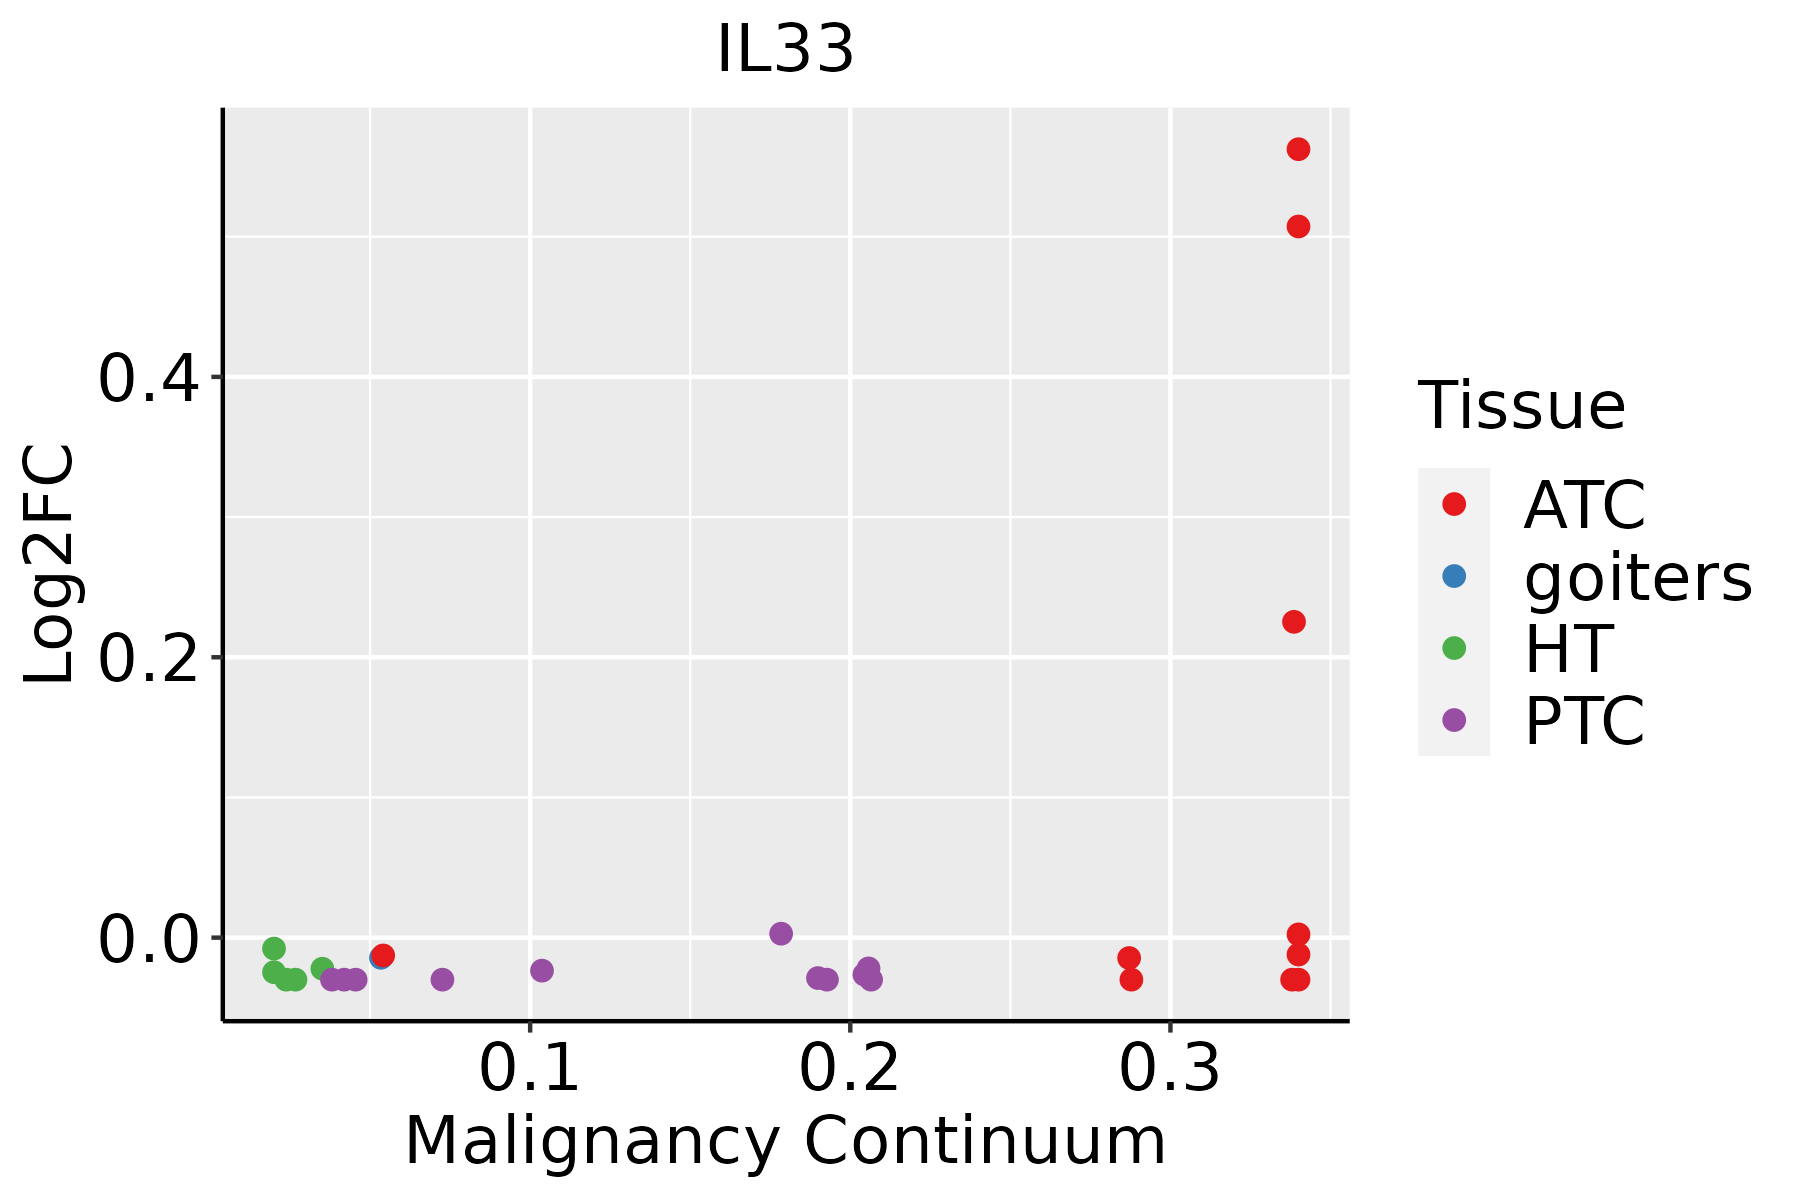 | ATC: Anaplastic thyroid cancer |
| HT: Hashimoto's thyroiditis | ||
| PTC: Papillary thyroid cancer |
| ∗log2FC in expression of this searched gene in stem-like cells from each diseased tissue sample relative to stem-like cells in normal samples in each tissue plotted against the malignancy continuum. Samples are colored based on if they are from different disease stage. |
Top |
Malignant transformation related pathway analysis |
| Find out the enriched GO biological processes and KEGG pathways involved in transition from healthy to precancer to cancer |
| Tissue | Disease Stage | Enriched GO biological Processes |
| Colorectum | AD |  |
| Colorectum | SER |  |
| Colorectum | MSS |  |
| Colorectum | MSI-H |  |
| Colorectum | FAP |  |
| ∗Top 15 enriched GO BP terms are showed in the bar plot of each disease state in each tissue. Each row represents a significant GO biological process which is colored according to the -log10(p.adjust). |
| Page: 1 2 3 4 5 6 7 8 9 |
| GO ID | Tissue | Disease Stage | Description | Gene Ratio | Bg Ratio | pvalue | p.adjust | Count |
| GO:00091002 | Esophagus | ESCC | glycoprotein metabolic process | 226/8552 | 387/18723 | 2.64e-07 | 3.94e-06 | 226 |
| GO:00091012 | Esophagus | ESCC | glycoprotein biosynthetic process | 181/8552 | 317/18723 | 2.54e-05 | 2.15e-04 | 181 |
| GO:000181916 | Esophagus | ESCC | positive regulation of cytokine production | 244/8552 | 467/18723 | 2.29e-03 | 1.01e-02 | 244 |
| GO:0002696 | Stomach | GC | positive regulation of leukocyte activation | 46/1159 | 409/18723 | 6.50e-05 | 1.46e-03 | 46 |
| GO:0050867 | Stomach | GC | positive regulation of cell activation | 46/1159 | 420/18723 | 1.22e-04 | 2.33e-03 | 46 |
| GO:0070661 | Stomach | GC | leukocyte proliferation | 35/1159 | 318/18723 | 6.92e-04 | 9.20e-03 | 35 |
| GO:0070663 | Stomach | GC | regulation of leukocyte proliferation | 28/1159 | 245/18723 | 1.29e-03 | 1.45e-02 | 28 |
| GO:0032640 | Stomach | GC | tumor necrosis factor production | 22/1159 | 181/18723 | 1.88e-03 | 1.94e-02 | 22 |
| GO:0032680 | Stomach | GC | regulation of tumor necrosis factor production | 22/1159 | 181/18723 | 1.88e-03 | 1.94e-02 | 22 |
| GO:0001819 | Stomach | GC | positive regulation of cytokine production | 45/1159 | 467/18723 | 2.17e-03 | 2.16e-02 | 45 |
| GO:0071706 | Stomach | GC | tumor necrosis factor superfamily cytokine production | 22/1159 | 186/18723 | 2.66e-03 | 2.46e-02 | 22 |
| GO:1903555 | Stomach | GC | regulation of tumor necrosis factor superfamily cytokine production | 22/1159 | 186/18723 | 2.66e-03 | 2.46e-02 | 22 |
| GO:0032760 | Stomach | GC | positive regulation of tumor necrosis factor production | 14/1159 | 103/18723 | 4.42e-03 | 3.60e-02 | 14 |
| GO:1903557 | Stomach | GC | positive regulation of tumor necrosis factor superfamily cytokine production | 14/1159 | 107/18723 | 6.22e-03 | 4.68e-02 | 14 |
| GO:00026961 | Stomach | CAG with IM | positive regulation of leukocyte activation | 42/1050 | 409/18723 | 1.16e-04 | 2.50e-03 | 42 |
| GO:00508671 | Stomach | CAG with IM | positive regulation of cell activation | 42/1050 | 420/18723 | 2.07e-04 | 3.87e-03 | 42 |
| GO:00706611 | Stomach | CAG with IM | leukocyte proliferation | 34/1050 | 318/18723 | 2.38e-04 | 4.27e-03 | 34 |
| GO:00706631 | Stomach | CAG with IM | regulation of leukocyte proliferation | 27/1050 | 245/18723 | 6.29e-04 | 8.92e-03 | 27 |
| GO:00018191 | Stomach | CAG with IM | positive regulation of cytokine production | 43/1050 | 467/18723 | 9.84e-04 | 1.27e-02 | 43 |
| GO:00326401 | Stomach | CAG with IM | tumor necrosis factor production | 21/1050 | 181/18723 | 1.27e-03 | 1.52e-02 | 21 |
| Page: 1 2 3 4 5 |
| Pathway ID | Tissue | Disease Stage | Description | Gene Ratio | Bg Ratio | pvalue | p.adjust | qvalue | Count |
| hsa0516425 | Esophagus | ESCC | Influenza A | 122/4205 | 171/8465 | 5.01e-09 | 4.79e-08 | 2.45e-08 | 122 |
| hsa046234 | Esophagus | ESCC | Cytosolic DNA-sensing pathway | 49/4205 | 75/8465 | 4.35e-03 | 1.12e-02 | 5.74e-03 | 49 |
| hsa0516435 | Esophagus | ESCC | Influenza A | 122/4205 | 171/8465 | 5.01e-09 | 4.79e-08 | 2.45e-08 | 122 |
| hsa0462311 | Esophagus | ESCC | Cytosolic DNA-sensing pathway | 49/4205 | 75/8465 | 4.35e-03 | 1.12e-02 | 5.74e-03 | 49 |
| hsa05164 | Stomach | GC | Influenza A | 27/708 | 171/8465 | 9.20e-04 | 7.01e-03 | 4.94e-03 | 27 |
| hsa051641 | Stomach | GC | Influenza A | 27/708 | 171/8465 | 9.20e-04 | 7.01e-03 | 4.94e-03 | 27 |
| hsa051642 | Stomach | CAG with IM | Influenza A | 26/640 | 171/8465 | 4.49e-04 | 4.08e-03 | 2.87e-03 | 26 |
| hsa0421710 | Stomach | CAG with IM | Necroptosis | 21/640 | 159/8465 | 8.37e-03 | 4.59e-02 | 3.22e-02 | 21 |
| hsa051643 | Stomach | CAG with IM | Influenza A | 26/640 | 171/8465 | 4.49e-04 | 4.08e-03 | 2.87e-03 | 26 |
| hsa0421711 | Stomach | CAG with IM | Necroptosis | 21/640 | 159/8465 | 8.37e-03 | 4.59e-02 | 3.22e-02 | 21 |
| hsa051644 | Stomach | CSG | Influenza A | 26/633 | 171/8465 | 3.79e-04 | 3.33e-03 | 2.40e-03 | 26 |
| hsa042172 | Stomach | CSG | Necroptosis | 21/633 | 159/8465 | 7.42e-03 | 4.11e-02 | 2.96e-02 | 21 |
| hsa051645 | Stomach | CSG | Influenza A | 26/633 | 171/8465 | 3.79e-04 | 3.33e-03 | 2.40e-03 | 26 |
| hsa042173 | Stomach | CSG | Necroptosis | 21/633 | 159/8465 | 7.42e-03 | 4.11e-02 | 2.96e-02 | 21 |
| hsa042174 | Stomach | CAG | Necroptosis | 17/368 | 159/8465 | 5.26e-04 | 4.61e-03 | 3.69e-03 | 17 |
| hsa042175 | Stomach | CAG | Necroptosis | 17/368 | 159/8465 | 5.26e-04 | 4.61e-03 | 3.69e-03 | 17 |
| hsa042176 | Stomach | WIM | Necroptosis | 15/284 | 159/8465 | 2.79e-04 | 3.01e-03 | 2.40e-03 | 15 |
| hsa051646 | Stomach | WIM | Influenza A | 13/284 | 171/8465 | 4.89e-03 | 3.26e-02 | 2.60e-02 | 13 |
| hsa042177 | Stomach | WIM | Necroptosis | 15/284 | 159/8465 | 2.79e-04 | 3.01e-03 | 2.40e-03 | 15 |
| hsa051647 | Stomach | WIM | Influenza A | 13/284 | 171/8465 | 4.89e-03 | 3.26e-02 | 2.60e-02 | 13 |
| Page: 1 2 |
Top |
Cell-cell communication analysis |
| Identification of potential cell-cell interactions between two cell types and their ligand-receptor pairs for different disease states |
| Ligand | Receptor | LRpair | Pathway | Tissue | Disease Stage |
| IL33 | IL1RL1_IL1RAP | IL33_IL1RL1_IL1RAP | IL1 | HNSCC | Precancer |
| Page: 1 |
Top |
Single-cell gene regulatory network inference analysis |
| Find out the significant the regulons (TFs) and the target genes of each regulon across cell types for different disease states |
| TF | Cell Type | Tissue | Disease Stage | Target Gene | RSS | Regulon Activity |
| ∗The dot plots of a searched regulon are shown for all cell subpopulations in each disease state of each tissue based on the regulon specific score inferred using pySCENIC and by calculating the average expression. |
| Page: 1 |
Top |
Somatic mutation of malignant transformation related genes |
| Annotation of somatic variants for genes involved in malignant transformation |
| Hugo Symbol | Variant Class | Variant Classification | dbSNP RS | HGVSc | HGVSp | HGVSp Short | SWISSPROT | BIOTYPE | SIFT | PolyPhen | Tumor Sample Barcode | Tissue | Histology | Sex | Age | Stage | Therapy Types | Drugs | Outcome |
| IL33 | SNV | Missense_Mutation | c.131N>A | p.Phe44Tyr | p.F44Y | O95760 | protein_coding | tolerated(0.63) | benign(0.003) | TCGA-A8-A09A-01 | Breast | breast invasive carcinoma | Female | <65 | I/II | Hormone Therapy | tamoxiphen | SD | |
| IL33 | SNV | Missense_Mutation | c.427N>G | p.Tyr143Asp | p.Y143D | O95760 | protein_coding | deleterious(0.02) | possibly_damaging(0.892) | TCGA-B6-A0RN-01 | Breast | breast invasive carcinoma | Female | <65 | I/II | Unknown | Unknown | SD | |
| IL33 | SNV | Missense_Mutation | c.445G>A | p.Asp149Asn | p.D149N | O95760 | protein_coding | deleterious(0) | possibly_damaging(0.74) | TCGA-BH-A0B0-01 | Breast | breast invasive carcinoma | Female | <65 | I/II | Chemotherapy | adriamycin | CR | |
| IL33 | SNV | Missense_Mutation | novel | c.88N>C | p.Gly30Arg | p.G30R | O95760 | protein_coding | tolerated(1) | benign(0) | TCGA-E9-A5UP-01 | Breast | breast invasive carcinoma | Female | <65 | I/II | Hormone Therapy | tamoxiphen | SD |
| IL33 | SNV | Missense_Mutation | c.784A>T | p.Asn262Tyr | p.N262Y | O95760 | protein_coding | deleterious(0) | probably_damaging(0.925) | TCGA-IR-A3LK-01 | Cervix | cervical & endocervical cancer | Female | >=65 | I/II | Chemotherapy | cisplatin | PD | |
| IL33 | SNV | Missense_Mutation | c.187G>C | p.Glu63Gln | p.E63Q | O95760 | protein_coding | deleterious(0.01) | possibly_damaging(0.55) | TCGA-MY-A5BD-01 | Cervix | cervical & endocervical cancer | Female | <65 | I/II | Chemotherapy | cisplatin | CR | |
| IL33 | SNV | Missense_Mutation | rs770611056 | c.143N>A | p.Arg48His | p.R48H | O95760 | protein_coding | deleterious(0) | possibly_damaging(0.718) | TCGA-AP-A051-01 | Endometrium | uterine corpus endometrioid carcinoma | Female | >=65 | I/II | Unknown | Unknown | SD |
| IL33 | SNV | Missense_Mutation | novel | c.484N>G | p.Ser162Gly | p.S162G | O95760 | protein_coding | tolerated(0.07) | benign(0.065) | TCGA-AP-A1DK-01 | Endometrium | uterine corpus endometrioid carcinoma | Female | <65 | I/II | Unknown | Unknown | SD |
| IL33 | SNV | Missense_Mutation | novel | c.43N>T | p.Ala15Ser | p.A15S | O95760 | protein_coding | tolerated(0.07) | possibly_damaging(0.61) | TCGA-AP-A1DV-01 | Endometrium | uterine corpus endometrioid carcinoma | Female | <65 | I/II | Unknown | Unknown | SD |
| IL33 | SNV | Missense_Mutation | novel | c.465N>T | p.Lys155Asn | p.K155N | O95760 | protein_coding | deleterious(0.03) | benign(0.003) | TCGA-AX-A0J0-01 | Endometrium | uterine corpus endometrioid carcinoma | Female | <65 | I/II | Unknown | Unknown | SD |
| Page: 1 2 3 |
Top |
Related drugs of malignant transformation related genes |
| Identification of chemicals and drugs interact with genes involved in malignant transfromation |
| (DGIdb 4.0) |
| Entrez ID | Symbol | Category | Interaction Types | Drug Claim Name | Drug Name | PMIDs |
| 90865 | IL33 | DRUGGABLE GENOME | AMG 282 |
| Page: 1 |

Copyright 2023-Present -The University of Texas Health Science Center at Houston |