
|
|||||
|
 | |
| |
| |
| |
| |
| |
|
Gene: IL2RG |
Gene summary for IL2RG |
| Gene information | Species | Human | Gene symbol | IL2RG | Gene ID | 3561 |
| Gene name | interleukin 2 receptor subunit gamma | |
| Gene Alias | CD132 | |
| Cytomap | Xq13.1 | |
| Gene Type | protein-coding | GO ID | GO:0002376 | UniProtAcc | P31785 |
Top |
Malignant transformation analysis |
| Identification of the aberrant gene expression in precancerous and cancerous lesions by comparing the gene expression of stem-like cells in diseased tissues with normal stem cells |
| Entrez ID | Symbol | Replicates | Species | Organ | Tissue | Adj P-value | Log2FC | Malignancy |
| 3561 | IL2RG | HTA11_2487_2000001011 | Human | Colorectum | SER | 5.63e-22 | 7.47e-01 | -0.1808 |
| 3561 | IL2RG | HTA11_1938_2000001011 | Human | Colorectum | AD | 8.28e-25 | 7.24e-01 | -0.0811 |
| 3561 | IL2RG | HTA11_78_2000001011 | Human | Colorectum | AD | 7.85e-13 | 3.52e-01 | -0.1088 |
| 3561 | IL2RG | HTA11_347_2000001011 | Human | Colorectum | AD | 2.61e-17 | 3.88e-01 | -0.1954 |
| 3561 | IL2RG | HTA11_411_2000001011 | Human | Colorectum | SER | 2.63e-25 | 1.94e+00 | -0.2602 |
| 3561 | IL2RG | HTA11_2112_2000001011 | Human | Colorectum | SER | 2.67e-18 | 1.31e+00 | -0.2196 |
| 3561 | IL2RG | HTA11_3361_2000001011 | Human | Colorectum | AD | 5.46e-03 | 1.80e-01 | -0.1207 |
| 3561 | IL2RG | HTA11_83_2000001011 | Human | Colorectum | SER | 2.83e-15 | 4.76e-01 | -0.1526 |
| 3561 | IL2RG | HTA11_696_2000001011 | Human | Colorectum | AD | 4.40e-09 | 2.13e-01 | -0.1464 |
| 3561 | IL2RG | HTA11_866_2000001011 | Human | Colorectum | AD | 2.05e-06 | 2.16e-01 | -0.1001 |
| 3561 | IL2RG | HTA11_1391_2000001011 | Human | Colorectum | AD | 1.68e-07 | 2.25e-01 | -0.059 |
| 3561 | IL2RG | HTA11_2992_2000001011 | Human | Colorectum | SER | 7.86e-21 | 8.48e-01 | -0.1706 |
| 3561 | IL2RG | HTA11_5212_2000001011 | Human | Colorectum | AD | 2.09e-30 | 1.32e+00 | -0.2061 |
| 3561 | IL2RG | HTA11_866_3004761011 | Human | Colorectum | AD | 3.98e-03 | 1.18e-01 | 0.096 |
| 3561 | IL2RG | HTA11_4255_2000001011 | Human | Colorectum | SER | 3.40e-03 | 2.22e-01 | 0.0446 |
| 3561 | IL2RG | HTA11_10711_2000001011 | Human | Colorectum | AD | 6.02e-03 | 1.35e-01 | 0.0338 |
| 3561 | IL2RG | HTA11_6818_2000001021 | Human | Colorectum | AD | 1.59e-10 | 4.08e-01 | 0.0588 |
| 3561 | IL2RG | HTA11_99999970781_79442 | Human | Colorectum | MSS | 9.04e-05 | 1.37e-01 | 0.294 |
| 3561 | IL2RG | HTA11_99999965104_69814 | Human | Colorectum | MSS | 3.86e-11 | 3.30e-01 | 0.281 |
| 3561 | IL2RG | HTA11_99999971662_82457 | Human | Colorectum | MSS | 1.12e-26 | 6.07e-01 | 0.3859 |
| Page: 1 2 3 |
| Tissue | Expression Dynamics | Abbreviation |
| Colorectum (GSE201348) |  | FAP: Familial adenomatous polyposis |
| CRC: Colorectal cancer | ||
| Colorectum (HTA11) |  | AD: Adenomas |
| SER: Sessile serrated lesions | ||
| MSI-H: Microsatellite-high colorectal cancer | ||
| MSS: Microsatellite stable colorectal cancer | ||
| Esophagus | 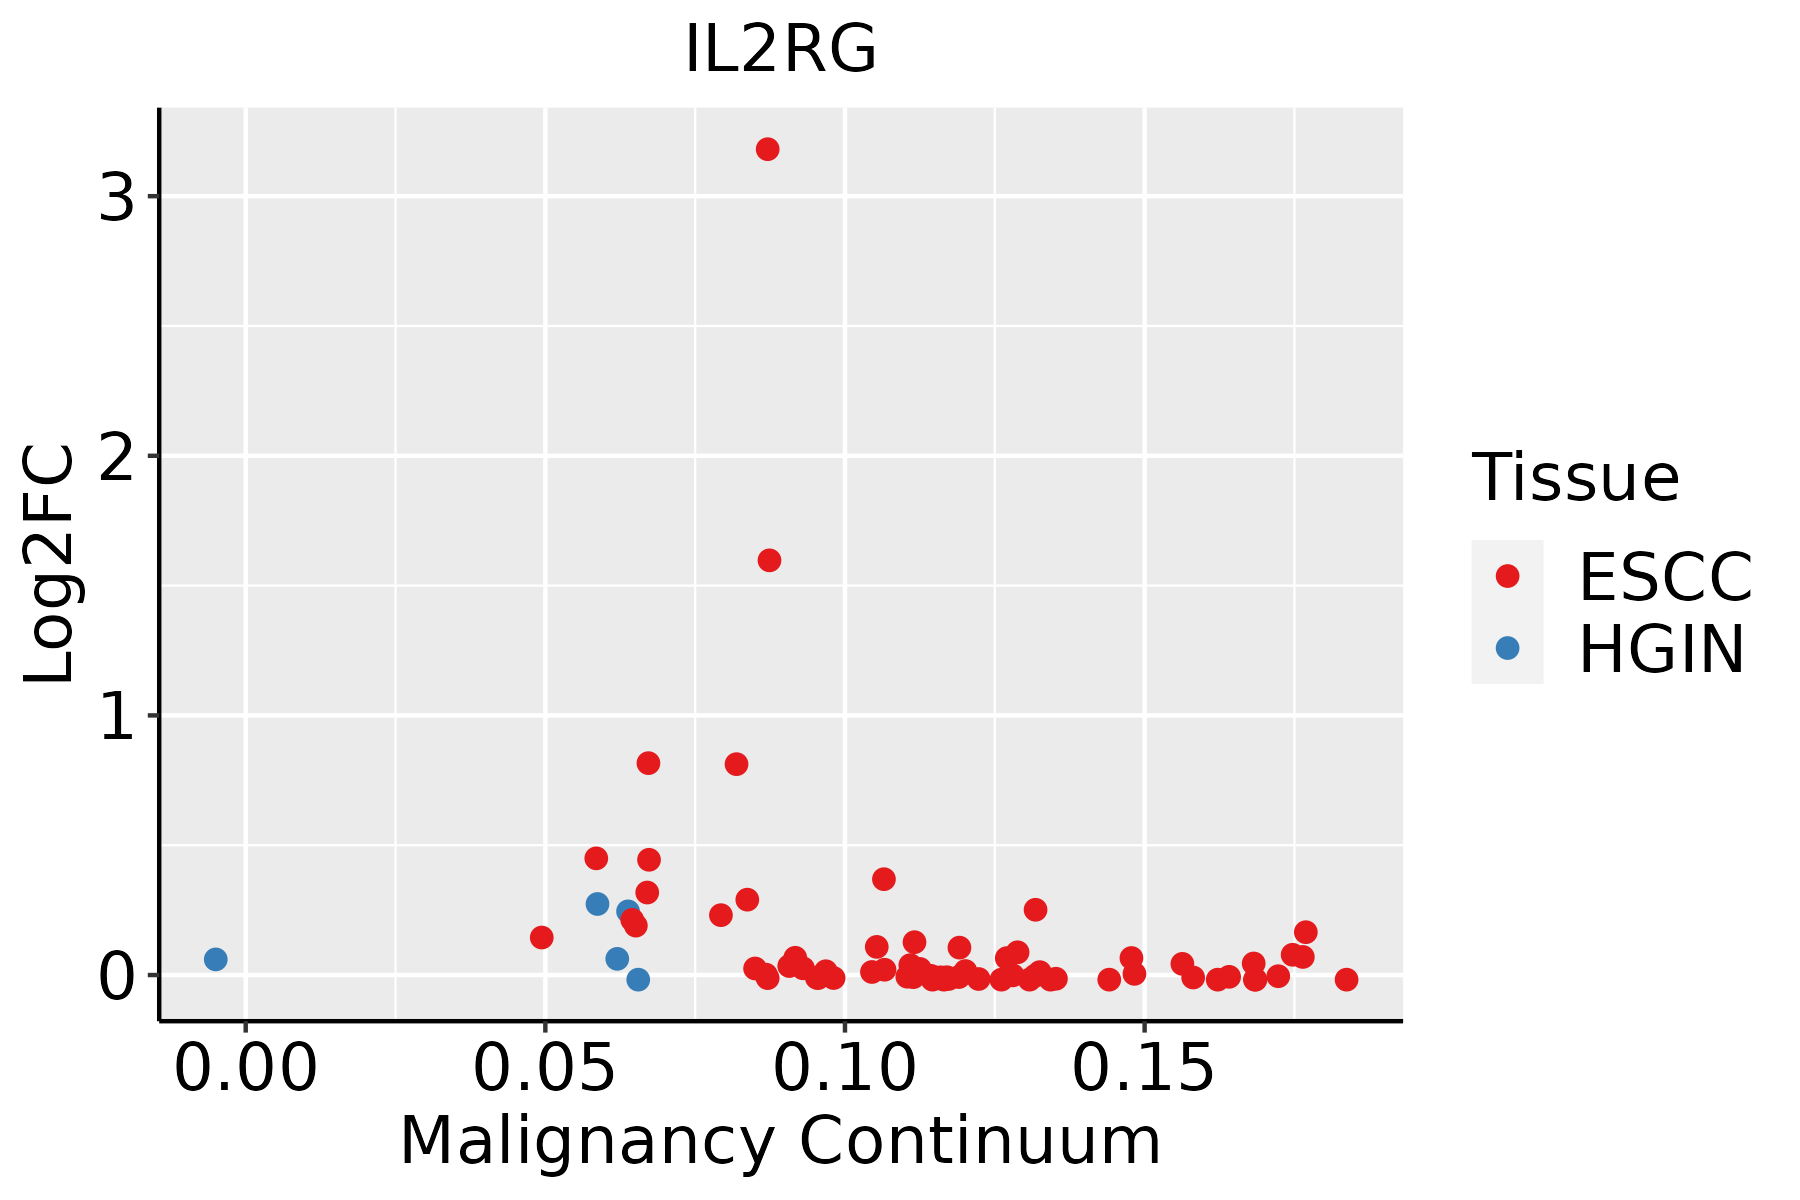 | ESCC: Esophageal squamous cell carcinoma |
| HGIN: High-grade intraepithelial neoplasias | ||
| LGIN: Low-grade intraepithelial neoplasias | ||
| Liver | 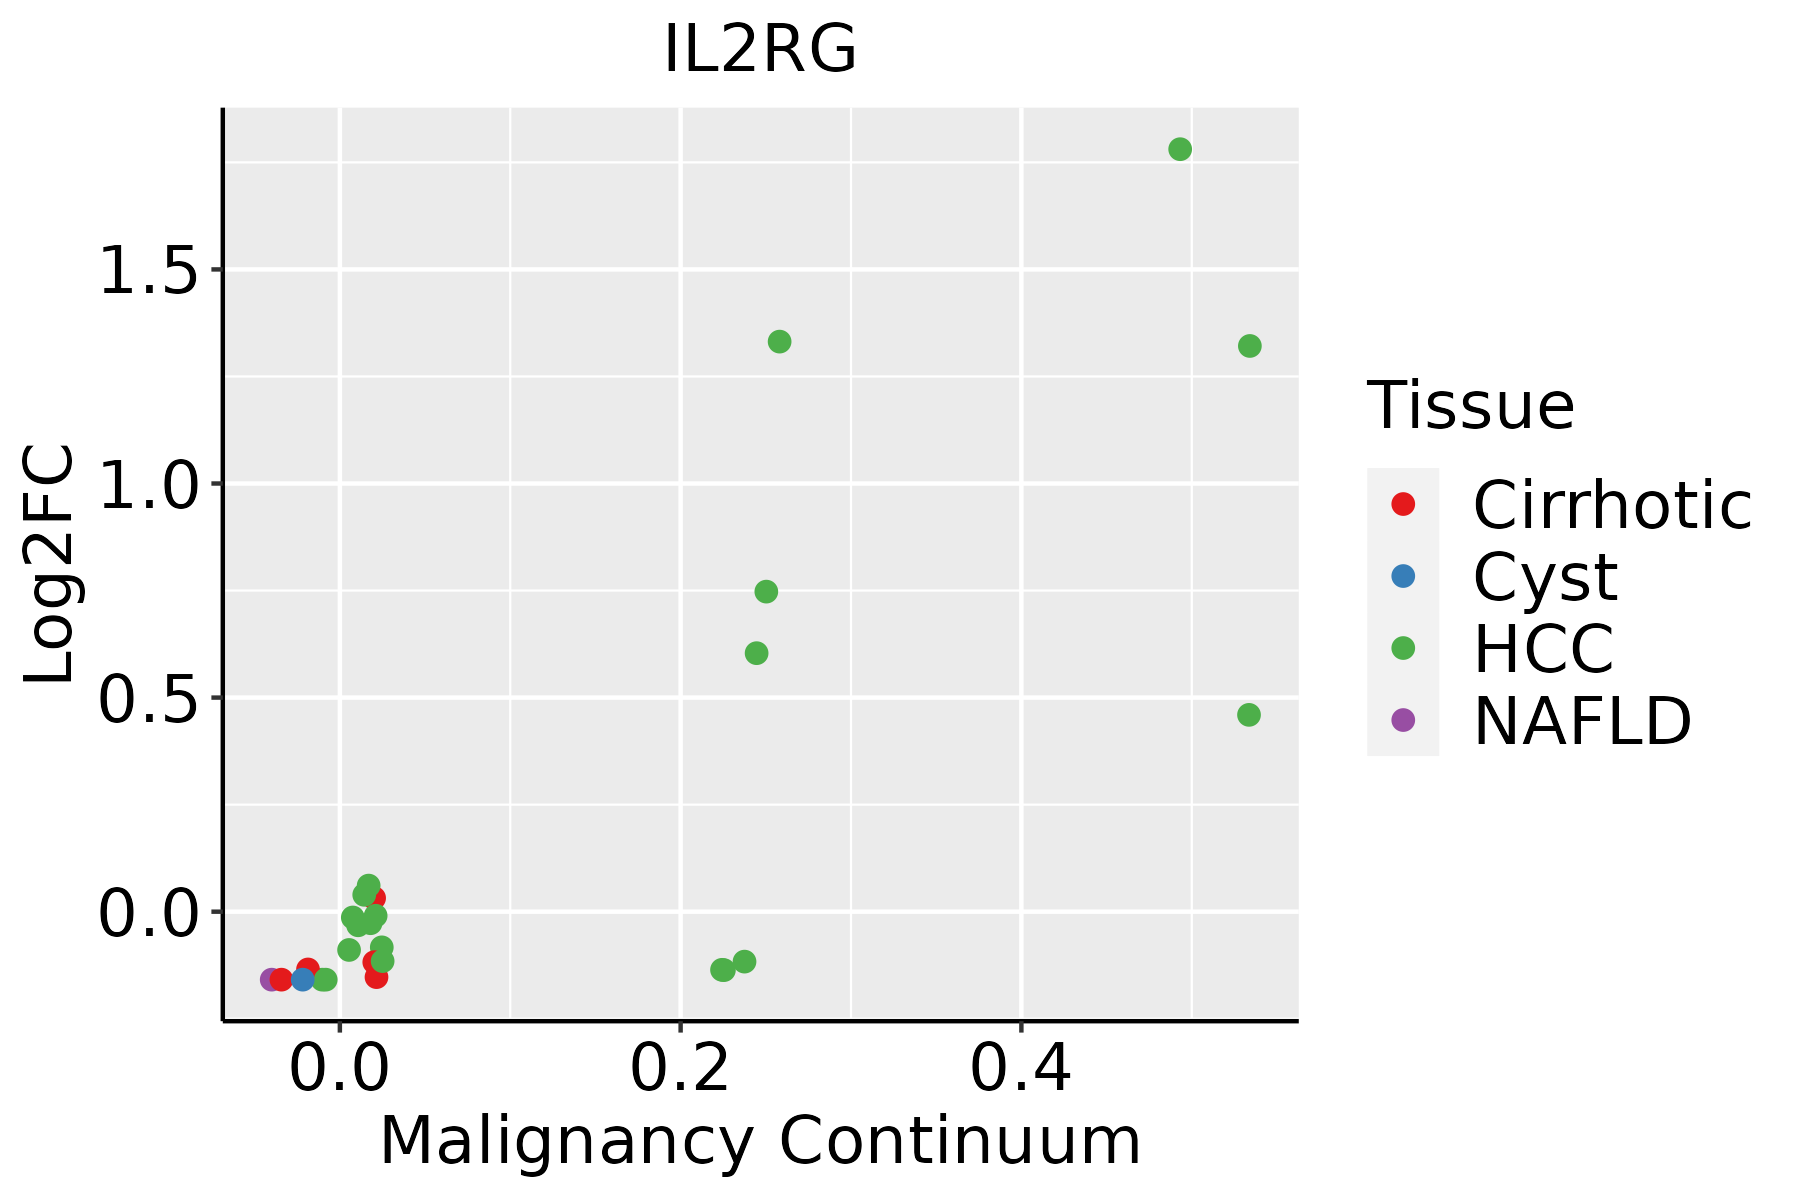 | HCC: Hepatocellular carcinoma |
| NAFLD: Non-alcoholic fatty liver disease | ||
| Oral Cavity |  | EOLP: Erosive Oral lichen planus |
| LP: leukoplakia | ||
| NEOLP: Non-erosive oral lichen planus | ||
| OSCC: Oral squamous cell carcinoma | ||
| Thyroid | 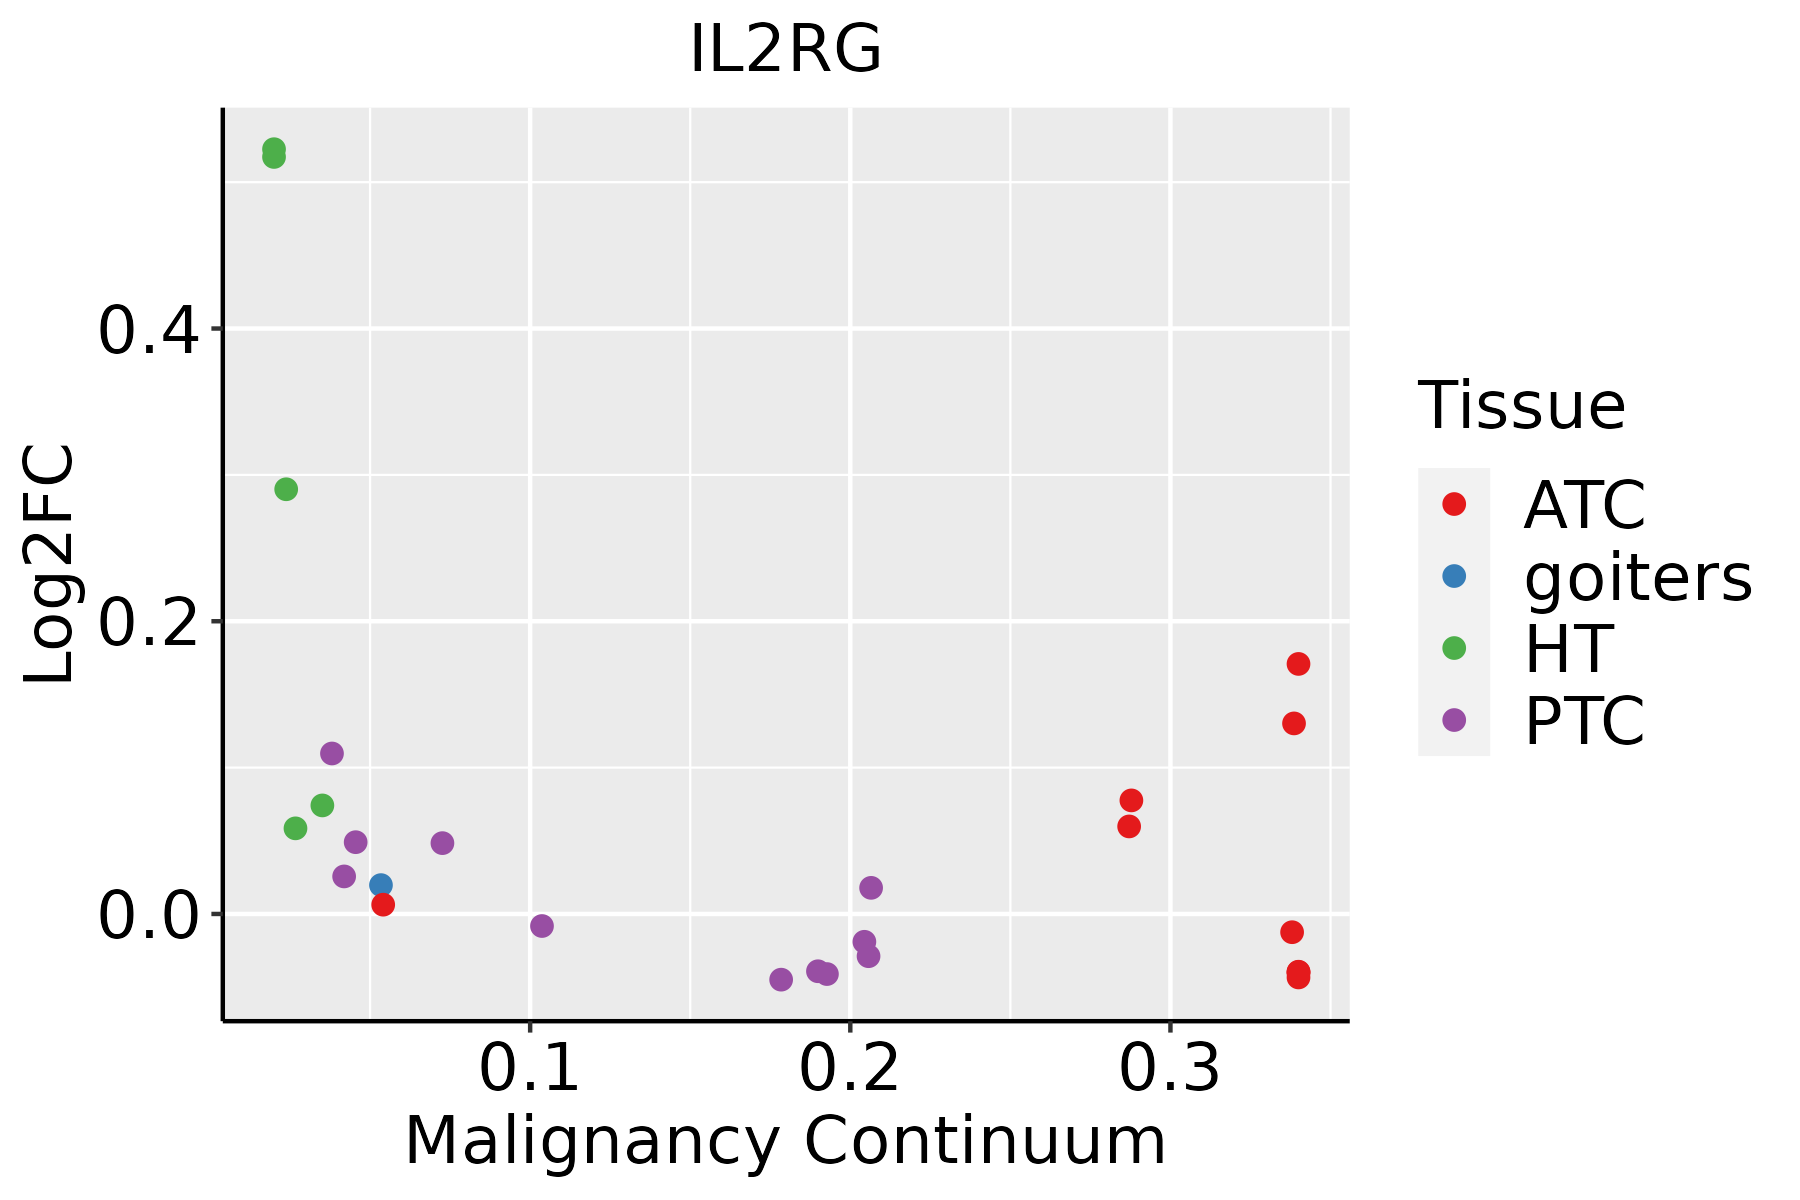 | ATC: Anaplastic thyroid cancer |
| HT: Hashimoto's thyroiditis | ||
| PTC: Papillary thyroid cancer |
| ∗log2FC in expression of this searched gene in stem-like cells from each diseased tissue sample relative to stem-like cells in normal samples in each tissue plotted against the malignancy continuum. Samples are colored based on if they are from different disease stage. |
Top |
Malignant transformation related pathway analysis |
| Find out the enriched GO biological processes and KEGG pathways involved in transition from healthy to precancer to cancer |
| Tissue | Disease Stage | Enriched GO biological Processes |
| Colorectum | AD |  |
| Colorectum | SER |  |
| Colorectum | MSS |  |
| Colorectum | MSI-H |  |
| Colorectum | FAP |  |
| ∗Top 15 enriched GO BP terms are showed in the bar plot of each disease state in each tissue. Each row represents a significant GO biological process which is colored according to the -log10(p.adjust). |
| Page: 1 2 3 4 5 6 7 8 9 |
| GO ID | Tissue | Disease Stage | Description | Gene Ratio | Bg Ratio | pvalue | p.adjust | Count |
| GO:0098760 | Colorectum | AD | response to interleukin-7 | 10/3918 | 15/18723 | 1.68e-04 | 2.29e-03 | 10 |
| GO:0098761 | Colorectum | AD | cellular response to interleukin-7 | 10/3918 | 15/18723 | 1.68e-04 | 2.29e-03 | 10 |
| GO:00987601 | Colorectum | SER | response to interleukin-7 | 8/2897 | 15/18723 | 7.51e-04 | 9.68e-03 | 8 |
| GO:00987611 | Colorectum | SER | cellular response to interleukin-7 | 8/2897 | 15/18723 | 7.51e-04 | 9.68e-03 | 8 |
| GO:00987602 | Colorectum | MSS | response to interleukin-7 | 10/3467 | 15/18723 | 5.64e-05 | 9.87e-04 | 10 |
| GO:00987612 | Colorectum | MSS | cellular response to interleukin-7 | 10/3467 | 15/18723 | 5.64e-05 | 9.87e-04 | 10 |
| GO:009876019 | Esophagus | HGIN | response to interleukin-7 | 8/2587 | 15/18723 | 3.41e-04 | 5.55e-03 | 8 |
| GO:009876119 | Esophagus | HGIN | cellular response to interleukin-7 | 8/2587 | 15/18723 | 3.41e-04 | 5.55e-03 | 8 |
| GO:0098760110 | Esophagus | ESCC | response to interleukin-7 | 14/8552 | 15/18723 | 1.47e-04 | 9.85e-04 | 14 |
| GO:0098761110 | Esophagus | ESCC | cellular response to interleukin-7 | 14/8552 | 15/18723 | 1.47e-04 | 9.85e-04 | 14 |
| GO:00987607 | Liver | Cirrhotic | response to interleukin-7 | 10/4634 | 15/18723 | 7.26e-04 | 5.36e-03 | 10 |
| GO:00987617 | Liver | Cirrhotic | cellular response to interleukin-7 | 10/4634 | 15/18723 | 7.26e-04 | 5.36e-03 | 10 |
| GO:00713532 | Liver | Cirrhotic | cellular response to interleukin-4 | 17/4634 | 33/18723 | 8.32e-04 | 6.06e-03 | 17 |
| GO:00706702 | Liver | Cirrhotic | response to interleukin-4 | 17/4634 | 36/18723 | 2.82e-03 | 1.63e-02 | 17 |
| GO:009876012 | Liver | HCC | response to interleukin-7 | 12/7958 | 15/18723 | 3.56e-03 | 1.59e-02 | 12 |
| GO:009876112 | Liver | HCC | cellular response to interleukin-7 | 12/7958 | 15/18723 | 3.56e-03 | 1.59e-02 | 12 |
| GO:007135311 | Liver | HCC | cellular response to interleukin-4 | 21/7958 | 33/18723 | 1.16e-02 | 4.28e-02 | 21 |
| GO:009876017 | Oral cavity | OSCC | response to interleukin-7 | 14/7305 | 15/18723 | 1.79e-05 | 1.74e-04 | 14 |
| GO:009876117 | Oral cavity | OSCC | cellular response to interleukin-7 | 14/7305 | 15/18723 | 1.79e-05 | 1.74e-04 | 14 |
| GO:00192214 | Oral cavity | OSCC | cytokine-mediated signaling pathway | 222/7305 | 472/18723 | 2.02e-04 | 1.35e-03 | 222 |
| Page: 1 2 |
| Pathway ID | Tissue | Disease Stage | Description | Gene Ratio | Bg Ratio | pvalue | p.adjust | qvalue | Count |
| hsa04144 | Colorectum | AD | Endocytosis | 111/2092 | 251/8465 | 5.95e-12 | 1.42e-10 | 9.08e-11 | 111 |
| hsa05166 | Colorectum | AD | Human T-cell leukemia virus 1 infection | 72/2092 | 222/8465 | 5.24e-03 | 2.44e-02 | 1.55e-02 | 72 |
| hsa041441 | Colorectum | AD | Endocytosis | 111/2092 | 251/8465 | 5.95e-12 | 1.42e-10 | 9.08e-11 | 111 |
| hsa051661 | Colorectum | AD | Human T-cell leukemia virus 1 infection | 72/2092 | 222/8465 | 5.24e-03 | 2.44e-02 | 1.55e-02 | 72 |
| hsa041442 | Colorectum | SER | Endocytosis | 81/1580 | 251/8465 | 1.14e-07 | 2.36e-06 | 1.71e-06 | 81 |
| hsa041443 | Colorectum | SER | Endocytosis | 81/1580 | 251/8465 | 1.14e-07 | 2.36e-06 | 1.71e-06 | 81 |
| hsa041444 | Colorectum | MSS | Endocytosis | 102/1875 | 251/8465 | 1.85e-11 | 4.43e-10 | 2.71e-10 | 102 |
| hsa051662 | Colorectum | MSS | Human T-cell leukemia virus 1 infection | 68/1875 | 222/8465 | 1.84e-03 | 9.61e-03 | 5.89e-03 | 68 |
| hsa041445 | Colorectum | MSS | Endocytosis | 102/1875 | 251/8465 | 1.85e-11 | 4.43e-10 | 2.71e-10 | 102 |
| hsa051663 | Colorectum | MSS | Human T-cell leukemia virus 1 infection | 68/1875 | 222/8465 | 1.84e-03 | 9.61e-03 | 5.89e-03 | 68 |
| hsa0414429 | Esophagus | HGIN | Endocytosis | 76/1383 | 251/8465 | 1.74e-08 | 3.34e-07 | 2.65e-07 | 76 |
| hsa0516639 | Esophagus | HGIN | Human T-cell leukemia virus 1 infection | 51/1383 | 222/8465 | 5.84e-03 | 4.05e-02 | 3.22e-02 | 51 |
| hsa04144113 | Esophagus | HGIN | Endocytosis | 76/1383 | 251/8465 | 1.74e-08 | 3.34e-07 | 2.65e-07 | 76 |
| hsa05166114 | Esophagus | HGIN | Human T-cell leukemia virus 1 infection | 51/1383 | 222/8465 | 5.84e-03 | 4.05e-02 | 3.22e-02 | 51 |
| hsa04144210 | Esophagus | ESCC | Endocytosis | 186/4205 | 251/8465 | 9.74e-16 | 4.66e-14 | 2.39e-14 | 186 |
| hsa05166211 | Esophagus | ESCC | Human T-cell leukemia virus 1 infection | 164/4205 | 222/8465 | 8.13e-14 | 2.09e-12 | 1.07e-12 | 164 |
| hsa051629 | Esophagus | ESCC | Measles | 90/4205 | 139/8465 | 2.16e-04 | 7.87e-04 | 4.03e-04 | 90 |
| hsa046599 | Esophagus | ESCC | Th17 cell differentiation | 68/4205 | 108/8465 | 3.53e-03 | 9.30e-03 | 4.76e-03 | 68 |
| hsa046585 | Esophagus | ESCC | Th1 and Th2 cell differentiation | 58/4205 | 92/8465 | 6.49e-03 | 1.60e-02 | 8.19e-03 | 58 |
| hsa041517 | Esophagus | ESCC | PI3K-Akt signaling pathway | 197/4205 | 354/8465 | 1.24e-02 | 2.83e-02 | 1.45e-02 | 197 |
| Page: 1 2 3 4 |
Top |
Cell-cell communication analysis |
| Identification of potential cell-cell interactions between two cell types and their ligand-receptor pairs for different disease states |
| Ligand | Receptor | LRpair | Pathway | Tissue | Disease Stage |
| IL7 | IL7R_IL2RG | IL7_IL7R_IL2RG | IL2 | Cervix | CC |
| IL7 | IL7R_IL2RG | IL7_IL7R_IL2RG | IL2 | CRC | ADJ |
| IL7 | IL7R_IL2RG | IL7_IL7R_IL2RG | IL2 | CRC | MSI-H |
| IL7 | IL7R_IL2RG | IL7_IL7R_IL2RG | IL2 | Endometrium | ADJ |
| IL7 | IL7R_IL2RG | IL7_IL7R_IL2RG | IL2 | Endometrium | AEH |
| IL7 | IL7R_IL2RG | IL7_IL7R_IL2RG | IL2 | Endometrium | EEC |
| IL7 | IL7R_IL2RG | IL7_IL7R_IL2RG | IL2 | Endometrium | Healthy |
| IL7 | IL7R_IL2RG | IL7_IL7R_IL2RG | IL2 | GC | ADJ |
| IL7 | IL7R_IL2RG | IL7_IL7R_IL2RG | IL2 | GC | GC |
| IL7 | IL7R_IL2RG | IL7_IL7R_IL2RG | IL2 | HNSCC | ADJ |
| IL7 | IL7R_IL2RG | IL7_IL7R_IL2RG | IL2 | HNSCC | Precancer |
| IL7 | IL7R_IL2RG | IL7_IL7R_IL2RG | IL2 | Liver | Healthy |
| IL7 | IL7R_IL2RG | IL7_IL7R_IL2RG | IL2 | Lung | AAH |
| IL7 | IL7R_IL2RG | IL7_IL7R_IL2RG | IL2 | Lung | ADJ |
| IL7 | IL7R_IL2RG | IL7_IL7R_IL2RG | IL2 | Lung | AIS |
| IL7 | IL7R_IL2RG | IL7_IL7R_IL2RG | IL2 | Lung | IAC |
| IL7 | IL7R_IL2RG | IL7_IL7R_IL2RG | IL2 | Lung | MIAC |
| IL7 | IL7R_IL2RG | IL7_IL7R_IL2RG | IL2 | Lung | Precancer |
| IL7 | IL7R_IL2RG | IL7_IL7R_IL2RG | IL2 | Skin | AK |
| Page: 1 |
Top |
Single-cell gene regulatory network inference analysis |
| Find out the significant the regulons (TFs) and the target genes of each regulon across cell types for different disease states |
| TF | Cell Type | Tissue | Disease Stage | Target Gene | RSS | Regulon Activity |
| ∗The dot plots of a searched regulon are shown for all cell subpopulations in each disease state of each tissue based on the regulon specific score inferred using pySCENIC and by calculating the average expression. |
| Page: 1 |
Top |
Somatic mutation of malignant transformation related genes |
| Annotation of somatic variants for genes involved in malignant transformation |
| Hugo Symbol | Variant Class | Variant Classification | dbSNP RS | HGVSc | HGVSp | HGVSp Short | SWISSPROT | BIOTYPE | SIFT | PolyPhen | Tumor Sample Barcode | Tissue | Histology | Sex | Age | Stage | Therapy Types | Drugs | Outcome |
| IL2RG | SNV | Missense_Mutation | c.266A>T | p.Tyr89Phe | p.Y89F | P31785 | protein_coding | deleterious(0.02) | probably_damaging(0.959) | TCGA-A2-A0EN-01 | Breast | breast invasive carcinoma | Female | >=65 | I/II | Hormone Therapy | tamoxiphen | SD | |
| IL2RG | SNV | Missense_Mutation | c.788N>C | p.Val263Ala | p.V263A | P31785 | protein_coding | deleterious(0.04) | probably_damaging(0.991) | TCGA-D8-A1XK-01 | Breast | breast invasive carcinoma | Female | <65 | I/II | Chemotherapy | doxorubicine+cyclophosphamide | SD | |
| IL2RG | insertion | Frame_Shift_Ins | rs745545309 | c.1082_1083insC | p.Cys362MetfsTer7 | p.C362Mfs*7 | P31785 | protein_coding | TCGA-BH-A0BR-01 | Breast | breast invasive carcinoma | Female | <65 | I/II | Unknown | Unknown | SD | ||
| IL2RG | SNV | Missense_Mutation | c.1036N>T | p.Pro346Ser | p.P346S | P31785 | protein_coding | tolerated_low_confidence(0.14) | benign(0.003) | TCGA-2W-A8YY-01 | Cervix | cervical & endocervical cancer | Female | <65 | I/II | Chemotherapy | cisplatin | CR | |
| IL2RG | SNV | Missense_Mutation | c.665G>A | p.Arg222His | p.R222H | P31785 | protein_coding | tolerated(0.36) | benign(0.314) | TCGA-AY-6386-01 | Colorectum | colon adenocarcinoma | Female | >=65 | III/IV | Chemotherapy | 5-fu | SD | |
| IL2RG | SNV | Missense_Mutation | novel | c.448A>C | p.Asn150His | p.N150H | P31785 | protein_coding | deleterious(0.01) | possibly_damaging(0.898) | TCGA-CA-6717-01 | Colorectum | colon adenocarcinoma | Male | <65 | I/II | Chemotherapy | oxaliplatin | CR |
| IL2RG | SNV | Missense_Mutation | c.994G>A | p.Val332Ile | p.V332I | P31785 | protein_coding | deleterious(0.03) | probably_damaging(0.992) | TCGA-CK-5916-01 | Colorectum | colon adenocarcinoma | Female | >=65 | I/II | Unknown | Unknown | PD | |
| IL2RG | SNV | Missense_Mutation | c.597A>T | p.Glu199Asp | p.E199D | P31785 | protein_coding | tolerated(0.07) | benign(0.232) | TCGA-F4-6570-01 | Colorectum | colon adenocarcinoma | Female | >=65 | I/II | Unknown | Unknown | SD | |
| IL2RG | SNV | Missense_Mutation | novel | c.841T>G | p.Phe281Val | p.F281V | P31785 | protein_coding | tolerated(0.77) | benign(0) | TCGA-EI-6917-01 | Colorectum | rectum adenocarcinoma | Male | <65 | III/IV | Chemotherapy | 5fluorouracil+oxaciplatina+l-folinian | SD |
| IL2RG | SNV | Missense_Mutation | rs767758983 | c.857N>T | p.Thr286Met | p.T286M | P31785 | protein_coding | tolerated(0.09) | benign(0.226) | TCGA-A5-A0G2-01 | Endometrium | uterine corpus endometrioid carcinoma | Female | <65 | III/IV | Unknown | Unknown | SD |
| Page: 1 2 3 4 5 |
Top |
Related drugs of malignant transformation related genes |
| Identification of chemicals and drugs interact with genes involved in malignant transfromation |
| (DGIdb 4.0) |
| Entrez ID | Symbol | Category | Interaction Types | Drug Claim Name | Drug Name | PMIDs |
| 3561 | IL2RG | CELL SURFACE, EXTERNAL SIDE OF PLASMA MEMBRANE, DRUGGABLE GENOME | CHEMBL1201550 | DENILEUKIN DIFTITOX | ||
| 3561 | IL2RG | CELL SURFACE, EXTERNAL SIDE OF PLASMA MEMBRANE, DRUGGABLE GENOME | inhibitor | CHEMBL1201605 | DACLIZUMAB | |
| 3561 | IL2RG | CELL SURFACE, EXTERNAL SIDE OF PLASMA MEMBRANE, DRUGGABLE GENOME | INTERLEUKIN-2 EXPRESSING PLASMID | |||
| 3561 | IL2RG | CELL SURFACE, EXTERNAL SIDE OF PLASMA MEMBRANE, DRUGGABLE GENOME | agonist | CHEMBL1201438 | ALDESLEUKIN | |
| 3561 | IL2RG | CELL SURFACE, EXTERNAL SIDE OF PLASMA MEMBRANE, DRUGGABLE GENOME | ALDESLEUKIN | ALDESLEUKIN | ||
| 3561 | IL2RG | CELL SURFACE, EXTERNAL SIDE OF PLASMA MEMBRANE, DRUGGABLE GENOME | DENILEUKIN DIFTITOX | |||
| 3561 | IL2RG | CELL SURFACE, EXTERNAL SIDE OF PLASMA MEMBRANE, DRUGGABLE GENOME | CYT-107 | |||
| 3561 | IL2RG | CELL SURFACE, EXTERNAL SIDE OF PLASMA MEMBRANE, DRUGGABLE GENOME | IL-2 | ALDESLEUKIN | ||
| 3561 | IL2RG | CELL SURFACE, EXTERNAL SIDE OF PLASMA MEMBRANE, DRUGGABLE GENOME | INTERLEUKIN 2 | |||
| 3561 | IL2RG | CELL SURFACE, EXTERNAL SIDE OF PLASMA MEMBRANE, DRUGGABLE GENOME | ALDESLEUKIN | ALDESLEUKIN |
| Page: 1 2 |

Copyright 2023-Present -The University of Texas Health Science Center at Houston |