
|
|||||
|
 | |
| |
| |
| |
| |
| |
|
Gene: IL27RA |
Gene summary for IL27RA |
| Gene information | Species | Human | Gene symbol | IL27RA | Gene ID | 9466 |
| Gene name | interleukin 27 receptor subunit alpha | |
| Gene Alias | CRL1 | |
| Cytomap | 19p13.12 | |
| Gene Type | protein-coding | GO ID | GO:0000018 | UniProtAcc | Q6UWB1 |
Top |
Malignant transformation analysis |
| Identification of the aberrant gene expression in precancerous and cancerous lesions by comparing the gene expression of stem-like cells in diseased tissues with normal stem cells |
| Entrez ID | Symbol | Replicates | Species | Organ | Tissue | Adj P-value | Log2FC | Malignancy |
| 9466 | IL27RA | LZE7T | Human | Esophagus | ESCC | 5.14e-06 | 3.01e-01 | 0.0667 |
| 9466 | IL27RA | LZE8T | Human | Esophagus | ESCC | 8.35e-04 | 2.27e-01 | 0.067 |
| 9466 | IL27RA | LZE21T | Human | Esophagus | ESCC | 2.10e-06 | 4.32e-01 | 0.0655 |
| 9466 | IL27RA | LZE6T | Human | Esophagus | ESCC | 2.53e-04 | 2.79e-01 | 0.0845 |
| 9466 | IL27RA | P2T-E | Human | Esophagus | ESCC | 2.87e-41 | 5.86e-01 | 0.1177 |
| 9466 | IL27RA | P4T-E | Human | Esophagus | ESCC | 2.08e-24 | 5.73e-01 | 0.1323 |
| 9466 | IL27RA | P5T-E | Human | Esophagus | ESCC | 9.67e-18 | 3.28e-01 | 0.1327 |
| 9466 | IL27RA | P11T-E | Human | Esophagus | ESCC | 5.32e-05 | 2.49e-01 | 0.1426 |
| 9466 | IL27RA | P12T-E | Human | Esophagus | ESCC | 9.02e-11 | 1.96e-01 | 0.1122 |
| 9466 | IL27RA | P15T-E | Human | Esophagus | ESCC | 5.39e-06 | 1.41e-01 | 0.1149 |
| 9466 | IL27RA | P16T-E | Human | Esophagus | ESCC | 3.90e-42 | 6.97e-01 | 0.1153 |
| 9466 | IL27RA | P17T-E | Human | Esophagus | ESCC | 1.59e-04 | 2.68e-01 | 0.1278 |
| 9466 | IL27RA | P20T-E | Human | Esophagus | ESCC | 1.16e-03 | 7.80e-02 | 0.1124 |
| 9466 | IL27RA | P21T-E | Human | Esophagus | ESCC | 9.74e-22 | 4.33e-01 | 0.1617 |
| 9466 | IL27RA | P22T-E | Human | Esophagus | ESCC | 9.56e-08 | 1.61e-01 | 0.1236 |
| 9466 | IL27RA | P23T-E | Human | Esophagus | ESCC | 3.17e-06 | 2.53e-01 | 0.108 |
| 9466 | IL27RA | P24T-E | Human | Esophagus | ESCC | 4.31e-06 | 1.75e-01 | 0.1287 |
| 9466 | IL27RA | P26T-E | Human | Esophagus | ESCC | 4.44e-08 | 2.18e-01 | 0.1276 |
| 9466 | IL27RA | P27T-E | Human | Esophagus | ESCC | 2.41e-29 | 5.26e-01 | 0.1055 |
| 9466 | IL27RA | P28T-E | Human | Esophagus | ESCC | 9.44e-07 | 1.65e-01 | 0.1149 |
| Page: 1 2 3 |
| Tissue | Expression Dynamics | Abbreviation |
| Esophagus | 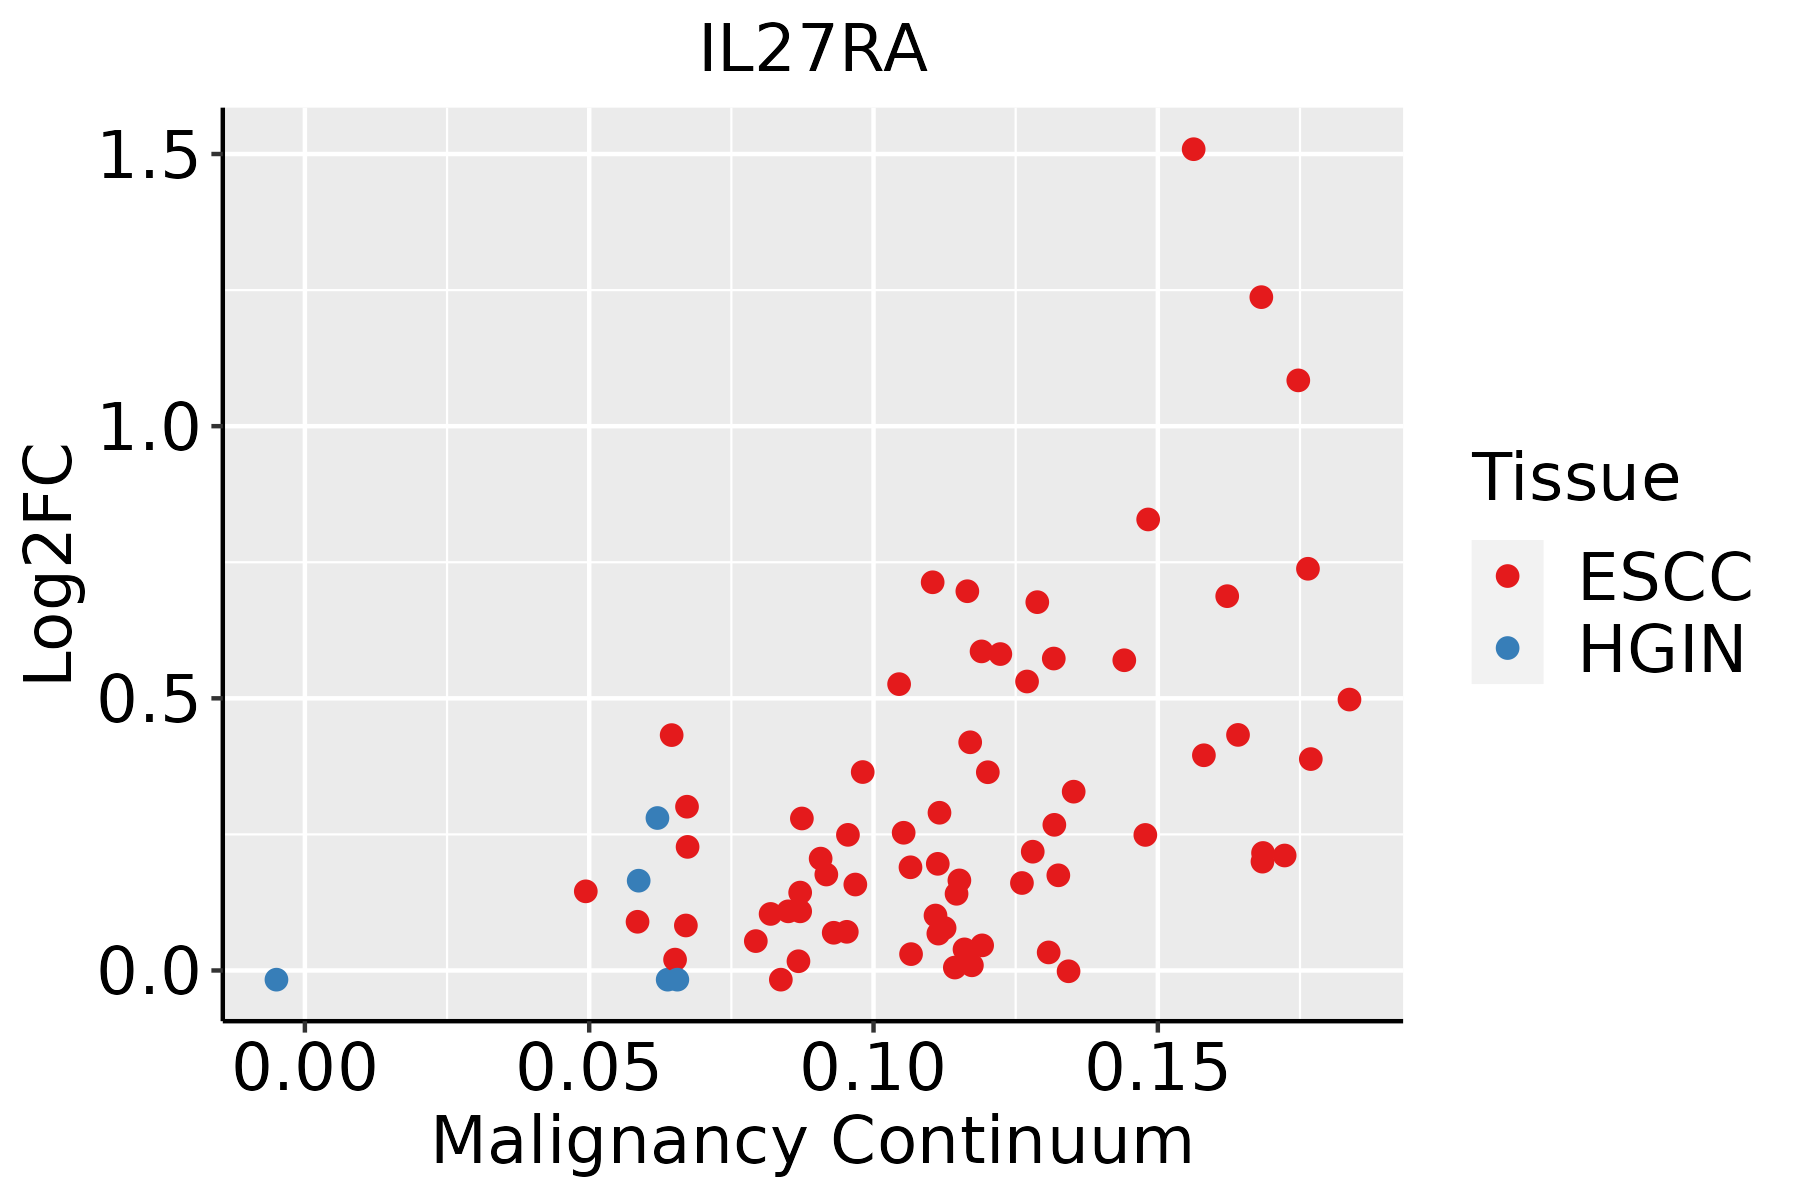 | ESCC: Esophageal squamous cell carcinoma |
| HGIN: High-grade intraepithelial neoplasias | ||
| LGIN: Low-grade intraepithelial neoplasias | ||
| Oral Cavity | 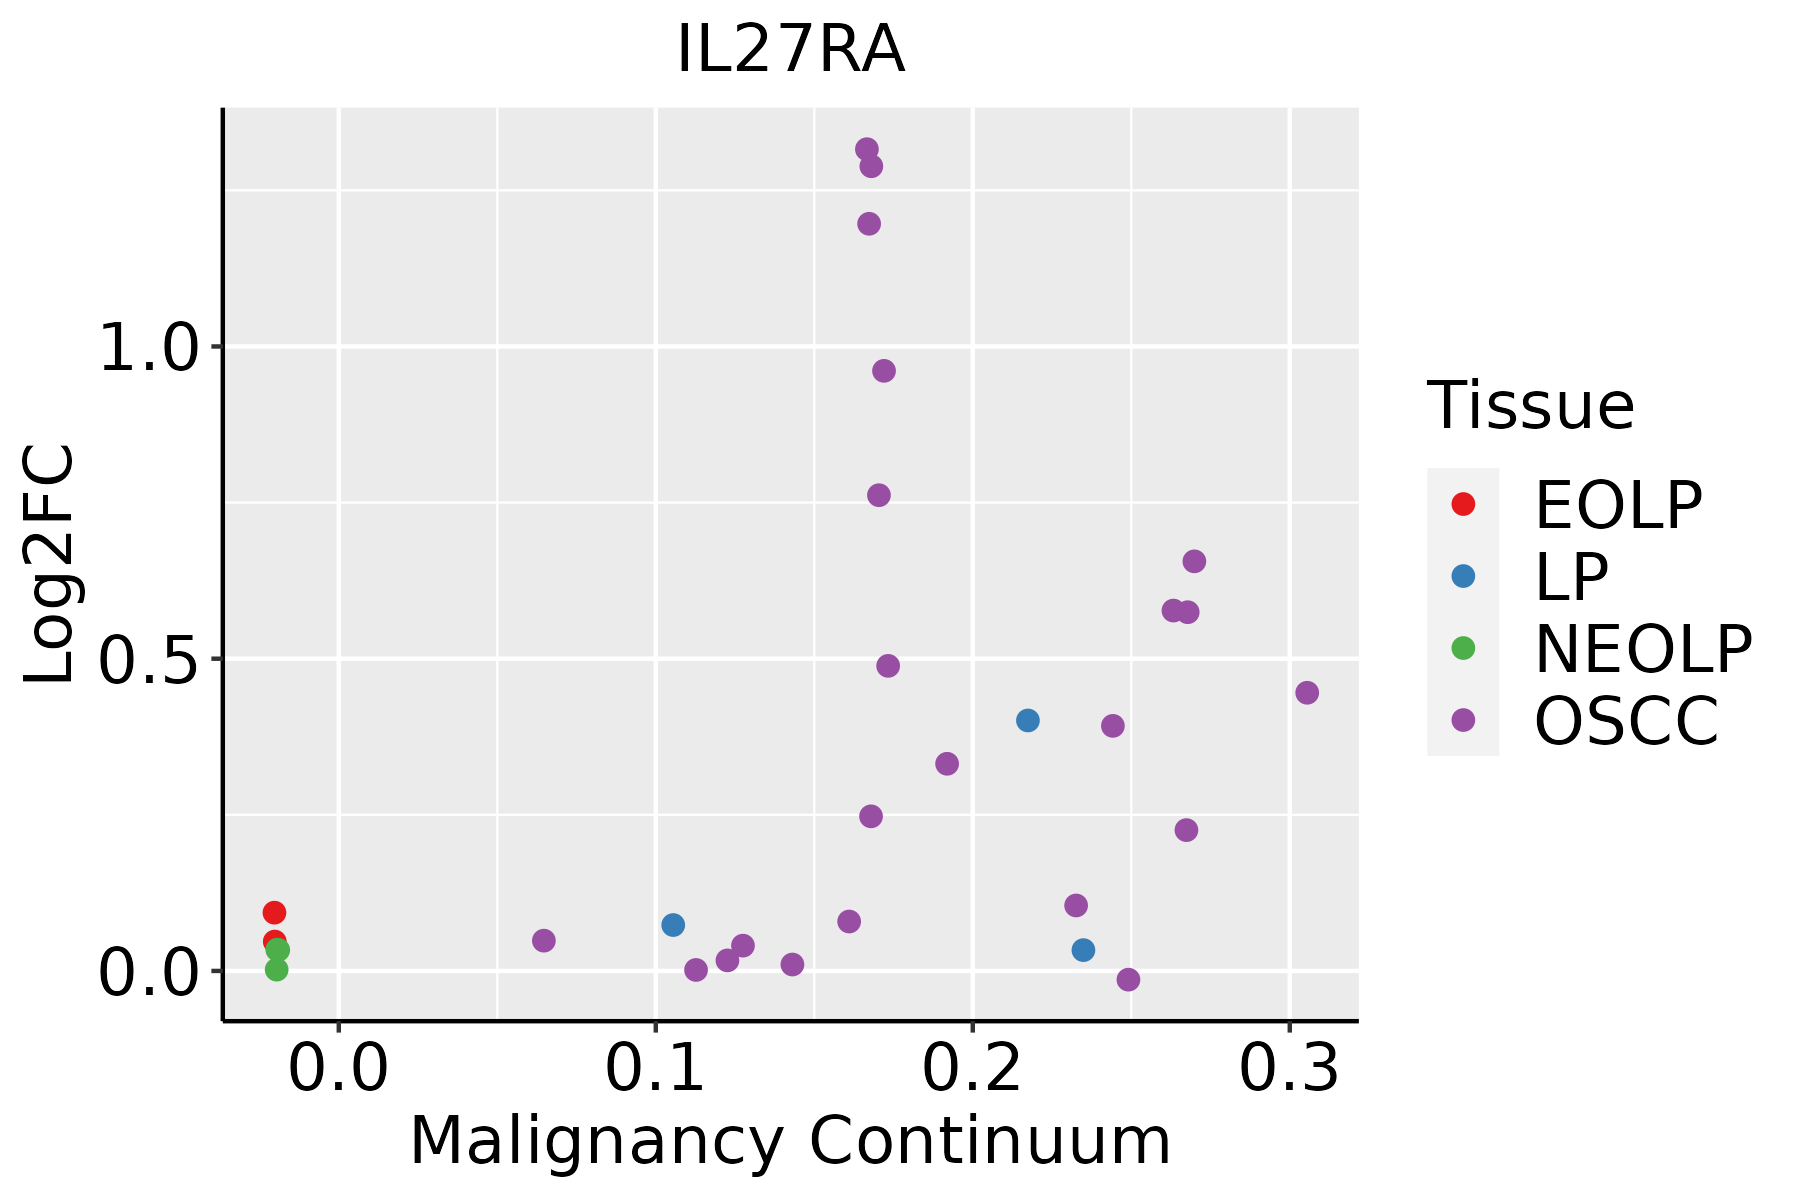 | EOLP: Erosive Oral lichen planus |
| LP: leukoplakia | ||
| NEOLP: Non-erosive oral lichen planus | ||
| OSCC: Oral squamous cell carcinoma |
| ∗log2FC in expression of this searched gene in stem-like cells from each diseased tissue sample relative to stem-like cells in normal samples in each tissue plotted against the malignancy continuum. Samples are colored based on if they are from different disease stage. |
Top |
Malignant transformation related pathway analysis |
| Find out the enriched GO biological processes and KEGG pathways involved in transition from healthy to precancer to cancer |
| Tissue | Disease Stage | Enriched GO biological Processes |
| Colorectum | AD |  |
| Colorectum | SER |  |
| Colorectum | MSS |  |
| Colorectum | MSI-H |  |
| Colorectum | FAP |  |
| ∗Top 15 enriched GO BP terms are showed in the bar plot of each disease state in each tissue. Each row represents a significant GO biological process which is colored according to the -log10(p.adjust). |
| Page: 1 2 3 4 5 6 7 8 9 |
| GO ID | Tissue | Disease Stage | Description | Gene Ratio | Bg Ratio | pvalue | p.adjust | Count |
| GO:005105215 | Esophagus | ESCC | regulation of DNA metabolic process | 232/8552 | 359/18723 | 2.40e-13 | 1.13e-11 | 232 |
| GO:004578527 | Esophagus | ESCC | positive regulation of cell adhesion | 255/8552 | 437/18723 | 5.07e-08 | 9.11e-07 | 255 |
| GO:00507775 | Esophagus | ESCC | negative regulation of immune response | 112/8552 | 194/18723 | 4.67e-04 | 2.62e-03 | 112 |
| GO:00063101 | Esophagus | ESCC | DNA recombination | 168/8552 | 305/18723 | 5.58e-04 | 3.05e-03 | 168 |
| GO:002240720 | Esophagus | ESCC | regulation of cell-cell adhesion | 239/8552 | 448/18723 | 5.88e-04 | 3.19e-03 | 239 |
| GO:000268316 | Esophagus | ESCC | negative regulation of immune system process | 231/8552 | 434/18723 | 8.48e-04 | 4.36e-03 | 231 |
| GO:00025622 | Esophagus | ESCC | somatic diversification of immune receptors via germline recombination within a single locus | 43/8552 | 66/18723 | 1.10e-03 | 5.53e-03 | 43 |
| GO:00164442 | Esophagus | ESCC | somatic cell DNA recombination | 43/8552 | 66/18723 | 1.10e-03 | 5.53e-03 | 43 |
| GO:00164472 | Esophagus | ESCC | somatic recombination of immunoglobulin gene segments | 38/8552 | 57/18723 | 1.11e-03 | 5.56e-03 | 38 |
| GO:00022003 | Esophagus | ESCC | somatic diversification of immune receptors | 49/8552 | 77/18723 | 1.12e-03 | 5.60e-03 | 49 |
| GO:004211018 | Esophagus | ESCC | T cell activation | 256/8552 | 487/18723 | 1.18e-03 | 5.87e-03 | 256 |
| GO:002240919 | Esophagus | ESCC | positive regulation of cell-cell adhesion | 155/8552 | 284/18723 | 1.50e-03 | 7.06e-03 | 155 |
| GO:00164452 | Esophagus | ESCC | somatic diversification of immunoglobulins | 43/8552 | 67/18723 | 1.73e-03 | 7.97e-03 | 43 |
| GO:000181916 | Esophagus | ESCC | positive regulation of cytokine production | 244/8552 | 467/18723 | 2.29e-03 | 1.01e-02 | 244 |
| GO:00023815 | Esophagus | ESCC | immunoglobulin production involved in immunoglobulin-mediated immune response | 44/8552 | 70/18723 | 2.80e-03 | 1.19e-02 | 44 |
| GO:005087015 | Esophagus | ESCC | positive regulation of T cell activation | 117/8552 | 216/18723 | 7.23e-03 | 2.62e-02 | 117 |
| GO:000268515 | Esophagus | ESCC | regulation of leukocyte migration | 114/8552 | 210/18723 | 7.26e-03 | 2.63e-02 | 114 |
| GO:190303916 | Esophagus | ESCC | positive regulation of leukocyte cell-cell adhesion | 128/8552 | 239/18723 | 8.40e-03 | 2.96e-02 | 128 |
| GO:0002204 | Esophagus | ESCC | somatic recombination of immunoglobulin genes involved in immune response | 31/8552 | 49/18723 | 9.89e-03 | 3.40e-02 | 31 |
| GO:0002208 | Esophagus | ESCC | somatic diversification of immunoglobulins involved in immune response | 31/8552 | 49/18723 | 9.89e-03 | 3.40e-02 | 31 |
| Page: 1 2 3 |
| Pathway ID | Tissue | Disease Stage | Description | Gene Ratio | Bg Ratio | pvalue | p.adjust | qvalue | Count |
| hsa046599 | Esophagus | ESCC | Th17 cell differentiation | 68/4205 | 108/8465 | 3.53e-03 | 9.30e-03 | 4.76e-03 | 68 |
| hsa0465914 | Esophagus | ESCC | Th17 cell differentiation | 68/4205 | 108/8465 | 3.53e-03 | 9.30e-03 | 4.76e-03 | 68 |
| hsa046598 | Oral cavity | OSCC | Th17 cell differentiation | 65/3704 | 108/8465 | 4.02e-04 | 1.25e-03 | 6.35e-04 | 65 |
| hsa0465913 | Oral cavity | OSCC | Th17 cell differentiation | 65/3704 | 108/8465 | 4.02e-04 | 1.25e-03 | 6.35e-04 | 65 |
| Page: 1 |
Top |
Cell-cell communication analysis |
| Identification of potential cell-cell interactions between two cell types and their ligand-receptor pairs for different disease states |
| Ligand | Receptor | LRpair | Pathway | Tissue | Disease Stage |
| Page: 1 |
Top |
Single-cell gene regulatory network inference analysis |
| Find out the significant the regulons (TFs) and the target genes of each regulon across cell types for different disease states |
| TF | Cell Type | Tissue | Disease Stage | Target Gene | RSS | Regulon Activity |
| ∗The dot plots of a searched regulon are shown for all cell subpopulations in each disease state of each tissue based on the regulon specific score inferred using pySCENIC and by calculating the average expression. |
| Page: 1 |
Top |
Somatic mutation of malignant transformation related genes |
| Annotation of somatic variants for genes involved in malignant transformation |
| Hugo Symbol | Variant Class | Variant Classification | dbSNP RS | HGVSc | HGVSp | HGVSp Short | SWISSPROT | BIOTYPE | SIFT | PolyPhen | Tumor Sample Barcode | Tissue | Histology | Sex | Age | Stage | Therapy Types | Drugs | Outcome |
| IL27RA | SNV | Missense_Mutation | c.109N>T | p.Gly37Trp | p.G37W | Q6UWB1 | protein_coding | deleterious(0) | probably_damaging(0.92) | TCGA-A7-A0DB-01 | Breast | breast invasive carcinoma | Female | <65 | I/II | Hormone Therapy | arimidex | SD | |
| IL27RA | SNV | Missense_Mutation | novel | c.1741N>T | p.Gly581Trp | p.G581W | Q6UWB1 | protein_coding | deleterious(0.03) | possibly_damaging(0.908) | TCGA-A7-A0DB-01 | Breast | breast invasive carcinoma | Female | <65 | I/II | Hormone Therapy | arimidex | SD |
| IL27RA | SNV | Missense_Mutation | rs374355041 | c.281N>A | p.Arg94Gln | p.R94Q | Q6UWB1 | protein_coding | tolerated(0.06) | probably_damaging(0.997) | TCGA-A7-A4SB-01 | Breast | breast invasive carcinoma | Female | <65 | III/IV | Chemotherapy | docetaxel | CR |
| IL27RA | SNV | Missense_Mutation | c.107C>G | p.Ala36Gly | p.A36G | Q6UWB1 | protein_coding | tolerated(0.05) | benign(0.05) | TCGA-A8-A08B-01 | Breast | breast invasive carcinoma | Female | <65 | I/II | Chemotherapy | 5-fluorouracil | CR | |
| IL27RA | SNV | Missense_Mutation | c.1519N>T | p.His507Tyr | p.H507Y | Q6UWB1 | protein_coding | tolerated(0.12) | benign(0.006) | TCGA-A8-A094-01 | Breast | breast invasive carcinoma | Female | >=65 | I/II | Unknown | Unknown | SD | |
| IL27RA | SNV | Missense_Mutation | rs767019763 | c.1477N>G | p.Thr493Ala | p.T493A | Q6UWB1 | protein_coding | deleterious(0) | possibly_damaging(0.787) | TCGA-AN-A046-01 | Breast | breast invasive carcinoma | Female | >=65 | I/II | Unknown | Unknown | SD |
| IL27RA | SNV | Missense_Mutation | c.169C>G | p.Leu57Val | p.L57V | Q6UWB1 | protein_coding | tolerated(0.44) | benign(0.001) | TCGA-AO-A0J9-01 | Breast | breast invasive carcinoma | Female | <65 | III/IV | Chemotherapy | cyclophosphamide | PD | |
| IL27RA | SNV | Missense_Mutation | novel | c.59N>C | p.Leu20Pro | p.L20P | Q6UWB1 | protein_coding | deleterious(0) | possibly_damaging(0.725) | TCGA-C8-A3M7-01 | Breast | breast invasive carcinoma | Female | <65 | III/IV | Unknown | Unknown | PD |
| IL27RA | SNV | Missense_Mutation | novel | c.400N>C | p.Gly134Arg | p.G134R | Q6UWB1 | protein_coding | tolerated(0.35) | benign(0.035) | TCGA-E2-A15P-01 | Breast | breast invasive carcinoma | Female | <65 | I/II | Hormone Therapy | arimidex | SD |
| IL27RA | SNV | Missense_Mutation | c.404C>G | p.Pro135Arg | p.P135R | Q6UWB1 | protein_coding | deleterious(0.01) | possibly_damaging(0.823) | TCGA-E2-A1L6-01 | Breast | breast invasive carcinoma | Female | <65 | I/II | Chemotherapy | cyclophosphamide | SD |
| Page: 1 2 3 4 5 6 7 |
Top |
Related drugs of malignant transformation related genes |
| Identification of chemicals and drugs interact with genes involved in malignant transfromation |
| (DGIdb 4.0) |
| Entrez ID | Symbol | Category | Interaction Types | Drug Claim Name | Drug Name | PMIDs |
| Page: 1 |

Copyright 2023-Present -The University of Texas Health Science Center at Houston |