
|
|||||
|
 | |
| |
| |
| |
| |
| |
|
Gene: IL24 |
Gene summary for IL24 |
| Gene information | Species | Human | Gene symbol | IL24 | Gene ID | 11009 |
| Gene name | interleukin 24 | |
| Gene Alias | C49A | |
| Cytomap | 1q32.1 | |
| Gene Type | protein-coding | GO ID | GO:0001932 | UniProtAcc | Q13007 |
Top |
Malignant transformation analysis |
| Identification of the aberrant gene expression in precancerous and cancerous lesions by comparing the gene expression of stem-like cells in diseased tissues with normal stem cells |
| Entrez ID | Symbol | Replicates | Species | Organ | Tissue | Adj P-value | Log2FC | Malignancy |
| 11009 | IL24 | P17T-E | Human | Esophagus | ESCC | 2.68e-03 | 2.52e-01 | 0.1278 |
| 11009 | IL24 | P19T-E | Human | Esophagus | ESCC | 1.17e-11 | 3.39e+00 | 0.1662 |
| 11009 | IL24 | P37T-E | Human | Esophagus | ESCC | 1.83e-06 | 1.15e+00 | 0.1371 |
| 11009 | IL24 | P38T-E | Human | Esophagus | ESCC | 1.45e-09 | 1.14e+00 | 0.127 |
| 11009 | IL24 | P61T-E | Human | Esophagus | ESCC | 3.65e-02 | 3.69e-01 | 0.099 |
| 11009 | IL24 | P89T-E | Human | Esophagus | ESCC | 6.22e-10 | 2.84e+00 | 0.1752 |
| 11009 | IL24 | P107T-E | Human | Esophagus | ESCC | 1.33e-26 | 3.21e+00 | 0.171 |
| 11009 | IL24 | C04 | Human | Oral cavity | OSCC | 9.68e-14 | 1.68e+00 | 0.2633 |
| 11009 | IL24 | C21 | Human | Oral cavity | OSCC | 1.12e-25 | 1.46e+00 | 0.2678 |
| 11009 | IL24 | C51 | Human | Oral cavity | OSCC | 5.33e-08 | 1.32e+00 | 0.2674 |
| 11009 | IL24 | LP15 | Human | Oral cavity | LP | 4.58e-04 | 5.07e-01 | 0.2174 |
| 11009 | IL24 | SYSMH3 | Human | Oral cavity | OSCC | 4.32e-07 | 4.19e-01 | 0.2442 |
| 11009 | IL24 | SYSMH5 | Human | Oral cavity | OSCC | 7.87e-03 | 1.79e-01 | 0.0647 |
| 11009 | IL24 | P10_cSCC | Human | Skin | cSCC | 2.45e-31 | 2.35e+00 | 0.1017 |
| Page: 1 |
| Tissue | Expression Dynamics | Abbreviation |
| Esophagus | 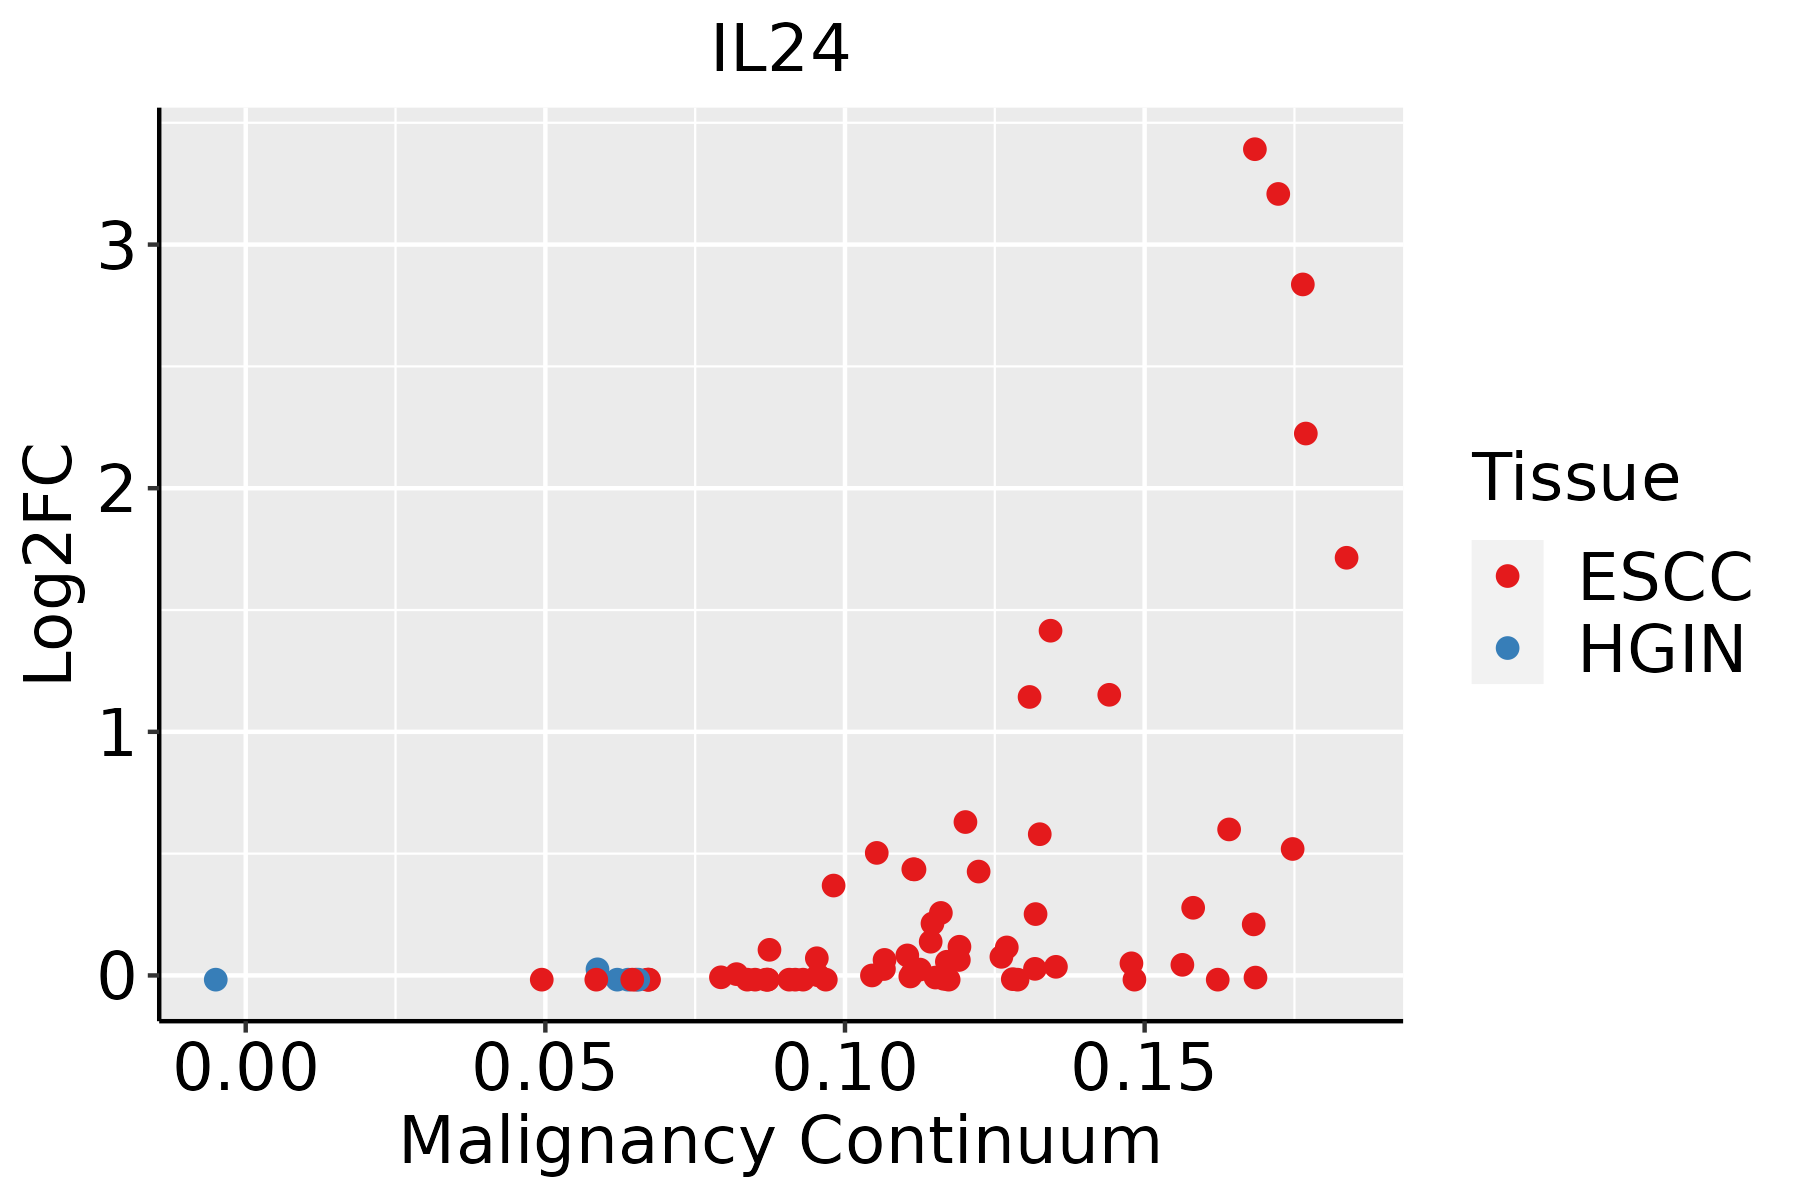 | ESCC: Esophageal squamous cell carcinoma |
| HGIN: High-grade intraepithelial neoplasias | ||
| LGIN: Low-grade intraepithelial neoplasias | ||
| Oral Cavity | 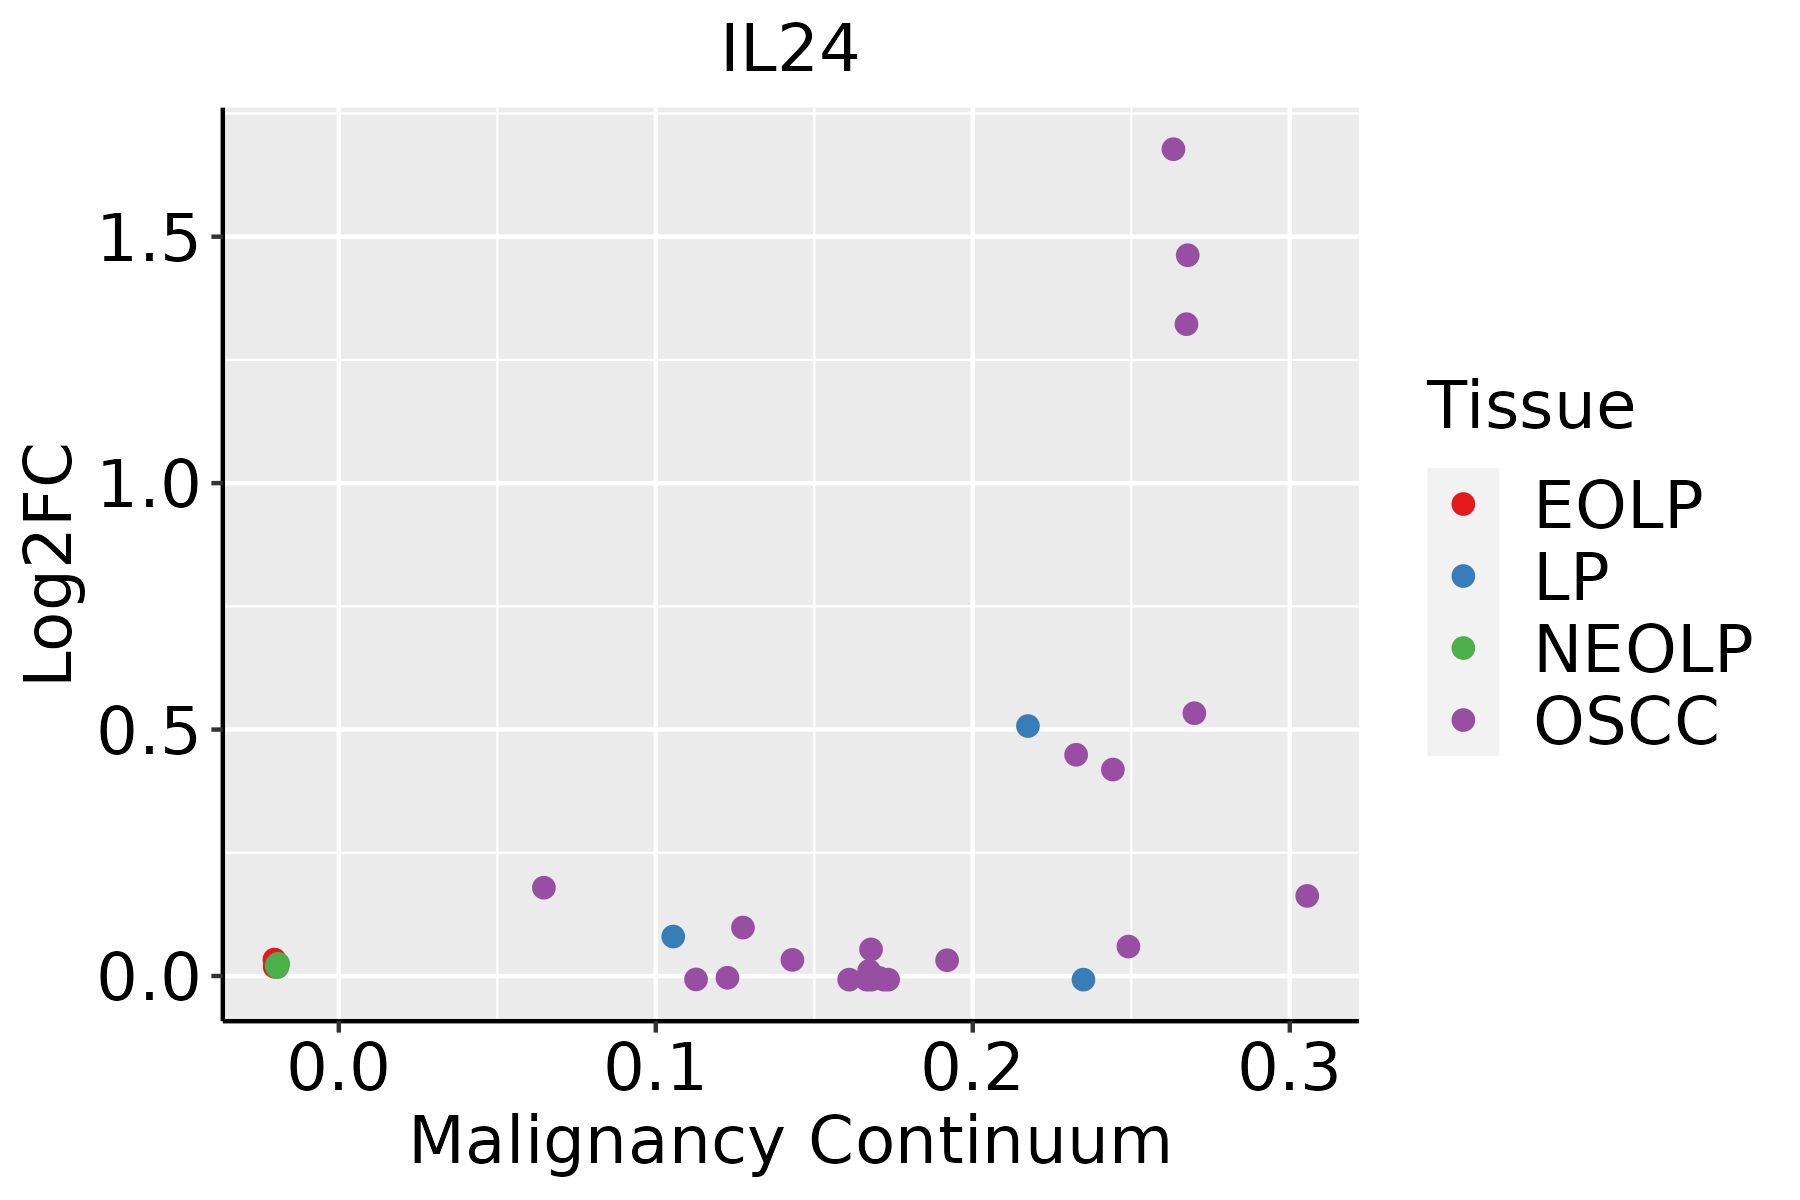 | EOLP: Erosive Oral lichen planus |
| LP: leukoplakia | ||
| NEOLP: Non-erosive oral lichen planus | ||
| OSCC: Oral squamous cell carcinoma | ||
| Skin | 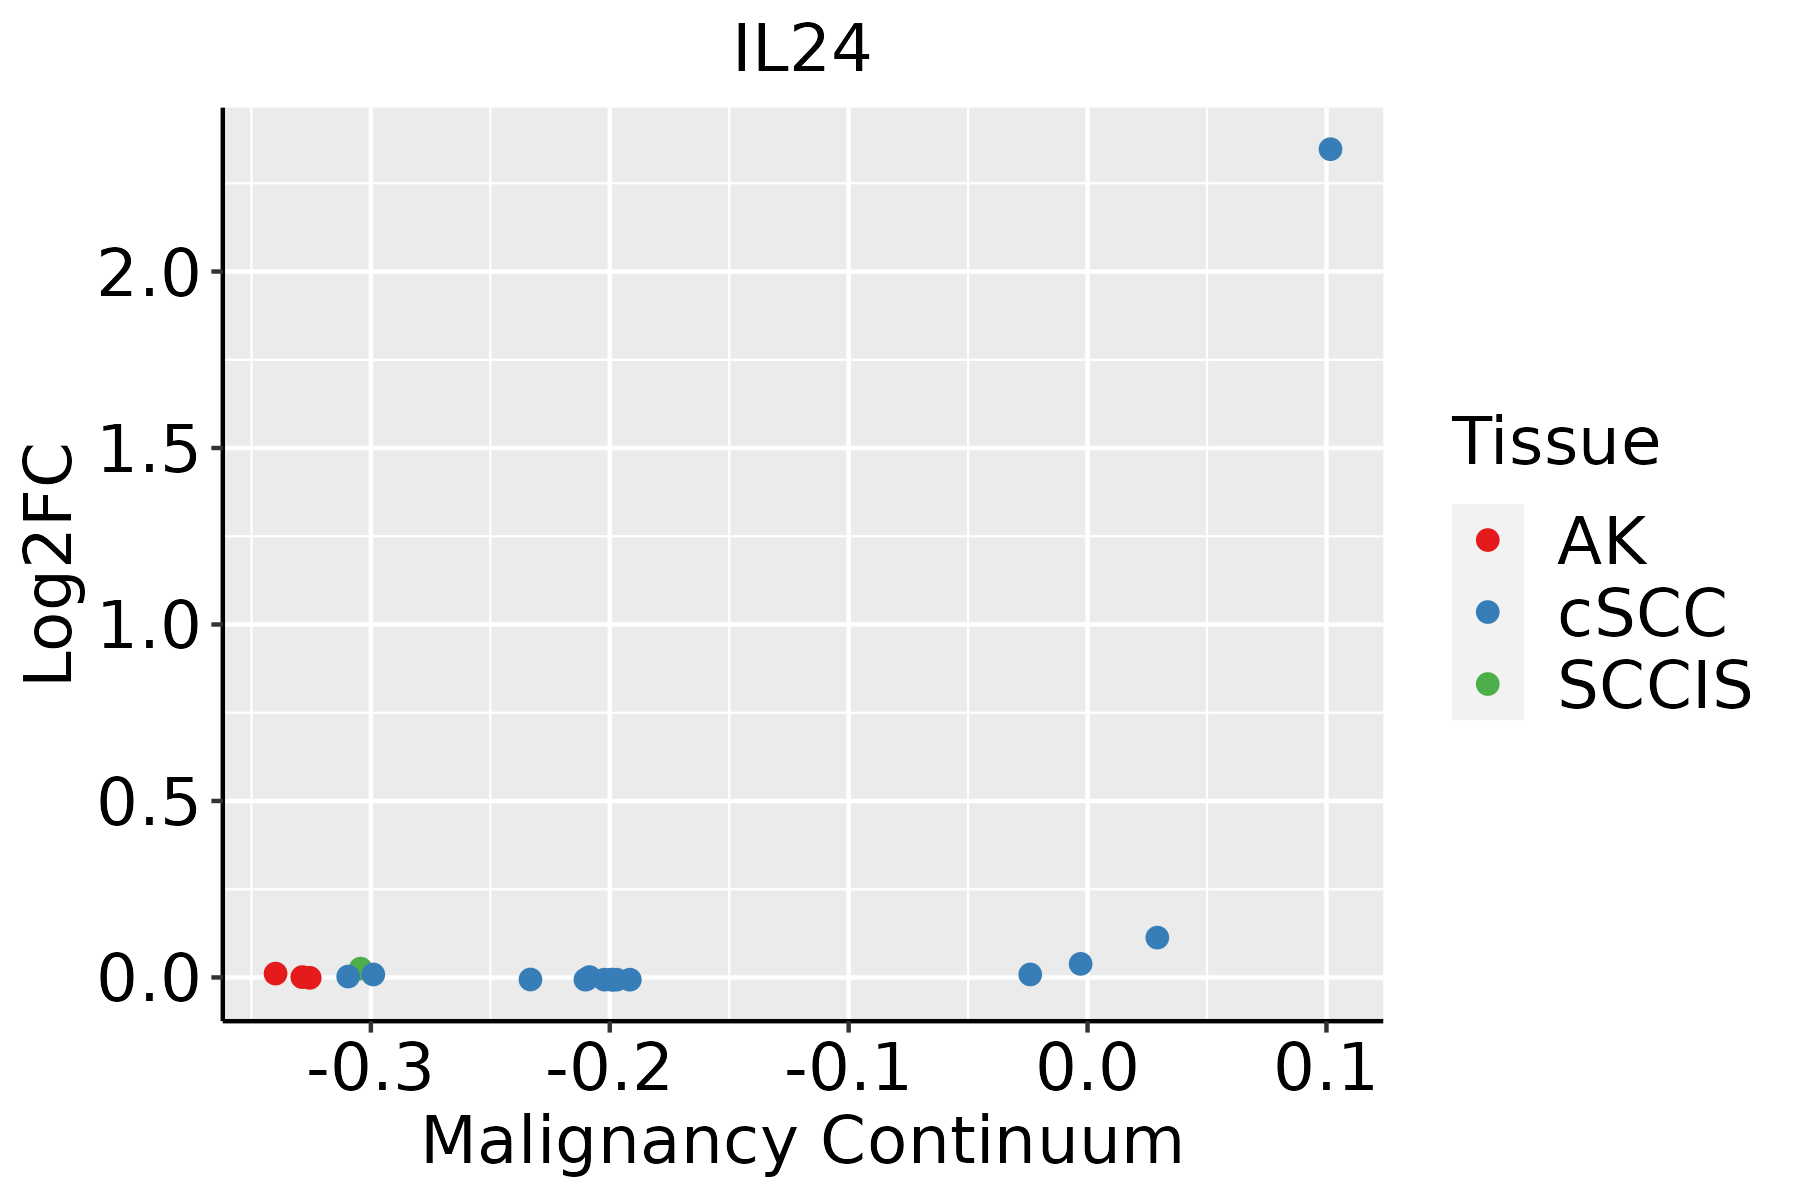 | AK: Actinic keratosis |
| cSCC: Cutaneous squamous cell carcinoma | ||
| SCCIS:squamous cell carcinoma in situ |
| ∗log2FC in expression of this searched gene in stem-like cells from each diseased tissue sample relative to stem-like cells in normal samples in each tissue plotted against the malignancy continuum. Samples are colored based on if they are from different disease stage. |
Top |
Malignant transformation related pathway analysis |
| Find out the enriched GO biological processes and KEGG pathways involved in transition from healthy to precancer to cancer |
| Tissue | Disease Stage | Enriched GO biological Processes |
| Colorectum | AD |  |
| Colorectum | SER |  |
| Colorectum | MSS |  |
| Colorectum | MSI-H |  |
| Colorectum | FAP |  |
| ∗Top 15 enriched GO BP terms are showed in the bar plot of each disease state in each tissue. Each row represents a significant GO biological process which is colored according to the -log10(p.adjust). |
| Page: 1 2 3 4 5 6 7 8 9 |
| GO ID | Tissue | Disease Stage | Description | Gene Ratio | Bg Ratio | pvalue | p.adjust | Count |
| GO:004206027 | Esophagus | ESCC | wound healing | 243/8552 | 422/18723 | 4.62e-07 | 6.25e-06 | 243 |
| GO:00182099 | Esophagus | ESCC | peptidyl-serine modification | 196/8552 | 338/18723 | 3.07e-06 | 3.47e-05 | 196 |
| GO:001810515 | Esophagus | ESCC | peptidyl-serine phosphorylation | 184/8552 | 315/18723 | 3.22e-06 | 3.61e-05 | 184 |
| GO:003249619 | Esophagus | ESCC | response to lipopolysaccharide | 191/8552 | 343/18723 | 1.11e-04 | 7.73e-04 | 191 |
| GO:00182124 | Esophagus | ESCC | peptidyl-tyrosine modification | 202/8552 | 378/18723 | 1.34e-03 | 6.39e-03 | 202 |
| GO:00181084 | Esophagus | ESCC | peptidyl-tyrosine phosphorylation | 200/8552 | 375/18723 | 1.60e-03 | 7.45e-03 | 200 |
| GO:000223719 | Esophagus | ESCC | response to molecule of bacterial origin | 194/8552 | 363/18723 | 1.64e-03 | 7.61e-03 | 194 |
| GO:00507303 | Esophagus | ESCC | regulation of peptidyl-tyrosine phosphorylation | 144/8552 | 264/18723 | 2.22e-03 | 9.78e-03 | 144 |
| GO:007122215 | Esophagus | ESCC | cellular response to lipopolysaccharide | 113/8552 | 209/18723 | 8.79e-03 | 3.10e-02 | 113 |
| GO:007121617 | Esophagus | ESCC | cellular response to biotic stimulus | 131/8552 | 246/18723 | 9.85e-03 | 3.39e-02 | 131 |
| GO:004206020 | Oral cavity | OSCC | wound healing | 237/7305 | 422/18723 | 4.51e-13 | 2.18e-11 | 237 |
| GO:003249617 | Oral cavity | OSCC | response to lipopolysaccharide | 178/7305 | 343/18723 | 7.27e-07 | 1.03e-05 | 178 |
| GO:00182098 | Oral cavity | OSCC | peptidyl-serine modification | 175/7305 | 338/18723 | 1.09e-06 | 1.46e-05 | 175 |
| GO:001810510 | Oral cavity | OSCC | peptidyl-serine phosphorylation | 164/7305 | 315/18723 | 1.51e-06 | 1.99e-05 | 164 |
| GO:007121615 | Oral cavity | OSCC | cellular response to biotic stimulus | 129/7305 | 246/18723 | 1.20e-05 | 1.23e-04 | 129 |
| GO:000223717 | Oral cavity | OSCC | response to molecule of bacterial origin | 181/7305 | 363/18723 | 1.48e-05 | 1.49e-04 | 181 |
| GO:007122210 | Oral cavity | OSCC | cellular response to lipopolysaccharide | 110/7305 | 209/18723 | 4.15e-05 | 3.60e-04 | 110 |
| GO:007121910 | Oral cavity | OSCC | cellular response to molecule of bacterial origin | 112/7305 | 221/18723 | 2.64e-04 | 1.69e-03 | 112 |
| GO:00182123 | Oral cavity | OSCC | peptidyl-tyrosine modification | 180/7305 | 378/18723 | 3.63e-04 | 2.22e-03 | 180 |
| GO:0050730 | Oral cavity | OSCC | regulation of peptidyl-tyrosine phosphorylation | 129/7305 | 264/18723 | 6.70e-04 | 3.75e-03 | 129 |
| Page: 1 2 |
| Pathway ID | Tissue | Disease Stage | Description | Gene Ratio | Bg Ratio | pvalue | p.adjust | qvalue | Count |
| Page: 1 |
Top |
Cell-cell communication analysis |
| Identification of potential cell-cell interactions between two cell types and their ligand-receptor pairs for different disease states |
| Ligand | Receptor | LRpair | Pathway | Tissue | Disease Stage |
| IL24 | IL20RA_IL20RB | IL24_IL20RA_IL20RB | IL10 | HNSCC | OSCC |
| IL24 | IL20RA_IL20RB | IL24_IL20RA_IL20RB | IL10 | HNSCC | Precancer |
| IL24 | IL22RA1_IL20RB | IL24_IL22RA1_IL20RB | IL10 | HNSCC | Precancer |
| Page: 1 |
Top |
Single-cell gene regulatory network inference analysis |
| Find out the significant the regulons (TFs) and the target genes of each regulon across cell types for different disease states |
| TF | Cell Type | Tissue | Disease Stage | Target Gene | RSS | Regulon Activity |
| IL24 | cDC | Oral cavity | Healthy | TWIST2,MMP1,TMEM158, etc. | 1.78e-01 |  |
| IL24 | CD8TEX | Oral cavity | NEOLP | TWIST2,MMP1,TMEM158, etc. | 1.14e-02 |  |
| IL24 | cDC | Oral cavity | NEOLP | TWIST2,MMP1,TMEM158, etc. | 1.72e-02 | |
| IL24 | ICAF | Thyroid | ATC | COL6A2,WNT5A,HS3ST3B1, etc. | 5.04e-01 |  |
| ∗The dot plots of a searched regulon are shown for all cell subpopulations in each disease state of each tissue based on the regulon specific score inferred using pySCENIC and by calculating the average expression. |
| Page: 1 |
Top |
Somatic mutation of malignant transformation related genes |
| Annotation of somatic variants for genes involved in malignant transformation |
| Hugo Symbol | Variant Class | Variant Classification | dbSNP RS | HGVSc | HGVSp | HGVSp Short | SWISSPROT | BIOTYPE | SIFT | PolyPhen | Tumor Sample Barcode | Tissue | Histology | Sex | Age | Stage | Therapy Types | Drugs | Outcome |
| IL24 | SNV | Missense_Mutation | c.366C>G | p.Phe122Leu | p.F122L | Q13007 | protein_coding | tolerated(0.06) | probably_damaging(0.997) | TCGA-AC-A23H-01 | Breast | breast invasive carcinoma | Female | >=65 | I/II | Unknown | Unknown | PD | |
| IL24 | insertion | Frame_Shift_Ins | novel | c.577dupG | p.Glu193GlyfsTer19 | p.E193Gfs*19 | Q13007 | protein_coding | TCGA-BH-A0E1-01 | Breast | breast invasive carcinoma | Female | <65 | I/II | Chemotherapy | cytoxan | SD | ||
| IL24 | SNV | Missense_Mutation | novel | c.577N>A | p.Glu193Lys | p.E193K | Q13007 | protein_coding | deleterious(0) | probably_damaging(0.998) | TCGA-HM-A4S6-01 | Cervix | cervical & endocervical cancer | Female | <65 | III/IV | Chemotherapy | cisplatin | CR |
| IL24 | SNV | Missense_Mutation | c.463N>T | p.Ser155Cys | p.S155C | Q13007 | protein_coding | tolerated(0.35) | benign(0.003) | TCGA-AA-3715-01 | Colorectum | colon adenocarcinoma | Male | >=65 | I/II | Unknown | Unknown | PD | |
| IL24 | SNV | Missense_Mutation | c.17N>T | p.Arg6Met | p.R6M | Q13007 | protein_coding | deleterious_low_confidence(0.01) | possibly_damaging(0.563) | TCGA-AA-3811-01 | Colorectum | colon adenocarcinoma | Female | >=65 | III/IV | Unknown | Unknown | PD | |
| IL24 | SNV | Missense_Mutation | c.281A>T | p.Gln94Leu | p.Q94L | Q13007 | protein_coding | deleterious(0.01) | benign(0.069) | TCGA-AA-3986-01 | Colorectum | colon adenocarcinoma | Male | >=65 | I/II | Unknown | Unknown | SD | |
| IL24 | SNV | Missense_Mutation | rs144126009 | c.263N>T | p.Thr88Met | p.T88M | Q13007 | protein_coding | tolerated(0.09) | benign(0.027) | TCGA-CM-5341-01 | Colorectum | colon adenocarcinoma | Female | >=65 | III/IV | Chemotherapy | fluorouracil | SD |
| IL24 | SNV | Missense_Mutation | rs551792796 | c.301G>A | p.Val101Ile | p.V101I | Q13007 | protein_coding | tolerated(0.18) | benign(0.041) | TCGA-F4-6856-01 | Colorectum | colon adenocarcinoma | Male | <65 | I/II | Ancillary | leucovorin | CR |
| IL24 | SNV | Missense_Mutation | novel | c.419C>A | p.Thr140Asn | p.T140N | Q13007 | protein_coding | deleterious(0.01) | possibly_damaging(0.866) | TCGA-F5-6814-01 | Colorectum | rectum adenocarcinoma | Male | <65 | I/II | Unknown | Unknown | SD |
| IL24 | SNV | Missense_Mutation | novel | c.245N>G | p.Gln82Arg | p.Q82R | Q13007 | protein_coding | deleterious(0.01) | possibly_damaging(0.766) | TCGA-AJ-A3EL-01 | Endometrium | uterine corpus endometrioid carcinoma | Female | <65 | I/II | Unknown | Unknown | SD |
| Page: 1 2 3 |
Top |
Related drugs of malignant transformation related genes |
| Identification of chemicals and drugs interact with genes involved in malignant transfromation |
| (DGIdb 4.0) |
| Entrez ID | Symbol | Category | Interaction Types | Drug Claim Name | Drug Name | PMIDs |
| 11009 | IL24 | DRUGGABLE GENOME, KINASE | INGN-241 | |||
| 11009 | IL24 | DRUGGABLE GENOME, KINASE | INGN 242 |
| Page: 1 |

Copyright 2023-Present -The University of Texas Health Science Center at Houston |