
|
|||||
|
 | |
| |
| |
| |
| |
| |
|
Gene: IL20RA |
Gene summary for IL20RA |
| Gene information | Species | Human | Gene symbol | IL20RA | Gene ID | 53832 |
| Gene name | interleukin 20 receptor subunit alpha | |
| Gene Alias | CRF2-8 | |
| Cytomap | 6q23.3 | |
| Gene Type | protein-coding | GO ID | GO:0001894 | UniProtAcc | Q9UHF4 |
Top |
Malignant transformation analysis |
| Identification of the aberrant gene expression in precancerous and cancerous lesions by comparing the gene expression of stem-like cells in diseased tissues with normal stem cells |
| Entrez ID | Symbol | Replicates | Species | Organ | Tissue | Adj P-value | Log2FC | Malignancy |
| 53832 | IL20RA | LZE20T | Human | Esophagus | ESCC | 3.09e-05 | 1.43e-01 | 0.0662 |
| 53832 | IL20RA | P1T-E | Human | Esophagus | ESCC | 1.43e-04 | 4.50e-01 | 0.0875 |
| 53832 | IL20RA | P2T-E | Human | Esophagus | ESCC | 9.75e-26 | 4.50e-01 | 0.1177 |
| 53832 | IL20RA | P4T-E | Human | Esophagus | ESCC | 3.77e-05 | 9.41e-02 | 0.1323 |
| 53832 | IL20RA | P8T-E | Human | Esophagus | ESCC | 2.18e-25 | 3.10e-01 | 0.0889 |
| 53832 | IL20RA | P9T-E | Human | Esophagus | ESCC | 1.49e-12 | 2.51e-01 | 0.1131 |
| 53832 | IL20RA | P10T-E | Human | Esophagus | ESCC | 6.54e-07 | 4.66e-02 | 0.116 |
| 53832 | IL20RA | P12T-E | Human | Esophagus | ESCC | 1.11e-25 | 4.32e-01 | 0.1122 |
| 53832 | IL20RA | P15T-E | Human | Esophagus | ESCC | 7.73e-07 | 1.66e-01 | 0.1149 |
| 53832 | IL20RA | P16T-E | Human | Esophagus | ESCC | 7.59e-25 | 5.18e-01 | 0.1153 |
| 53832 | IL20RA | P20T-E | Human | Esophagus | ESCC | 6.97e-15 | 2.77e-01 | 0.1124 |
| 53832 | IL20RA | P21T-E | Human | Esophagus | ESCC | 7.15e-06 | 5.29e-02 | 0.1617 |
| 53832 | IL20RA | P22T-E | Human | Esophagus | ESCC | 7.54e-05 | 1.02e-01 | 0.1236 |
| 53832 | IL20RA | P23T-E | Human | Esophagus | ESCC | 1.65e-18 | 3.86e-01 | 0.108 |
| 53832 | IL20RA | P26T-E | Human | Esophagus | ESCC | 8.08e-12 | 1.61e-01 | 0.1276 |
| 53832 | IL20RA | P27T-E | Human | Esophagus | ESCC | 2.33e-11 | 2.74e-01 | 0.1055 |
| 53832 | IL20RA | P28T-E | Human | Esophagus | ESCC | 3.01e-06 | 1.70e-01 | 0.1149 |
| 53832 | IL20RA | P30T-E | Human | Esophagus | ESCC | 1.06e-15 | 7.25e-01 | 0.137 |
| 53832 | IL20RA | P31T-E | Human | Esophagus | ESCC | 2.45e-06 | 1.18e-01 | 0.1251 |
| 53832 | IL20RA | P36T-E | Human | Esophagus | ESCC | 4.23e-03 | 9.28e-02 | 0.1187 |
| Page: 1 2 3 4 |
| Tissue | Expression Dynamics | Abbreviation |
| Esophagus | 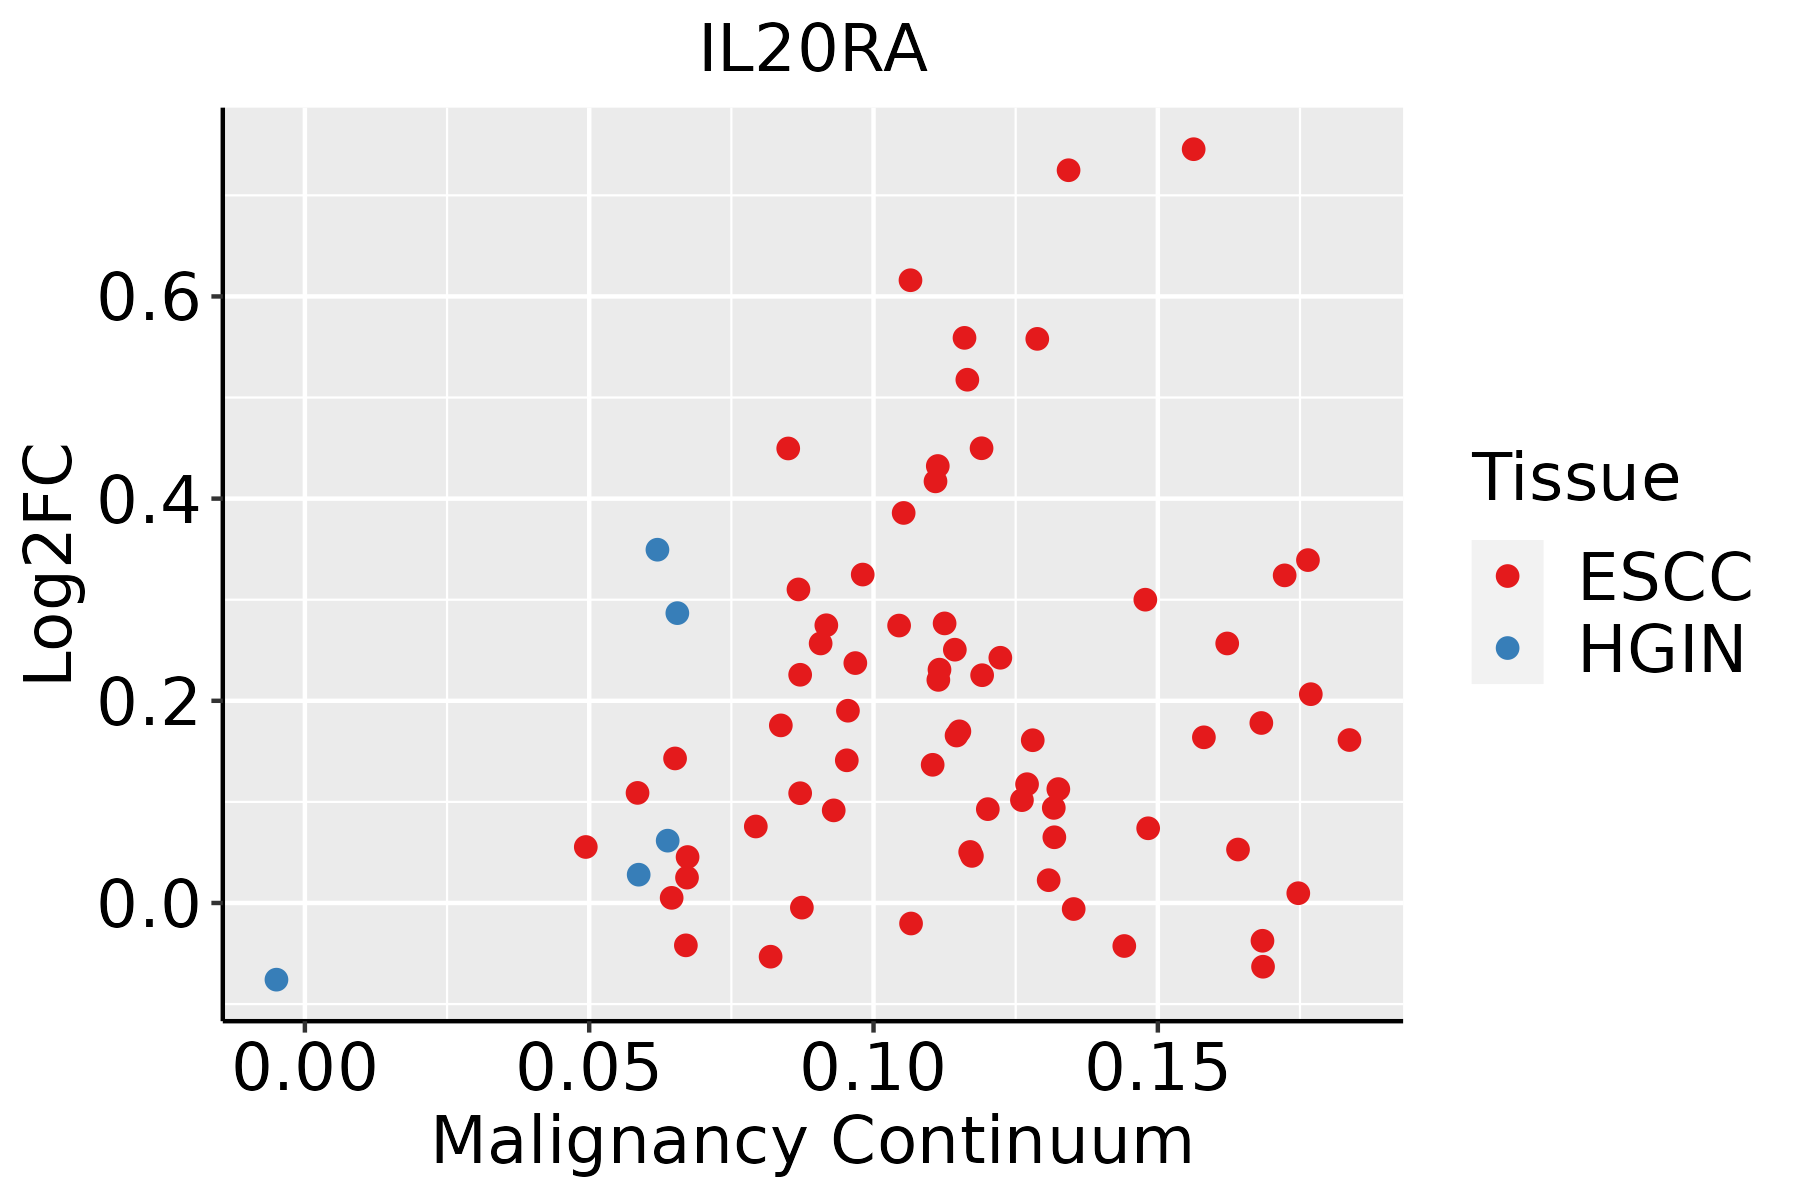 | ESCC: Esophageal squamous cell carcinoma |
| HGIN: High-grade intraepithelial neoplasias | ||
| LGIN: Low-grade intraepithelial neoplasias | ||
| Oral Cavity | 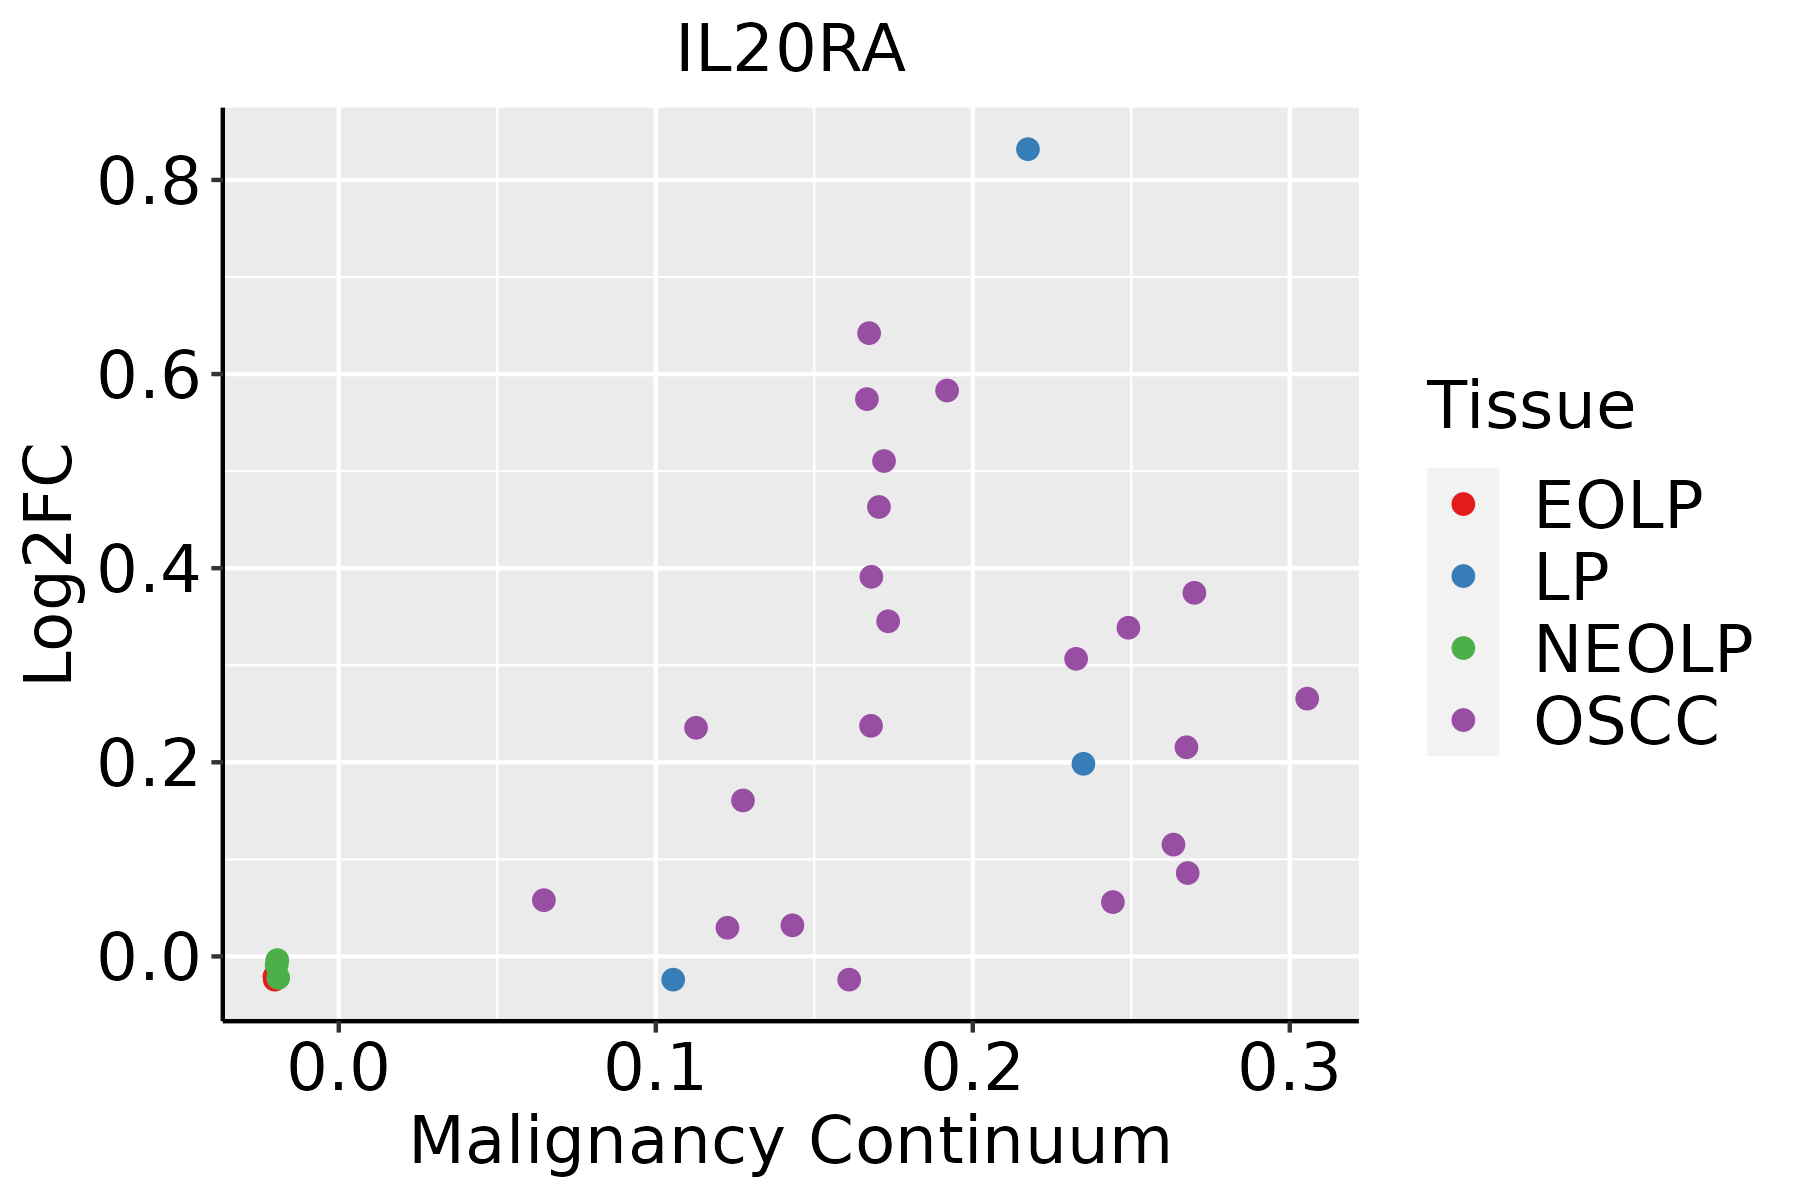 | EOLP: Erosive Oral lichen planus |
| LP: leukoplakia | ||
| NEOLP: Non-erosive oral lichen planus | ||
| OSCC: Oral squamous cell carcinoma | ||
| Skin |  | AK: Actinic keratosis |
| cSCC: Cutaneous squamous cell carcinoma | ||
| SCCIS:squamous cell carcinoma in situ |
| ∗log2FC in expression of this searched gene in stem-like cells from each diseased tissue sample relative to stem-like cells in normal samples in each tissue plotted against the malignancy continuum. Samples are colored based on if they are from different disease stage. |
Top |
Malignant transformation related pathway analysis |
| Find out the enriched GO biological processes and KEGG pathways involved in transition from healthy to precancer to cancer |
| Tissue | Disease Stage | Enriched GO biological Processes |
| Colorectum | AD |  |
| Colorectum | SER |  |
| Colorectum | MSS |  |
| Colorectum | MSI-H |  |
| Colorectum | FAP |  |
| ∗Top 15 enriched GO BP terms are showed in the bar plot of each disease state in each tissue. Each row represents a significant GO biological process which is colored according to the -log10(p.adjust). |
| Page: 1 2 3 4 5 6 7 8 9 |
| GO ID | Tissue | Disease Stage | Description | Gene Ratio | Bg Ratio | pvalue | p.adjust | Count |
| GO:0097193111 | Esophagus | ESCC | intrinsic apoptotic signaling pathway | 222/8552 | 288/18723 | 5.87e-28 | 2.02e-25 | 222 |
| GO:2001233111 | Esophagus | ESCC | regulation of apoptotic signaling pathway | 256/8552 | 356/18723 | 4.11e-24 | 1.04e-21 | 256 |
| GO:2001242111 | Esophagus | ESCC | regulation of intrinsic apoptotic signaling pathway | 128/8552 | 164/18723 | 1.75e-17 | 1.50e-15 | 128 |
| GO:2001235110 | Esophagus | ESCC | positive regulation of apoptotic signaling pathway | 92/8552 | 126/18723 | 3.91e-10 | 1.05e-08 | 92 |
| GO:200124417 | Esophagus | ESCC | positive regulation of intrinsic apoptotic signaling pathway | 43/8552 | 58/18723 | 9.86e-06 | 9.37e-05 | 43 |
| GO:200123320 | Oral cavity | OSCC | regulation of apoptotic signaling pathway | 242/7305 | 356/18723 | 6.66e-29 | 3.24e-26 | 242 |
| GO:009719320 | Oral cavity | OSCC | intrinsic apoptotic signaling pathway | 202/7305 | 288/18723 | 4.64e-27 | 1.73e-24 | 202 |
| GO:200124220 | Oral cavity | OSCC | regulation of intrinsic apoptotic signaling pathway | 123/7305 | 164/18723 | 5.71e-21 | 9.77e-19 | 123 |
| GO:200123510 | Oral cavity | OSCC | positive regulation of apoptotic signaling pathway | 92/7305 | 126/18723 | 8.45e-15 | 5.19e-13 | 92 |
| GO:20012449 | Oral cavity | OSCC | positive regulation of intrinsic apoptotic signaling pathway | 44/7305 | 58/18723 | 1.22e-08 | 2.48e-07 | 44 |
| GO:00192214 | Oral cavity | OSCC | cytokine-mediated signaling pathway | 222/7305 | 472/18723 | 2.02e-04 | 1.35e-03 | 222 |
| GO:00487713 | Oral cavity | OSCC | tissue remodeling | 84/7305 | 175/18723 | 9.39e-03 | 3.36e-02 | 84 |
| GO:0045453 | Oral cavity | OSCC | bone resorption | 35/7305 | 65/18723 | 1.07e-02 | 3.64e-02 | 35 |
| GO:0097193110 | Oral cavity | LP | intrinsic apoptotic signaling pathway | 146/4623 | 288/18723 | 9.76e-22 | 2.78e-19 | 146 |
| GO:2001233110 | Oral cavity | LP | regulation of apoptotic signaling pathway | 168/4623 | 356/18723 | 1.35e-20 | 3.02e-18 | 168 |
| GO:2001242110 | Oral cavity | LP | regulation of intrinsic apoptotic signaling pathway | 95/4623 | 164/18723 | 9.85e-20 | 1.99e-17 | 95 |
| GO:200123518 | Oral cavity | LP | positive regulation of apoptotic signaling pathway | 63/4623 | 126/18723 | 7.17e-10 | 3.43e-08 | 63 |
| GO:200124416 | Oral cavity | LP | positive regulation of intrinsic apoptotic signaling pathway | 33/4623 | 58/18723 | 1.63e-07 | 5.11e-06 | 33 |
| GO:009719329 | Skin | cSCC | intrinsic apoptotic signaling pathway | 150/4864 | 288/18723 | 1.76e-21 | 3.34e-19 | 150 |
| GO:200123329 | Skin | cSCC | regulation of apoptotic signaling pathway | 173/4864 | 356/18723 | 2.25e-20 | 3.44e-18 | 173 |
| Page: 1 2 |
| Pathway ID | Tissue | Disease Stage | Description | Gene Ratio | Bg Ratio | pvalue | p.adjust | qvalue | Count |
| Page: 1 |
Top |
Cell-cell communication analysis |
| Identification of potential cell-cell interactions between two cell types and their ligand-receptor pairs for different disease states |
| Ligand | Receptor | LRpair | Pathway | Tissue | Disease Stage |
| IL24 | IL20RA_IL20RB | IL24_IL20RA_IL20RB | IL10 | HNSCC | OSCC |
| IL24 | IL20RA_IL20RB | IL24_IL20RA_IL20RB | IL10 | HNSCC | Precancer |
| Page: 1 |
Top |
Single-cell gene regulatory network inference analysis |
| Find out the significant the regulons (TFs) and the target genes of each regulon across cell types for different disease states |
| TF | Cell Type | Tissue | Disease Stage | Target Gene | RSS | Regulon Activity |
| ∗The dot plots of a searched regulon are shown for all cell subpopulations in each disease state of each tissue based on the regulon specific score inferred using pySCENIC and by calculating the average expression. |
| Page: 1 |
Top |
Somatic mutation of malignant transformation related genes |
| Annotation of somatic variants for genes involved in malignant transformation |
| Hugo Symbol | Variant Class | Variant Classification | dbSNP RS | HGVSc | HGVSp | HGVSp Short | SWISSPROT | BIOTYPE | SIFT | PolyPhen | Tumor Sample Barcode | Tissue | Histology | Sex | Age | Stage | Therapy Types | Drugs | Outcome |
| IL20RA | SNV | Missense_Mutation | novel | c.1419N>T | p.Glu473Asp | p.E473D | Q9UHF4 | protein_coding | tolerated(0.06) | benign(0.017) | TCGA-A7-A6VY-01 | Breast | breast invasive carcinoma | Female | <65 | I/II | Chemotherapy | cyclophosphamide | CR |
| IL20RA | insertion | Nonsense_Mutation | novel | c.1561_1562insCAGGTTGGTGGTAAGTTGGTCACATGTGAAAACCTCAACTATT | p.Leu521ProfsTer5 | p.L521Pfs*5 | Q9UHF4 | protein_coding | TCGA-A8-A07P-01 | Breast | breast invasive carcinoma | Female | >=65 | I/II | Chemotherapy | 5-fluorouracil | SD | ||
| IL20RA | insertion | Nonsense_Mutation | novel | c.1287_1288insTCACTCATTTTATAAATACC | p.Thr430SerfsTer5 | p.T430Sfs*5 | Q9UHF4 | protein_coding | TCGA-A8-A08H-01 | Breast | breast invasive carcinoma | Female | >=65 | I/II | Unknown | Unknown | SD | ||
| IL20RA | insertion | Nonsense_Mutation | novel | c.1285_1286insCACTGTAAAAAATATTTCCCAAA | p.Gly429AlafsTer3 | p.G429Afs*3 | Q9UHF4 | protein_coding | TCGA-A8-A08H-01 | Breast | breast invasive carcinoma | Female | >=65 | I/II | Unknown | Unknown | SD | ||
| IL20RA | insertion | Frame_Shift_Ins | novel | c.1075_1076insTGGCAGGCTGTGTATT | p.His359LeufsTer19 | p.H359Lfs*19 | Q9UHF4 | protein_coding | TCGA-BH-A0HU-01 | Breast | breast invasive carcinoma | Female | <65 | I/II | Chemotherapy | docetaxel | SD | ||
| IL20RA | SNV | Missense_Mutation | c.1181N>T | p.Pro394Leu | p.P394L | Q9UHF4 | protein_coding | tolerated(0.12) | benign(0.003) | TCGA-DS-A0VM-01 | Cervix | cervical & endocervical cancer | Female | <65 | I/II | Chemotherapy | cisplatin | PD | |
| IL20RA | SNV | Missense_Mutation | novel | c.1514A>C | p.Glu505Ala | p.E505A | Q9UHF4 | protein_coding | deleterious(0.04) | benign(0.112) | TCGA-5M-AAT6-01 | Colorectum | colon adenocarcinoma | Female | <65 | III/IV | Unknown | Unknown | PD |
| IL20RA | SNV | Missense_Mutation | c.1142N>A | p.Ser381Tyr | p.S381Y | Q9UHF4 | protein_coding | tolerated(0.08) | possibly_damaging(0.87) | TCGA-AA-3510-01 | Colorectum | colon adenocarcinoma | Male | >=65 | I/II | Unknown | Unknown | SD | |
| IL20RA | SNV | Missense_Mutation | c.1235C>T | p.Ala412Val | p.A412V | Q9UHF4 | protein_coding | tolerated(0.49) | benign(0) | TCGA-AA-A00N-01 | Colorectum | colon adenocarcinoma | Male | >=65 | I/II | Unknown | Unknown | PD | |
| IL20RA | SNV | Missense_Mutation | c.1532N>T | p.Gly511Val | p.G511V | Q9UHF4 | protein_coding | tolerated(0.16) | benign(0.021) | TCGA-AZ-4614-01 | Colorectum | colon adenocarcinoma | Female | >=65 | I/II | Unknown | Unknown | PD |
| Page: 1 2 3 4 5 |
Top |
Related drugs of malignant transformation related genes |
| Identification of chemicals and drugs interact with genes involved in malignant transfromation |
| (DGIdb 4.0) |
| Entrez ID | Symbol | Category | Interaction Types | Drug Claim Name | Drug Name | PMIDs |
| Page: 1 |

Copyright 2023-Present -The University of Texas Health Science Center at Houston |