
|
|||||
|
 | |
| |
| |
| |
| |
| |
|
Gene: IL20 |
Gene summary for IL20 |
| Gene information | Species | Human | Gene symbol | IL20 | Gene ID | 50604 |
| Gene name | interleukin 20 | |
| Gene Alias | IL-20 | |
| Cytomap | 1q32.1 | |
| Gene Type | protein-coding | GO ID | GO:0001932 | UniProtAcc | Q9NYY1 |
Top |
Malignant transformation analysis |
| Identification of the aberrant gene expression in precancerous and cancerous lesions by comparing the gene expression of stem-like cells in diseased tissues with normal stem cells |
| Entrez ID | Symbol | Replicates | Species | Organ | Tissue | Adj P-value | Log2FC | Malignancy |
| 50604 | IL20 | P21T-E | Human | Esophagus | ESCC | 2.68e-21 | 1.20e+00 | 0.1617 |
| 50604 | IL20 | P52T-E | Human | Esophagus | ESCC | 2.52e-02 | 8.95e-02 | 0.1555 |
| 50604 | IL20 | P80T-E | Human | Esophagus | ESCC | 2.38e-02 | 6.47e-01 | 0.155 |
| 50604 | IL20 | P89T-E | Human | Esophagus | ESCC | 1.36e-08 | 1.15e+00 | 0.1752 |
| 50604 | IL20 | P107T-E | Human | Esophagus | ESCC | 4.88e-34 | 1.76e+00 | 0.171 |
| 50604 | IL20 | C04 | Human | Oral cavity | OSCC | 4.87e-29 | 1.96e+00 | 0.2633 |
| 50604 | IL20 | C51 | Human | Oral cavity | OSCC | 3.19e-03 | 5.31e-01 | 0.2674 |
| 50604 | IL20 | SYSMH2 | Human | Oral cavity | OSCC | 2.43e-05 | 3.86e-01 | 0.2326 |
| 50604 | IL20 | SYSMH3 | Human | Oral cavity | OSCC | 3.62e-03 | 2.35e-01 | 0.2442 |
| 50604 | IL20 | P1_cSCC | Human | Skin | cSCC | 6.38e-03 | 3.56e-01 | 0.0292 |
| 50604 | IL20 | P2_cSCC | Human | Skin | cSCC | 1.34e-03 | 2.69e-01 | -0.024 |
| Page: 1 |
| Tissue | Expression Dynamics | Abbreviation |
| Esophagus | 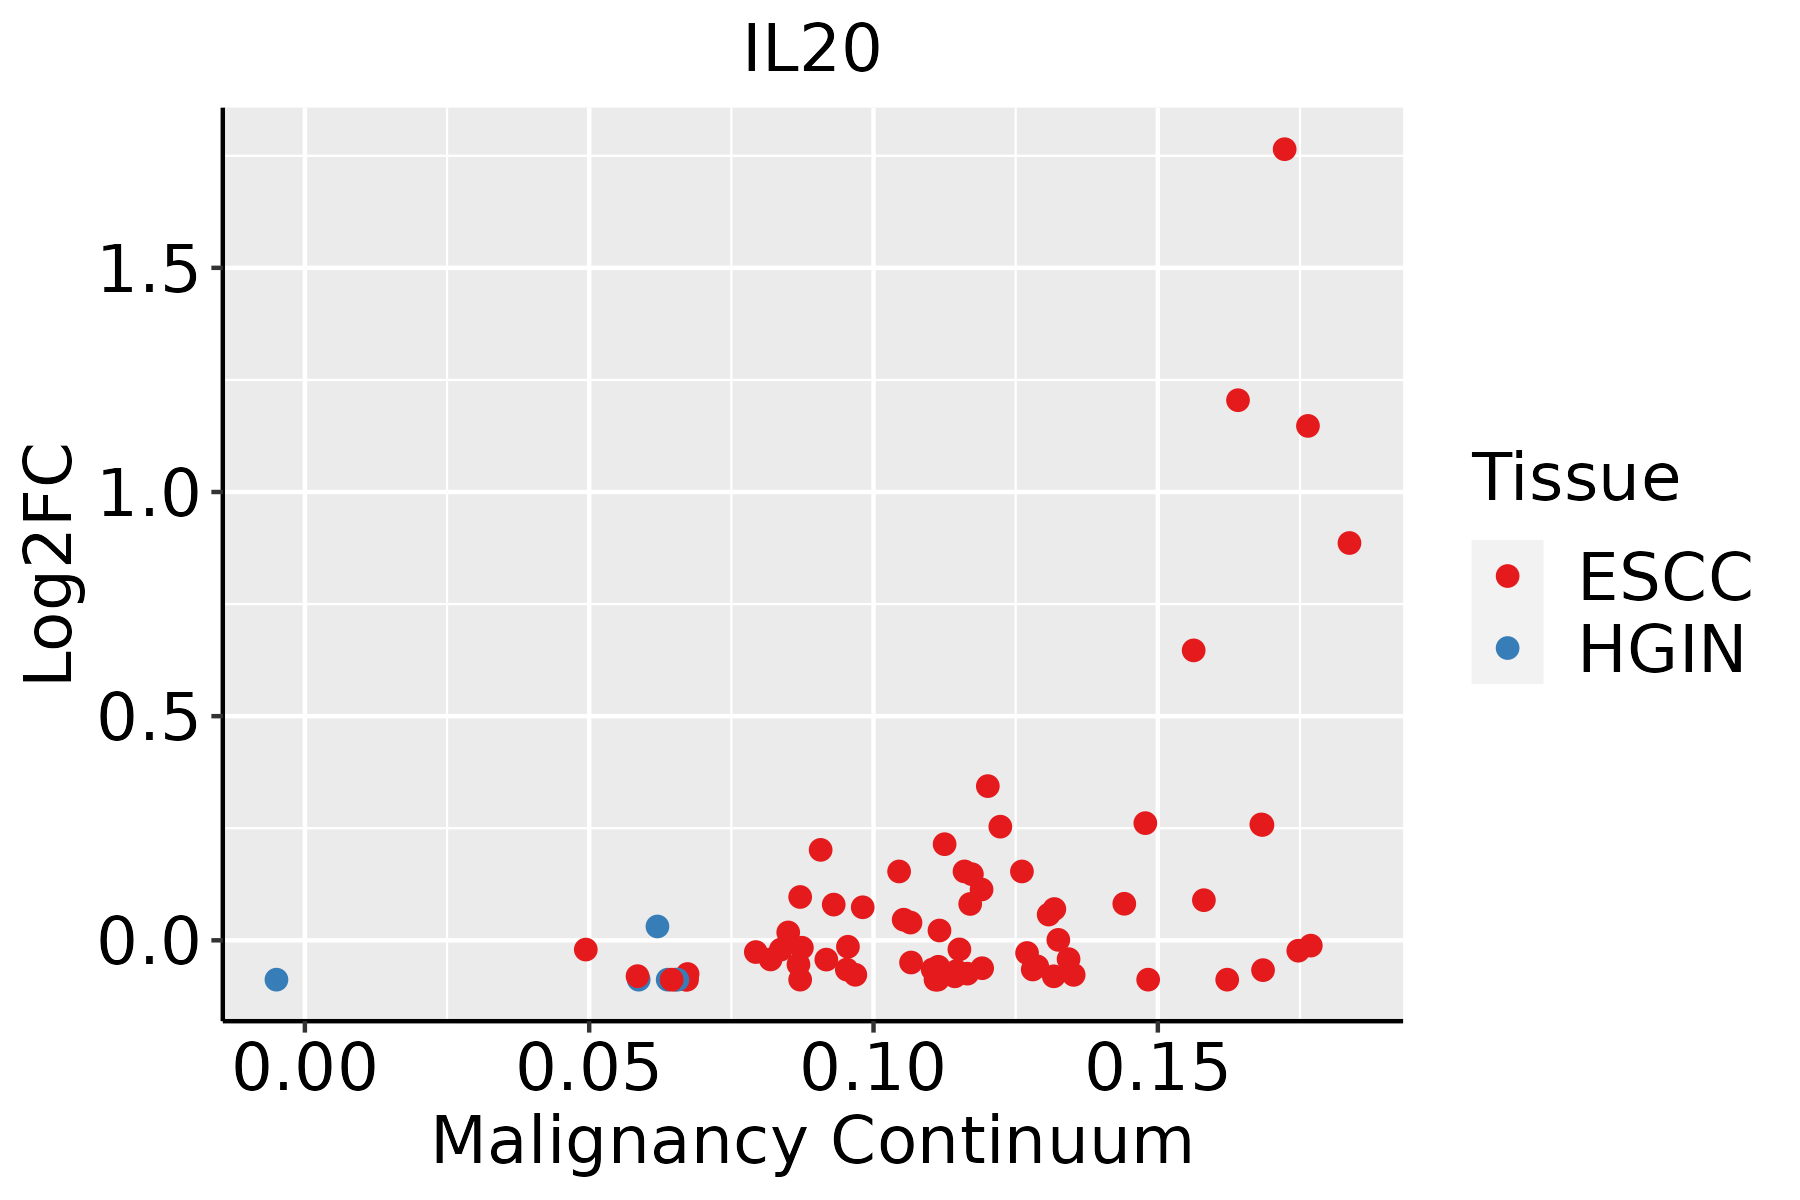 | ESCC: Esophageal squamous cell carcinoma |
| HGIN: High-grade intraepithelial neoplasias | ||
| LGIN: Low-grade intraepithelial neoplasias | ||
| Oral Cavity |  | EOLP: Erosive Oral lichen planus |
| LP: leukoplakia | ||
| NEOLP: Non-erosive oral lichen planus | ||
| OSCC: Oral squamous cell carcinoma | ||
| Skin | 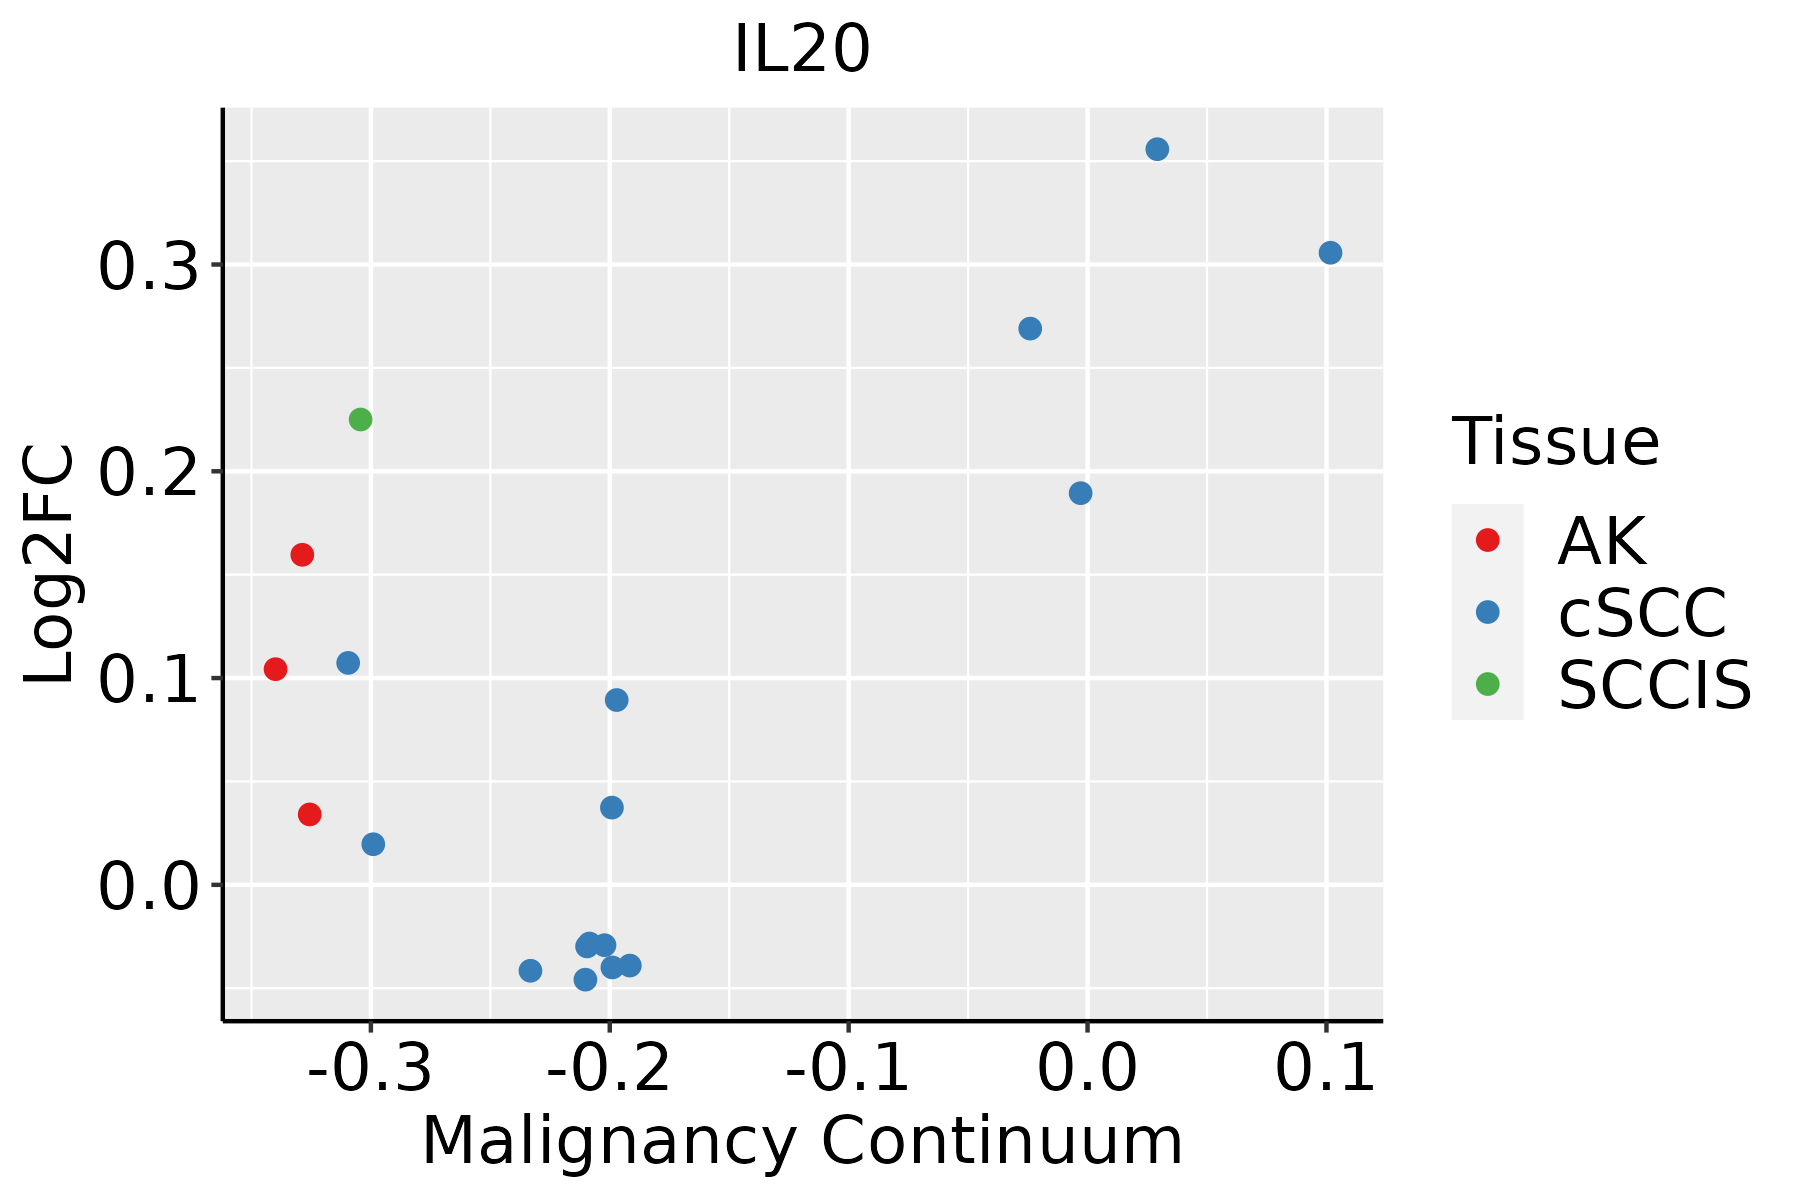 | AK: Actinic keratosis |
| cSCC: Cutaneous squamous cell carcinoma | ||
| SCCIS:squamous cell carcinoma in situ |
| ∗log2FC in expression of this searched gene in stem-like cells from each diseased tissue sample relative to stem-like cells in normal samples in each tissue plotted against the malignancy continuum. Samples are colored based on if they are from different disease stage. |
Top |
Malignant transformation related pathway analysis |
| Find out the enriched GO biological processes and KEGG pathways involved in transition from healthy to precancer to cancer |
| Tissue | Disease Stage | Enriched GO biological Processes |
| Colorectum | AD |  |
| Colorectum | SER |  |
| Colorectum | MSS |  |
| Colorectum | MSI-H |  |
| Colorectum | FAP |  |
| ∗Top 15 enriched GO BP terms are showed in the bar plot of each disease state in each tissue. Each row represents a significant GO biological process which is colored according to the -log10(p.adjust). |
| Page: 1 2 3 4 5 6 7 8 9 |
| GO ID | Tissue | Disease Stage | Description | Gene Ratio | Bg Ratio | pvalue | p.adjust | Count |
| GO:002240710 | Cervix | CC | regulation of cell-cell adhesion | 103/2311 | 448/18723 | 1.78e-10 | 2.87e-08 | 103 |
| GO:00421108 | Cervix | CC | T cell activation | 107/2311 | 487/18723 | 1.24e-09 | 1.46e-07 | 107 |
| GO:00508638 | Cervix | CC | regulation of T cell activation | 80/2311 | 329/18723 | 1.28e-09 | 1.47e-07 | 80 |
| GO:00071598 | Cervix | CC | leukocyte cell-cell adhesion | 85/2311 | 371/18723 | 8.27e-09 | 7.07e-07 | 85 |
| GO:00071626 | Cervix | CC | negative regulation of cell adhesion | 72/2311 | 303/18723 | 2.36e-08 | 1.70e-06 | 72 |
| GO:00026837 | Cervix | CC | negative regulation of immune system process | 94/2311 | 434/18723 | 2.63e-08 | 1.87e-06 | 94 |
| GO:19030378 | Cervix | CC | regulation of leukocyte cell-cell adhesion | 77/2311 | 336/18723 | 4.08e-08 | 2.54e-06 | 77 |
| GO:00027644 | Cervix | CC | immune response-regulating signaling pathway | 97/2311 | 468/18723 | 1.49e-07 | 7.07e-06 | 97 |
| GO:00018197 | Cervix | CC | positive regulation of cytokine production | 95/2311 | 467/18723 | 4.88e-07 | 1.85e-05 | 95 |
| GO:00420988 | Cervix | CC | T cell proliferation | 49/2311 | 199/18723 | 1.32e-06 | 4.49e-05 | 49 |
| GO:00224084 | Cervix | CC | negative regulation of cell-cell adhesion | 48/2311 | 196/18723 | 1.99e-06 | 6.18e-05 | 48 |
| GO:004887210 | Cervix | CC | homeostasis of number of cells | 61/2311 | 272/18723 | 2.17e-06 | 6.55e-05 | 61 |
| GO:00421297 | Cervix | CC | regulation of T cell proliferation | 43/2311 | 171/18723 | 3.21e-06 | 8.77e-05 | 43 |
| GO:00706637 | Cervix | CC | regulation of leukocyte proliferation | 55/2311 | 245/18723 | 6.51e-06 | 1.56e-04 | 55 |
| GO:00506705 | Cervix | CC | regulation of lymphocyte proliferation | 51/2311 | 225/18723 | 1.05e-05 | 2.32e-04 | 51 |
| GO:0051250 | Cervix | CC | negative regulation of lymphocyte activation | 39/2311 | 157/18723 | 1.23e-05 | 2.57e-04 | 39 |
| GO:00329444 | Cervix | CC | regulation of mononuclear cell proliferation | 51/2311 | 227/18723 | 1.36e-05 | 2.73e-04 | 51 |
| GO:00018949 | Cervix | CC | tissue homeostasis | 57/2311 | 268/18723 | 2.43e-05 | 4.21e-04 | 57 |
| GO:00706617 | Cervix | CC | leukocyte proliferation | 65/2311 | 318/18723 | 2.56e-05 | 4.32e-04 | 65 |
| GO:0002695 | Cervix | CC | negative regulation of leukocyte activation | 43/2311 | 187/18723 | 3.47e-05 | 5.60e-04 | 43 |
| Page: 1 2 3 4 5 6 7 8 9 10 11 12 13 |
| Pathway ID | Tissue | Disease Stage | Description | Gene Ratio | Bg Ratio | pvalue | p.adjust | qvalue | Count |
| Page: 1 |
Top |
Cell-cell communication analysis |
| Identification of potential cell-cell interactions between two cell types and their ligand-receptor pairs for different disease states |
| Ligand | Receptor | LRpair | Pathway | Tissue | Disease Stage |
| IL24 | IL20RA_IL20RB | IL24_IL20RA_IL20RB | IL10 | HNSCC | OSCC |
| IL24 | IL20RA_IL20RB | IL24_IL20RA_IL20RB | IL10 | HNSCC | Precancer |
| IL24 | IL22RA1_IL20RB | IL24_IL22RA1_IL20RB | IL10 | HNSCC | Precancer |
| Page: 1 |
Top |
Single-cell gene regulatory network inference analysis |
| Find out the significant the regulons (TFs) and the target genes of each regulon across cell types for different disease states |
| TF | Cell Type | Tissue | Disease Stage | Target Gene | RSS | Regulon Activity |
| ∗The dot plots of a searched regulon are shown for all cell subpopulations in each disease state of each tissue based on the regulon specific score inferred using pySCENIC and by calculating the average expression. |
| Page: 1 |
Top |
Somatic mutation of malignant transformation related genes |
| Annotation of somatic variants for genes involved in malignant transformation |
| Hugo Symbol | Variant Class | Variant Classification | dbSNP RS | HGVSc | HGVSp | HGVSp Short | SWISSPROT | BIOTYPE | SIFT | PolyPhen | Tumor Sample Barcode | Tissue | Histology | Sex | Age | Stage | Therapy Types | Drugs | Outcome |
| IL20 | SNV | Missense_Mutation | c.157G>A | p.Val53Met | p.V53M | Q9NYY1 | protein_coding | tolerated(0.07) | benign(0.132) | TCGA-D8-A1JC-01 | Breast | breast invasive carcinoma | Female | <65 | III/IV | Chemotherapy | adriamycin | SD | |
| IL20 | SNV | Missense_Mutation | c.408N>T | p.Glu136Asp | p.E136D | Q9NYY1 | protein_coding | deleterious(0.03) | possibly_damaging(0.6) | TCGA-EA-A3HS-01 | Cervix | cervical & endocervical cancer | Female | <65 | I/II | Unknown | Unknown | SD | |
| IL20 | SNV | Missense_Mutation | c.215N>G | p.Gln72Arg | p.Q72R | Q9NYY1 | protein_coding | tolerated(0.19) | benign(0.019) | TCGA-EK-A2RO-01 | Cervix | cervical & endocervical cancer | Female | <65 | I/II | Unknown | Unknown | SD | |
| IL20 | SNV | Missense_Mutation | c.41N>T | p.Ala14Val | p.A14V | Q9NYY1 | protein_coding | tolerated(1) | benign(0) | TCGA-AA-A010-01 | Colorectum | colon adenocarcinoma | Female | <65 | I/II | Chemotherapy | folinic | CR | |
| IL20 | SNV | Missense_Mutation | c.408N>T | p.Glu136Asp | p.E136D | Q9NYY1 | protein_coding | deleterious(0.03) | possibly_damaging(0.6) | TCGA-CK-5916-01 | Colorectum | colon adenocarcinoma | Female | >=65 | I/II | Unknown | Unknown | PD | |
| IL20 | SNV | Missense_Mutation | rs773706986 | c.236G>A | p.Arg79Gln | p.R79Q | Q9NYY1 | protein_coding | tolerated(0.31) | benign(0.034) | TCGA-AG-A002-01 | Colorectum | rectum adenocarcinoma | Male | <65 | I/II | Unknown | Unknown | SD |
| IL20 | SNV | Missense_Mutation | novel | c.137N>G | p.Phe46Cys | p.F46C | Q9NYY1 | protein_coding | deleterious(0) | probably_damaging(0.999) | TCGA-A5-A0G2-01 | Endometrium | uterine corpus endometrioid carcinoma | Female | <65 | III/IV | Unknown | Unknown | SD |
| IL20 | SNV | Missense_Mutation | novel | c.332N>T | p.Ser111Ile | p.S111I | Q9NYY1 | protein_coding | deleterious(0) | possibly_damaging(0.837) | TCGA-A5-A0G2-01 | Endometrium | uterine corpus endometrioid carcinoma | Female | <65 | III/IV | Unknown | Unknown | SD |
| IL20 | SNV | Missense_Mutation | novel | c.182N>G | p.Asp61Gly | p.D61G | Q9NYY1 | protein_coding | tolerated(0.08) | possibly_damaging(0.878) | TCGA-AJ-A5DW-01 | Endometrium | uterine corpus endometrioid carcinoma | Female | <65 | I/II | Unknown | Unknown | SD |
| IL20 | SNV | Missense_Mutation | c.519G>T | p.Glu173Asp | p.E173D | Q9NYY1 | protein_coding | tolerated(0.07) | possibly_damaging(0.5) | TCGA-AP-A056-01 | Endometrium | uterine corpus endometrioid carcinoma | Female | <65 | I/II | Unknown | Unknown | SD |
| Page: 1 2 3 |
Top |
Related drugs of malignant transformation related genes |
| Identification of chemicals and drugs interact with genes involved in malignant transfromation |
| (DGIdb 4.0) |
| Entrez ID | Symbol | Category | Interaction Types | Drug Claim Name | Drug Name | PMIDs |
| 50604 | IL20 | DRUGGABLE GENOME | NN-8226 |
| Page: 1 |

Copyright 2023-Present -The University of Texas Health Science Center at Houston |