
|
|||||
|
 | |
| |
| |
| |
| |
| |
|
Gene: IL1RN |
Gene summary for IL1RN |
| Gene information | Species | Human | Gene symbol | IL1RN | Gene ID | 3557 |
| Gene name | interleukin 1 receptor antagonist | |
| Gene Alias | DIRA | |
| Cytomap | 2q14.1 | |
| Gene Type | protein-coding | GO ID | GO:0001959 | UniProtAcc | P18510 |
Top |
Malignant transformation analysis |
| Identification of the aberrant gene expression in precancerous and cancerous lesions by comparing the gene expression of stem-like cells in diseased tissues with normal stem cells |
| Entrez ID | Symbol | Replicates | Species | Organ | Tissue | Adj P-value | Log2FC | Malignancy |
| 3557 | IL1RN | LZE24D1 | Human | Esophagus | HGIN | 3.84e-03 | 5.45e-01 | 0.054 |
| 3557 | IL1RN | P5T-E | Human | Esophagus | ESCC | 2.40e-03 | -1.47e-01 | 0.1327 |
| 3557 | IL1RN | P9T-E | Human | Esophagus | ESCC | 1.26e-02 | -2.50e-02 | 0.1131 |
| 3557 | IL1RN | P10T-E | Human | Esophagus | ESCC | 3.78e-02 | 6.16e-02 | 0.116 |
| 3557 | IL1RN | P16T-E | Human | Esophagus | ESCC | 3.75e-03 | -2.16e-01 | 0.1153 |
| 3557 | IL1RN | P21T-E | Human | Esophagus | ESCC | 1.58e-14 | 5.64e-01 | 0.1617 |
| 3557 | IL1RN | P22T-E | Human | Esophagus | ESCC | 3.85e-13 | 1.62e-01 | 0.1236 |
| 3557 | IL1RN | P23T-E | Human | Esophagus | ESCC | 5.78e-27 | 2.27e+00 | 0.108 |
| 3557 | IL1RN | P27T-E | Human | Esophagus | ESCC | 1.09e-07 | 2.89e-02 | 0.1055 |
| 3557 | IL1RN | P28T-E | Human | Esophagus | ESCC | 7.74e-07 | 5.02e-01 | 0.1149 |
| 3557 | IL1RN | P32T-E | Human | Esophagus | ESCC | 9.70e-04 | -1.95e-01 | 0.1666 |
| 3557 | IL1RN | P54T-E | Human | Esophagus | ESCC | 5.39e-20 | 1.20e+00 | 0.0975 |
| 3557 | IL1RN | P82T-E | Human | Esophagus | ESCC | 1.21e-05 | 1.22e+00 | 0.1072 |
| 3557 | IL1RN | P83T-E | Human | Esophagus | ESCC | 5.63e-11 | 1.50e+00 | 0.1738 |
| 3557 | IL1RN | P130T-E | Human | Esophagus | ESCC | 5.63e-15 | 8.18e-01 | 0.1676 |
| 3557 | IL1RN | C04 | Human | Oral cavity | OSCC | 5.68e-21 | 1.80e+00 | 0.2633 |
| 3557 | IL1RN | C21 | Human | Oral cavity | OSCC | 1.08e-21 | 2.32e+00 | 0.2678 |
| 3557 | IL1RN | C43 | Human | Oral cavity | OSCC | 3.98e-44 | 1.98e+00 | 0.1704 |
| 3557 | IL1RN | C46 | Human | Oral cavity | OSCC | 1.65e-11 | 4.58e-01 | 0.1673 |
| 3557 | IL1RN | C57 | Human | Oral cavity | OSCC | 2.86e-63 | 2.98e+00 | 0.1679 |
| Page: 1 2 3 4 |
| Tissue | Expression Dynamics | Abbreviation |
| Esophagus | 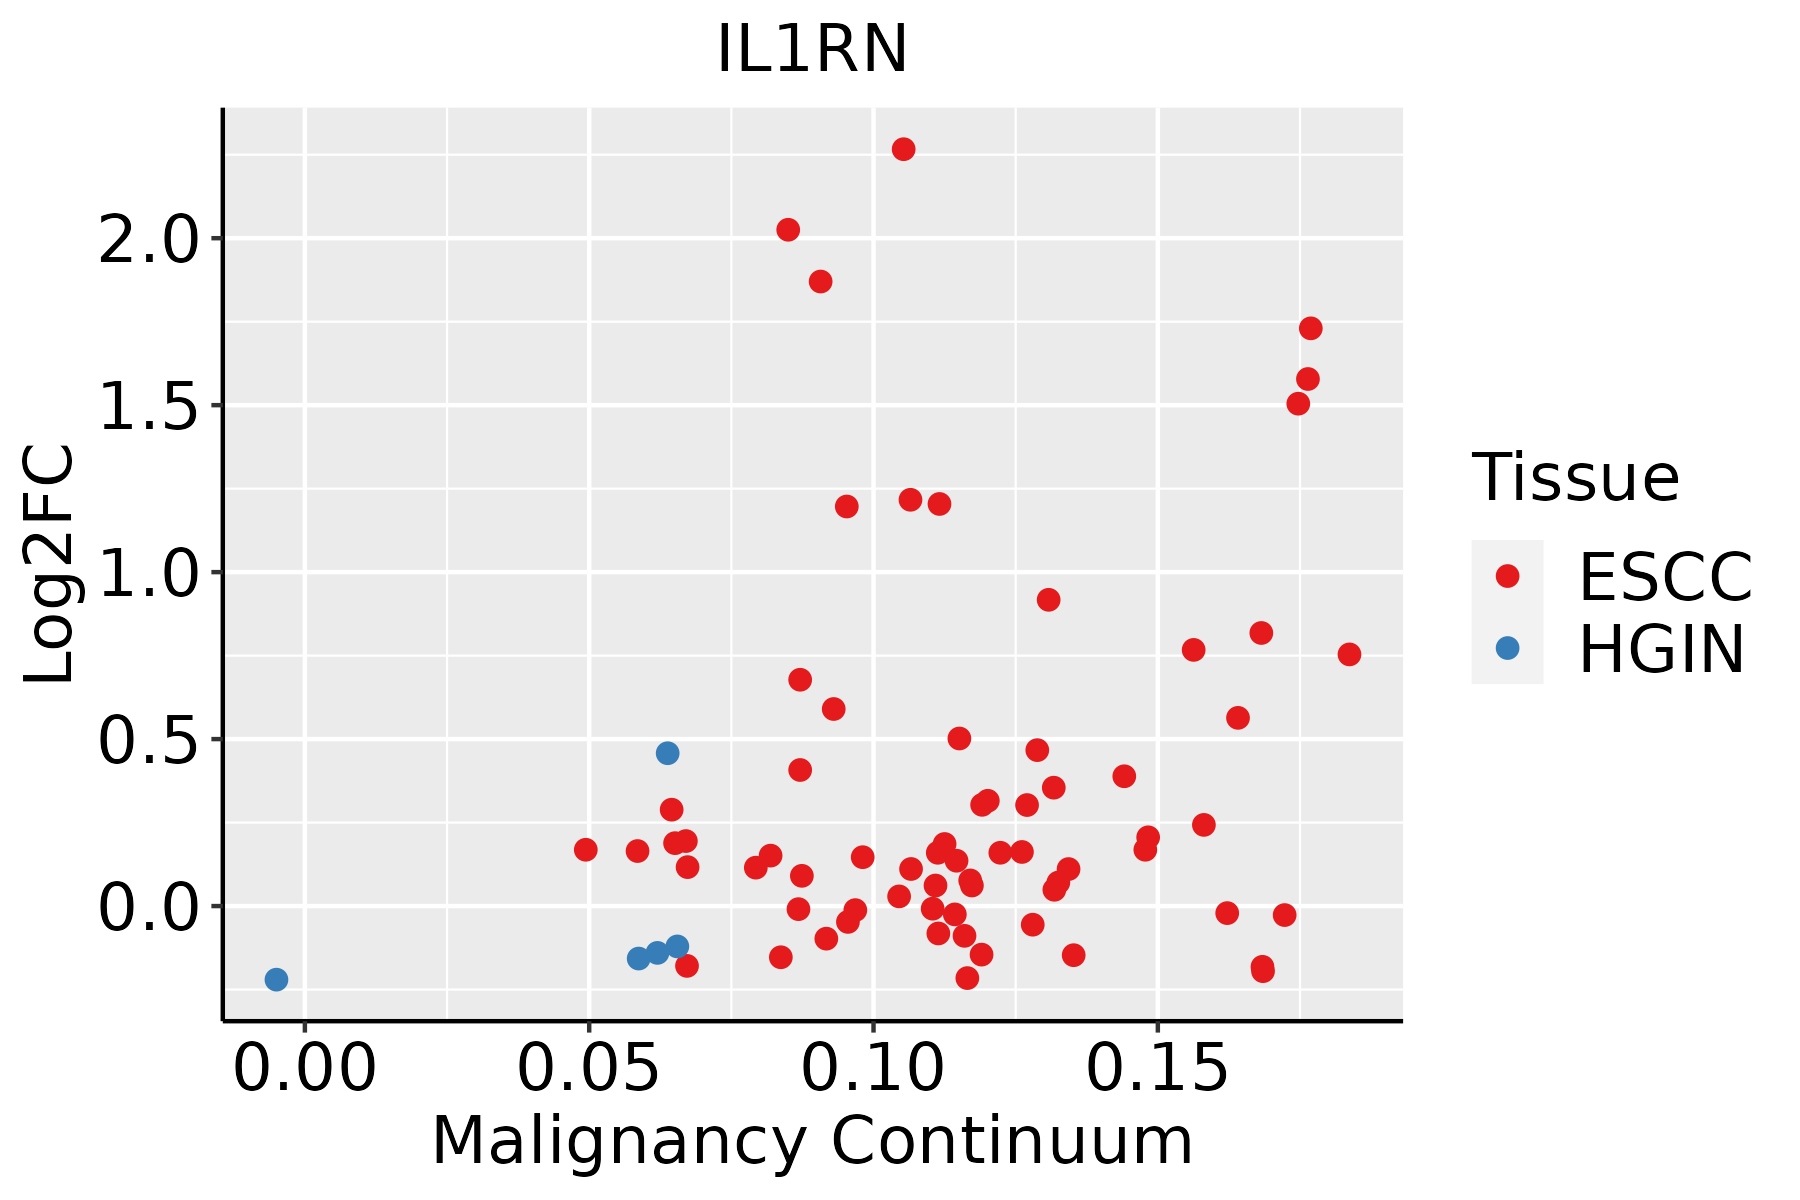 | ESCC: Esophageal squamous cell carcinoma |
| HGIN: High-grade intraepithelial neoplasias | ||
| LGIN: Low-grade intraepithelial neoplasias | ||
| GC | 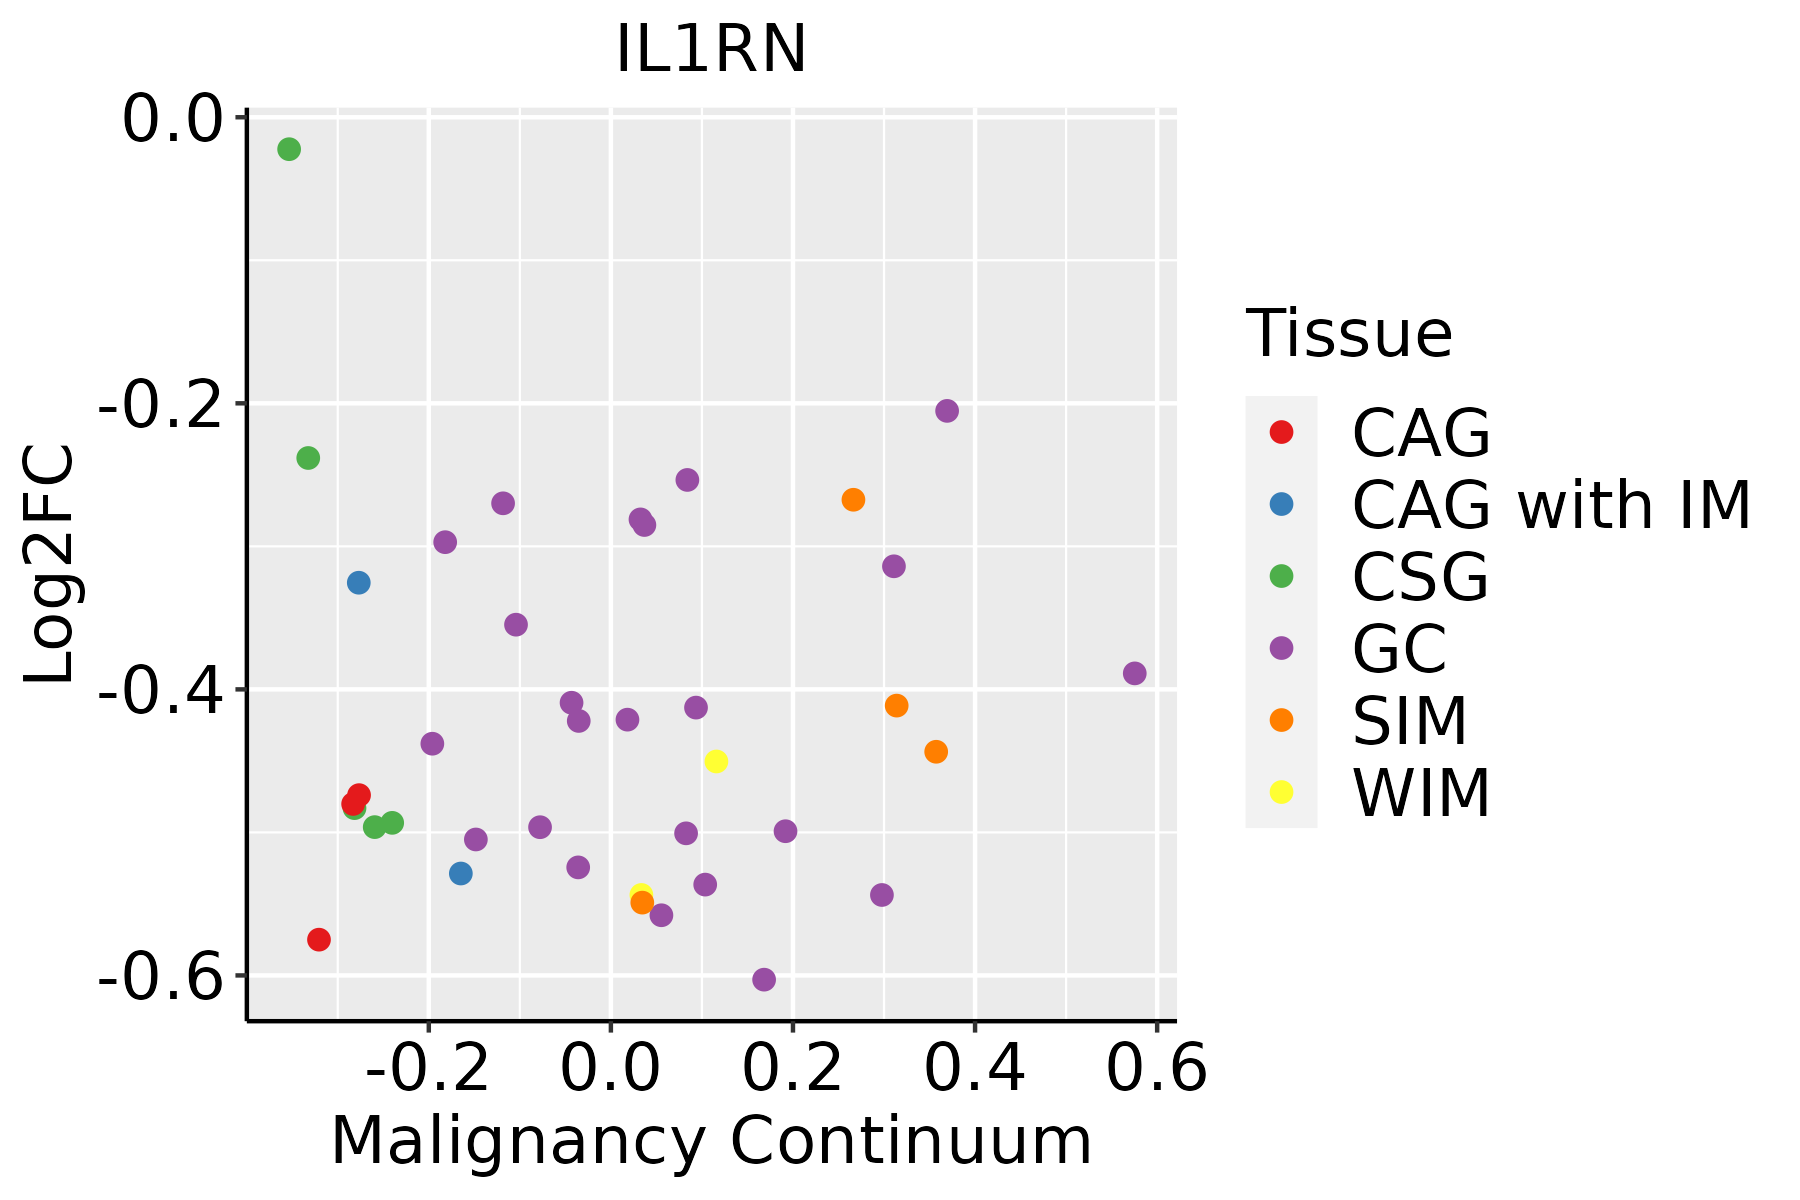 | CAG: Chronic atrophic gastritis |
| CAG with IM: Chronic atrophic gastritis with intestinal metaplasia | ||
| CSG: Chronic superficial gastritis | ||
| GC: Gastric cancer | ||
| SIM: Severe intestinal metaplasia | ||
| WIM: Wild intestinal metaplasia | ||
| Oral Cavity |  | EOLP: Erosive Oral lichen planus |
| LP: leukoplakia | ||
| NEOLP: Non-erosive oral lichen planus | ||
| OSCC: Oral squamous cell carcinoma | ||
| Skin | 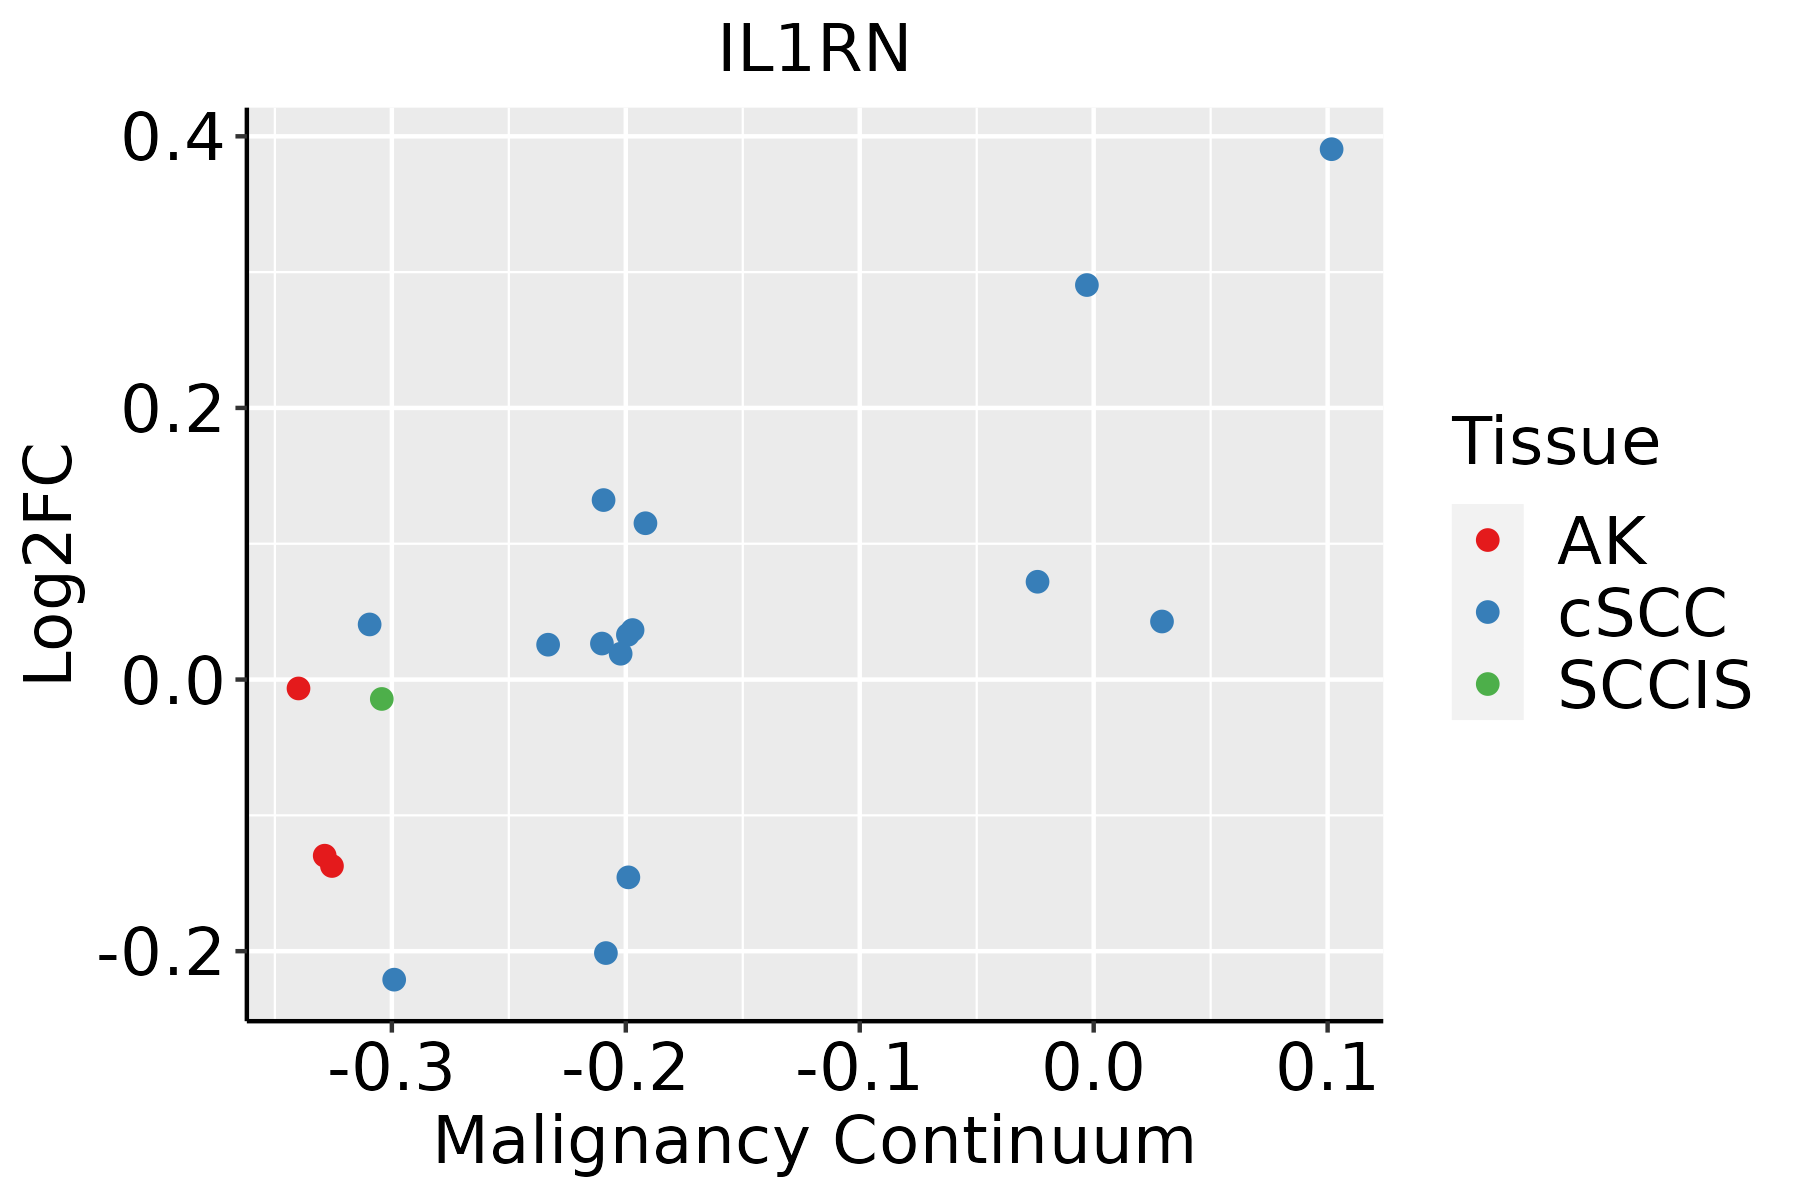 | AK: Actinic keratosis |
| cSCC: Cutaneous squamous cell carcinoma | ||
| SCCIS:squamous cell carcinoma in situ |
| ∗log2FC in expression of this searched gene in stem-like cells from each diseased tissue sample relative to stem-like cells in normal samples in each tissue plotted against the malignancy continuum. Samples are colored based on if they are from different disease stage. |
Top |
Malignant transformation related pathway analysis |
| Find out the enriched GO biological processes and KEGG pathways involved in transition from healthy to precancer to cancer |
| Tissue | Disease Stage | Enriched GO biological Processes |
| Colorectum | AD |  |
| Colorectum | SER |  |
| Colorectum | MSS |  |
| Colorectum | MSI-H |  |
| Colorectum | FAP |  |
| ∗Top 15 enriched GO BP terms are showed in the bar plot of each disease state in each tissue. Each row represents a significant GO biological process which is colored according to the -log10(p.adjust). |
| Page: 1 2 3 4 5 6 7 8 9 |
| GO ID | Tissue | Disease Stage | Description | Gene Ratio | Bg Ratio | pvalue | p.adjust | Count |
| GO:0048545111 | Esophagus | ESCC | response to steroid hormone | 204/8552 | 339/18723 | 4.47e-08 | 8.11e-07 | 204 |
| GO:00607595 | Esophagus | ESCC | regulation of response to cytokine stimulus | 103/8552 | 162/18723 | 3.14e-06 | 3.53e-05 | 103 |
| GO:00073698 | Esophagus | ESCC | gastrulation | 115/8552 | 185/18723 | 4.35e-06 | 4.64e-05 | 115 |
| GO:00019595 | Esophagus | ESCC | regulation of cytokine-mediated signaling pathway | 95/8552 | 150/18723 | 9.48e-06 | 9.04e-05 | 95 |
| GO:002240720 | Esophagus | ESCC | regulation of cell-cell adhesion | 239/8552 | 448/18723 | 5.88e-04 | 3.19e-03 | 239 |
| GO:003196020 | Esophagus | ESCC | response to corticosteroid | 95/8552 | 167/18723 | 2.27e-03 | 9.99e-03 | 95 |
| GO:005138420 | Esophagus | ESCC | response to glucocorticoid | 85/8552 | 148/18723 | 2.60e-03 | 1.11e-02 | 85 |
| GO:000930617 | Esophagus | ESCC | protein secretion | 190/8552 | 359/18723 | 3.22e-03 | 1.34e-02 | 190 |
| GO:003559217 | Esophagus | ESCC | establishment of protein localization to extracellular region | 190/8552 | 360/18723 | 3.77e-03 | 1.53e-02 | 190 |
| GO:007169210 | Esophagus | ESCC | protein localization to extracellular region | 193/8552 | 368/18723 | 5.01e-03 | 1.92e-02 | 193 |
| GO:00341143 | Esophagus | ESCC | regulation of heterotypic cell-cell adhesion | 18/8552 | 26/18723 | 1.32e-02 | 4.31e-02 | 18 |
| GO:00341135 | Esophagus | ESCC | heterotypic cell-cell adhesion | 37/8552 | 61/18723 | 1.32e-02 | 4.31e-02 | 37 |
| GO:004854520 | Oral cavity | OSCC | response to steroid hormone | 186/7305 | 339/18723 | 1.86e-09 | 4.42e-08 | 186 |
| GO:00019594 | Oral cavity | OSCC | regulation of cytokine-mediated signaling pathway | 87/7305 | 150/18723 | 1.82e-06 | 2.35e-05 | 87 |
| GO:00607594 | Oral cavity | OSCC | regulation of response to cytokine stimulus | 92/7305 | 162/18723 | 3.25e-06 | 3.90e-05 | 92 |
| GO:002240718 | Oral cavity | OSCC | regulation of cell-cell adhesion | 218/7305 | 448/18723 | 1.71e-05 | 1.68e-04 | 218 |
| GO:00192214 | Oral cavity | OSCC | cytokine-mediated signaling pathway | 222/7305 | 472/18723 | 2.02e-04 | 1.35e-03 | 222 |
| GO:00073697 | Oral cavity | OSCC | gastrulation | 95/7305 | 185/18723 | 4.17e-04 | 2.54e-03 | 95 |
| GO:003196018 | Oral cavity | OSCC | response to corticosteroid | 86/7305 | 167/18723 | 6.79e-04 | 3.79e-03 | 86 |
| GO:00071629 | Oral cavity | OSCC | negative regulation of cell adhesion | 145/7305 | 303/18723 | 9.95e-04 | 5.18e-03 | 145 |
| Page: 1 2 3 4 5 6 7 |
| Pathway ID | Tissue | Disease Stage | Description | Gene Ratio | Bg Ratio | pvalue | p.adjust | qvalue | Count |
| Page: 1 |
Top |
Cell-cell communication analysis |
| Identification of potential cell-cell interactions between two cell types and their ligand-receptor pairs for different disease states |
| Ligand | Receptor | LRpair | Pathway | Tissue | Disease Stage |
| Page: 1 |
Top |
Single-cell gene regulatory network inference analysis |
| Find out the significant the regulons (TFs) and the target genes of each regulon across cell types for different disease states |
| TF | Cell Type | Tissue | Disease Stage | Target Gene | RSS | Regulon Activity |
| ∗The dot plots of a searched regulon are shown for all cell subpopulations in each disease state of each tissue based on the regulon specific score inferred using pySCENIC and by calculating the average expression. |
| Page: 1 |
Top |
Somatic mutation of malignant transformation related genes |
| Annotation of somatic variants for genes involved in malignant transformation |
| Hugo Symbol | Variant Class | Variant Classification | dbSNP RS | HGVSc | HGVSp | HGVSp Short | SWISSPROT | BIOTYPE | SIFT | PolyPhen | Tumor Sample Barcode | Tissue | Histology | Sex | Age | Stage | Therapy Types | Drugs | Outcome |
| IL1RN | SNV | Missense_Mutation | c.301N>T | p.Gly101Cys | p.G101C | P18510 | protein_coding | deleterious(0) | probably_damaging(0.994) | TCGA-B6-A0IE-01 | Breast | breast invasive carcinoma | Female | <65 | III/IV | Unknown | Unknown | PD | |
| IL1RN | SNV | Missense_Mutation | novel | c.359N>A | p.Arg120Lys | p.R120K | P18510 | protein_coding | tolerated(1) | benign(0.001) | TCGA-BH-A0EE-01 | Breast | breast invasive carcinoma | Female | >=65 | I/II | Chemotherapy | docetaxel | SD |
| IL1RN | SNV | Missense_Mutation | rs764209607 | c.307N>A | p.Glu103Lys | p.E103K | P18510 | protein_coding | tolerated(0.38) | benign(0.031) | TCGA-C8-A26V-01 | Breast | breast invasive carcinoma | Female | <65 | III/IV | Hormone Therapy | tamoxiphen | CR |
| IL1RN | SNV | Missense_Mutation | c.392C>T | p.Ser131Leu | p.S131L | P18510 | protein_coding | tolerated(0.09) | benign(0.073) | TCGA-AA-3663-01 | Colorectum | colon adenocarcinoma | Male | <65 | I/II | Unknown | Unknown | SD | |
| IL1RN | SNV | Missense_Mutation | c.317T>G | p.Leu106Arg | p.L106R | P18510 | protein_coding | deleterious(0) | probably_damaging(1) | TCGA-AA-3864-01 | Colorectum | colon adenocarcinoma | Male | >=65 | I/II | Unknown | Unknown | SD | |
| IL1RN | SNV | Missense_Mutation | rs780956028 | c.389N>A | p.Arg130His | p.R130H | P18510 | protein_coding | tolerated(0.07) | probably_damaging(0.999) | TCGA-F4-6854-01 | Colorectum | colon adenocarcinoma | Female | >=65 | I/II | Unknown | Unknown | SD |
| IL1RN | SNV | Missense_Mutation | rs373101669 | c.374N>A | p.Arg125His | p.R125H | P18510 | protein_coding | deleterious(0.01) | possibly_damaging(0.771) | TCGA-AG-3887-01 | Colorectum | rectum adenocarcinoma | Male | >=65 | I/II | Chemotherapy | irinotecan | SD |
| IL1RN | SNV | Missense_Mutation | novel | c.149N>G | p.Thr50Ser | p.T50S | P18510 | protein_coding | tolerated(0.53) | benign(0.009) | TCGA-AG-A00Y-01 | Colorectum | rectum adenocarcinoma | Male | >=65 | I/II | Unknown | Unknown | PD |
| IL1RN | SNV | Missense_Mutation | rs143208167 | c.505N>A | p.Val169Ile | p.V169I | P18510 | protein_coding | tolerated(0.48) | benign(0) | TCGA-A5-A0GG-01 | Endometrium | uterine corpus endometrioid carcinoma | Female | >=65 | I/II | Unknown | Unknown | SD |
| IL1RN | SNV | Missense_Mutation | novel | c.157N>A | p.Leu53Met | p.L53M | P18510 | protein_coding | deleterious(0.05) | benign(0.191) | TCGA-AJ-A5DW-01 | Endometrium | uterine corpus endometrioid carcinoma | Female | <65 | I/II | Unknown | Unknown | SD |
| Page: 1 2 |
Top |
Related drugs of malignant transformation related genes |
| Identification of chemicals and drugs interact with genes involved in malignant transfromation |
| (DGIdb 4.0) |
| Entrez ID | Symbol | Category | Interaction Types | Drug Claim Name | Drug Name | PMIDs |
| 3557 | IL1RN | DRUGGABLE GENOME | AC-201 | DIACEREIN | ||
| 3557 | IL1RN | DRUGGABLE GENOME | haloperidol | HALOPERIDOL | 27023437 | |
| 3557 | IL1RN | DRUGGABLE GENOME | Tumor necrosis factor alpha (TNF-alpha) inhibitors | 24776844 | ||
| 3557 | IL1RN | DRUGGABLE GENOME | MTX | METHOTREXATE | 8877917 |
| Page: 1 |

Copyright 2023-Present -The University of Texas Health Science Center at Houston |