
|
|||||
|
 | |
| |
| |
| |
| |
| |
|
Gene: IL1RAPL1 |
Gene summary for IL1RAPL1 |
| Gene information | Species | Human | Gene symbol | IL1RAPL1 | Gene ID | 11141 |
| Gene name | interleukin 1 receptor accessory protein like 1 | |
| Gene Alias | IL-1-RAPL-1 | |
| Cytomap | Xp21.3-p21.2 | |
| Gene Type | protein-coding | GO ID | GO:0000902 | UniProtAcc | Q9NZN1 |
Top |
Malignant transformation analysis |
| Identification of the aberrant gene expression in precancerous and cancerous lesions by comparing the gene expression of stem-like cells in diseased tissues with normal stem cells |
| Entrez ID | Symbol | Replicates | Species | Organ | Tissue | Adj P-value | Log2FC | Malignancy |
| 11141 | IL1RAPL1 | HTA11_3410_2000001011 | Human | Colorectum | AD | 1.10e-28 | 6.44e-01 | 0.0155 |
| 11141 | IL1RAPL1 | HTA11_2487_2000001011 | Human | Colorectum | SER | 9.53e-15 | 5.96e-01 | -0.1808 |
| 11141 | IL1RAPL1 | HTA11_2951_2000001011 | Human | Colorectum | AD | 7.00e-14 | 8.67e-01 | 0.0216 |
| 11141 | IL1RAPL1 | HTA11_1938_2000001011 | Human | Colorectum | AD | 2.92e-37 | 1.23e+00 | -0.0811 |
| 11141 | IL1RAPL1 | HTA11_78_2000001011 | Human | Colorectum | AD | 5.80e-21 | 6.85e-01 | -0.1088 |
| 11141 | IL1RAPL1 | HTA11_347_2000001011 | Human | Colorectum | AD | 2.68e-51 | 1.09e+00 | -0.1954 |
| 11141 | IL1RAPL1 | HTA11_411_2000001011 | Human | Colorectum | SER | 1.51e-13 | 1.15e+00 | -0.2602 |
| 11141 | IL1RAPL1 | HTA11_2112_2000001011 | Human | Colorectum | SER | 1.08e-05 | 7.52e-01 | -0.2196 |
| 11141 | IL1RAPL1 | HTA11_3361_2000001011 | Human | Colorectum | AD | 2.45e-13 | 6.35e-01 | -0.1207 |
| 11141 | IL1RAPL1 | HTA11_83_2000001011 | Human | Colorectum | SER | 4.19e-14 | 7.80e-01 | -0.1526 |
| 11141 | IL1RAPL1 | HTA11_696_2000001011 | Human | Colorectum | AD | 1.53e-36 | 7.54e-01 | -0.1464 |
| 11141 | IL1RAPL1 | HTA11_866_2000001011 | Human | Colorectum | AD | 3.33e-21 | 5.63e-01 | -0.1001 |
| 11141 | IL1RAPL1 | HTA11_1391_2000001011 | Human | Colorectum | AD | 2.80e-42 | 1.19e+00 | -0.059 |
| 11141 | IL1RAPL1 | HTA11_2992_2000001011 | Human | Colorectum | SER | 8.43e-24 | 1.12e+00 | -0.1706 |
| 11141 | IL1RAPL1 | HTA11_5212_2000001011 | Human | Colorectum | AD | 1.92e-09 | 6.56e-01 | -0.2061 |
| 11141 | IL1RAPL1 | HTA11_5216_2000001011 | Human | Colorectum | SER | 6.44e-12 | 8.85e-01 | -0.1462 |
| 11141 | IL1RAPL1 | HTA11_546_2000001011 | Human | Colorectum | AD | 2.19e-06 | 6.04e-01 | -0.0842 |
| 11141 | IL1RAPL1 | HTA11_9341_2000001011 | Human | Colorectum | SER | 4.89e-03 | 6.16e-01 | -0.00410000000000005 |
| 11141 | IL1RAPL1 | HTA11_7862_2000001011 | Human | Colorectum | AD | 3.03e-22 | 9.55e-01 | -0.0179 |
| 11141 | IL1RAPL1 | HTA11_866_3004761011 | Human | Colorectum | AD | 2.67e-68 | 1.55e+00 | 0.096 |
| Page: 1 2 3 |
| Tissue | Expression Dynamics | Abbreviation |
| Colorectum (GSE201348) |  | FAP: Familial adenomatous polyposis |
| CRC: Colorectal cancer | ||
| Colorectum (HTA11) |  | AD: Adenomas |
| SER: Sessile serrated lesions | ||
| MSI-H: Microsatellite-high colorectal cancer | ||
| MSS: Microsatellite stable colorectal cancer | ||
| Endometrium | 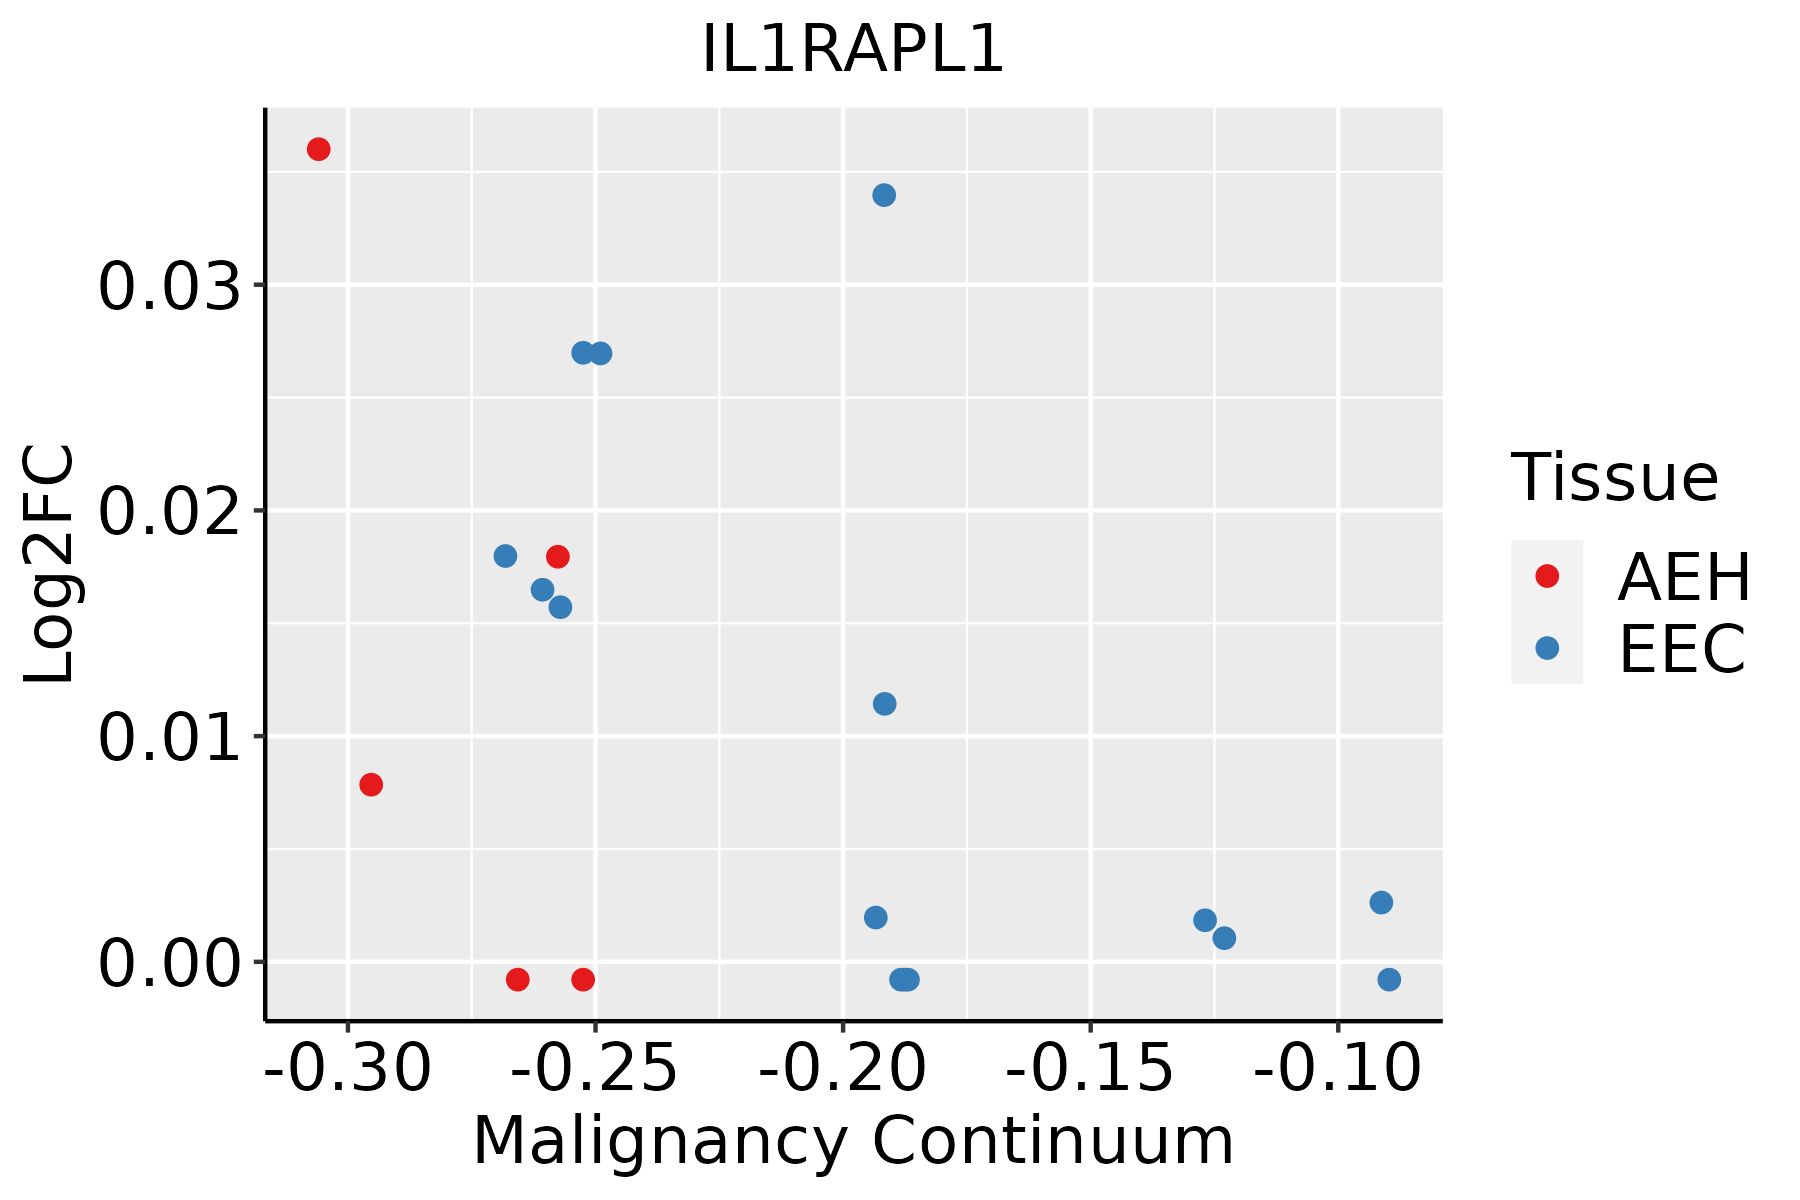 | AEH: Atypical endometrial hyperplasia |
| EEC: Endometrioid Cancer | ||
| Prostate | 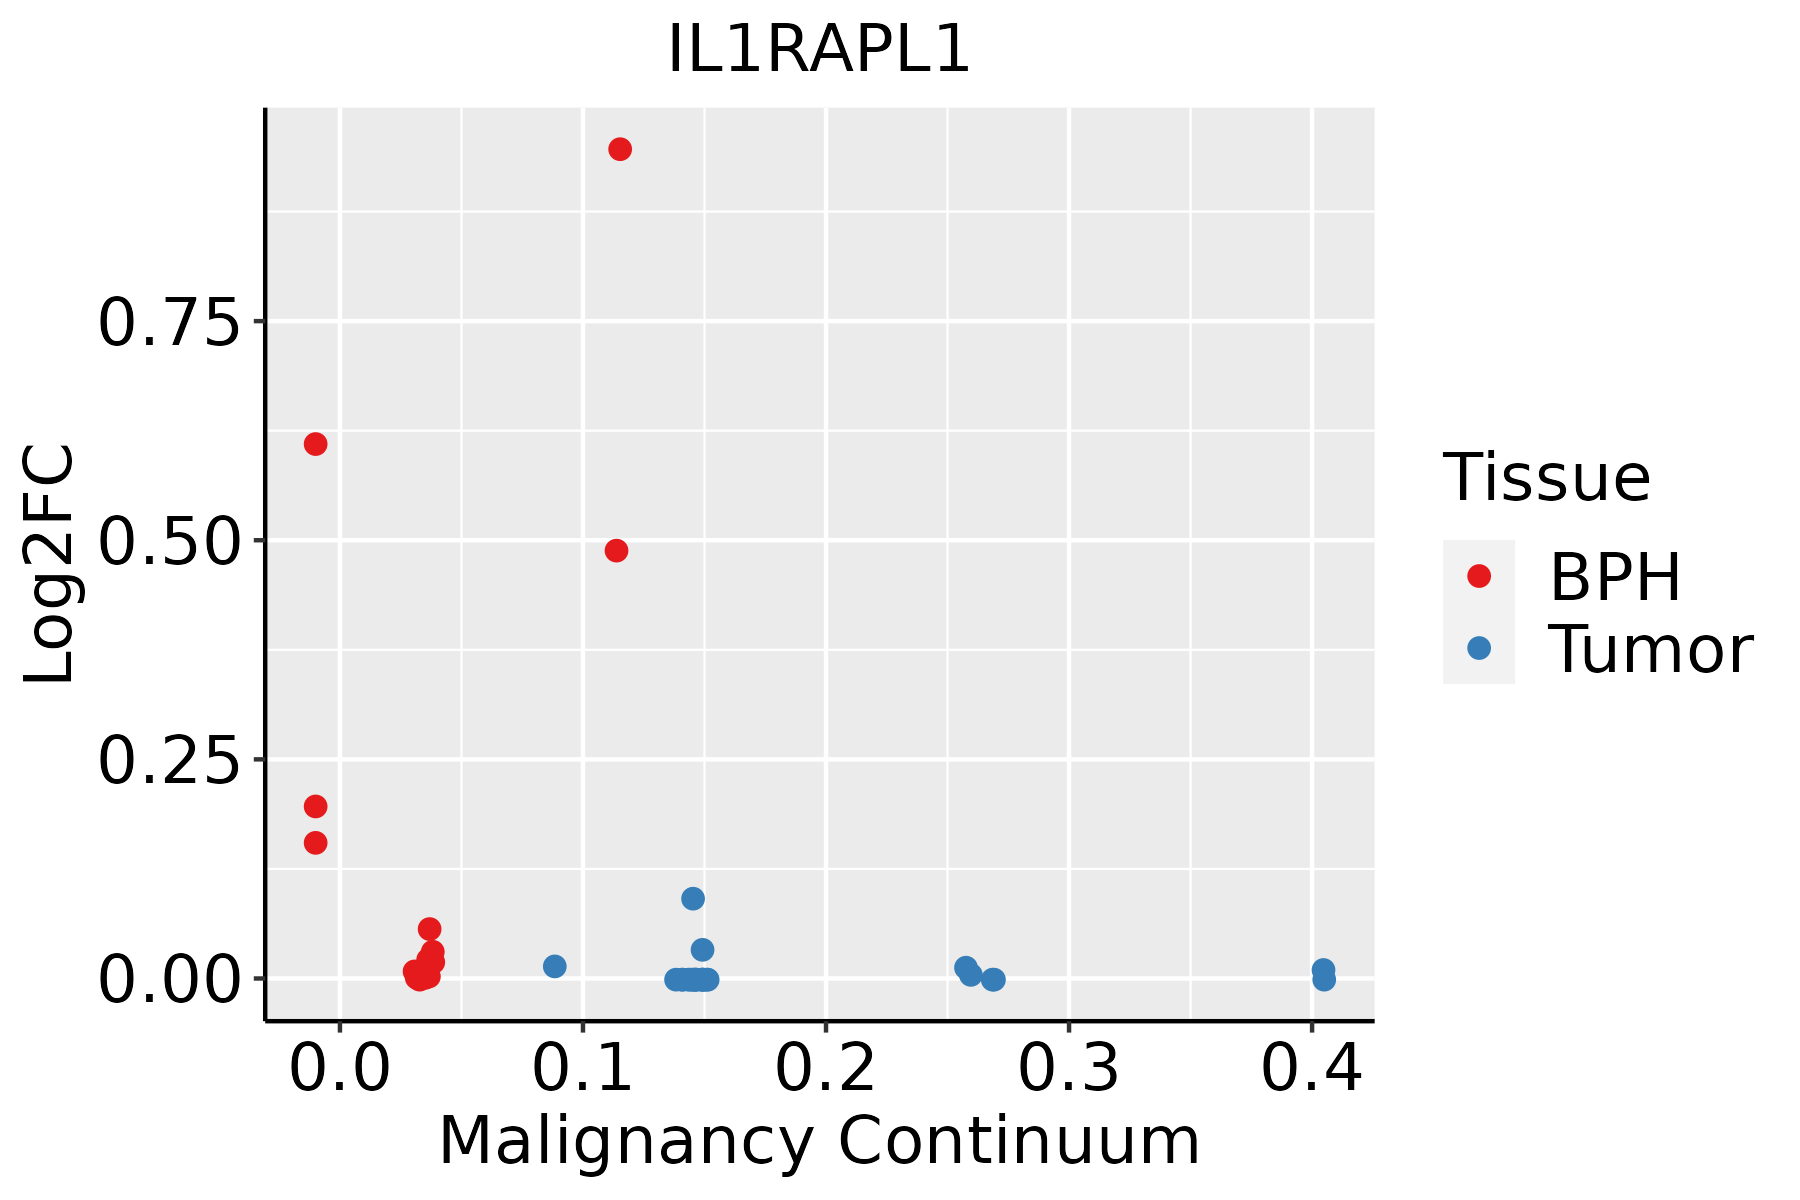 | BPH: Benign Prostatic Hyperplasia |
| ∗log2FC in expression of this searched gene in stem-like cells from each diseased tissue sample relative to stem-like cells in normal samples in each tissue plotted against the malignancy continuum. Samples are colored based on if they are from different disease stage. |
Top |
Malignant transformation related pathway analysis |
| Find out the enriched GO biological processes and KEGG pathways involved in transition from healthy to precancer to cancer |
| Tissue | Disease Stage | Enriched GO biological Processes |
| Colorectum | AD |  |
| Colorectum | SER |  |
| Colorectum | MSS |  |
| Colorectum | MSI-H |  |
| Colorectum | FAP |  |
| ∗Top 15 enriched GO BP terms are showed in the bar plot of each disease state in each tissue. Each row represents a significant GO biological process which is colored according to the -log10(p.adjust). |
| Page: 1 2 3 4 5 6 7 8 9 |
| GO ID | Tissue | Disease Stage | Description | Gene Ratio | Bg Ratio | pvalue | p.adjust | Count |
| GO:0022604 | Colorectum | AD | regulation of cell morphogenesis | 109/3918 | 309/18723 | 3.08e-09 | 2.07e-07 | 109 |
| GO:0034329 | Colorectum | AD | cell junction assembly | 136/3918 | 420/18723 | 2.02e-08 | 1.15e-06 | 136 |
| GO:0010975 | Colorectum | AD | regulation of neuron projection development | 129/3918 | 445/18723 | 2.88e-05 | 5.37e-04 | 129 |
| GO:0031346 | Colorectum | AD | positive regulation of cell projection organization | 104/3918 | 353/18723 | 8.26e-05 | 1.30e-03 | 104 |
| GO:0071709 | Colorectum | AD | membrane assembly | 22/3918 | 50/18723 | 2.00e-04 | 2.66e-03 | 22 |
| GO:0010769 | Colorectum | AD | regulation of cell morphogenesis involved in differentiation | 35/3918 | 96/18723 | 3.26e-04 | 3.85e-03 | 35 |
| GO:0010770 | Colorectum | AD | positive regulation of cell morphogenesis involved in differentiation | 30/3918 | 79/18723 | 3.81e-04 | 4.38e-03 | 30 |
| GO:0010720 | Colorectum | AD | positive regulation of cell development | 87/3918 | 298/18723 | 4.17e-04 | 4.71e-03 | 87 |
| GO:0044091 | Colorectum | AD | membrane biogenesis | 22/3918 | 55/18723 | 9.88e-04 | 9.28e-03 | 22 |
| GO:1901888 | Colorectum | AD | regulation of cell junction assembly | 61/3918 | 204/18723 | 1.50e-03 | 1.27e-02 | 61 |
| GO:0050767 | Colorectum | AD | regulation of neurogenesis | 99/3918 | 364/18723 | 2.35e-03 | 1.82e-02 | 99 |
| GO:0099173 | Colorectum | AD | postsynapse organization | 51/3918 | 168/18723 | 2.47e-03 | 1.90e-02 | 51 |
| GO:0006887 | Colorectum | AD | exocytosis | 96/3918 | 352/18723 | 2.48e-03 | 1.90e-02 | 96 |
| GO:0017157 | Colorectum | AD | regulation of exocytosis | 59/3918 | 202/18723 | 3.20e-03 | 2.36e-02 | 59 |
| GO:0016358 | Colorectum | AD | dendrite development | 69/3918 | 243/18723 | 3.32e-03 | 2.42e-02 | 69 |
| GO:0050808 | Colorectum | AD | synapse organization | 112/3918 | 426/18723 | 4.25e-03 | 2.92e-02 | 112 |
| GO:0050807 | Colorectum | AD | regulation of synapse organization | 60/3918 | 211/18723 | 5.67e-03 | 3.64e-02 | 60 |
| GO:00226041 | Colorectum | SER | regulation of cell morphogenesis | 89/2897 | 309/18723 | 1.51e-09 | 1.52e-07 | 89 |
| GO:00343291 | Colorectum | SER | cell junction assembly | 100/2897 | 420/18723 | 4.23e-06 | 1.61e-04 | 100 |
| GO:00717091 | Colorectum | SER | membrane assembly | 20/2897 | 50/18723 | 2.45e-05 | 6.84e-04 | 20 |
| Page: 1 2 3 4 |
| Pathway ID | Tissue | Disease Stage | Description | Gene Ratio | Bg Ratio | pvalue | p.adjust | qvalue | Count |
| Page: 1 |
Top |
Cell-cell communication analysis |
| Identification of potential cell-cell interactions between two cell types and their ligand-receptor pairs for different disease states |
| Ligand | Receptor | LRpair | Pathway | Tissue | Disease Stage |
| Page: 1 |
Top |
Single-cell gene regulatory network inference analysis |
| Find out the significant the regulons (TFs) and the target genes of each regulon across cell types for different disease states |
| TF | Cell Type | Tissue | Disease Stage | Target Gene | RSS | Regulon Activity |
| ∗The dot plots of a searched regulon are shown for all cell subpopulations in each disease state of each tissue based on the regulon specific score inferred using pySCENIC and by calculating the average expression. |
| Page: 1 |
Top |
Somatic mutation of malignant transformation related genes |
| Annotation of somatic variants for genes involved in malignant transformation |
| Hugo Symbol | Variant Class | Variant Classification | dbSNP RS | HGVSc | HGVSp | HGVSp Short | SWISSPROT | BIOTYPE | SIFT | PolyPhen | Tumor Sample Barcode | Tissue | Histology | Sex | Age | Stage | Therapy Types | Drugs | Outcome |
| IL1RAPL1 | SNV | Missense_Mutation | c.2088N>T | p.Trp696Cys | p.W696C | Q9NZN1 | protein_coding | deleterious_low_confidence(0) | probably_damaging(0.991) | TCGA-A2-A04P-01 | Breast | breast invasive carcinoma | Female | <65 | III/IV | Chemotherapy | taxol | PD | |
| IL1RAPL1 | SNV | Missense_Mutation | c.848G>T | p.Trp283Leu | p.W283L | Q9NZN1 | protein_coding | deleterious(0.02) | probably_damaging(1) | TCGA-A2-A04R-01 | Breast | breast invasive carcinoma | Female | <65 | I/II | Chemotherapy | taxol | SD | |
| IL1RAPL1 | SNV | Missense_Mutation | c.28C>G | p.Leu10Val | p.L10V | Q9NZN1 | protein_coding | tolerated(0.21) | benign(0.003) | TCGA-A2-A04W-01 | Breast | breast invasive carcinoma | Female | <65 | I/II | Chemotherapy | cytoxan | SD | |
| IL1RAPL1 | SNV | Missense_Mutation | rs766627012 | c.316C>T | p.Arg106Trp | p.R106W | Q9NZN1 | protein_coding | tolerated(0.16) | probably_damaging(0.983) | TCGA-A2-A04W-01 | Breast | breast invasive carcinoma | Female | <65 | I/II | Chemotherapy | cytoxan | SD |
| IL1RAPL1 | SNV | Missense_Mutation | c.1055N>T | p.Arg352Leu | p.R352L | Q9NZN1 | protein_coding | deleterious(0.04) | benign(0.341) | TCGA-AC-A23H-01 | Breast | breast invasive carcinoma | Female | >=65 | I/II | Unknown | Unknown | PD | |
| IL1RAPL1 | SNV | Missense_Mutation | c.1315N>A | p.Glu439Lys | p.E439K | Q9NZN1 | protein_coding | deleterious(0) | probably_damaging(1) | TCGA-AC-A23H-01 | Breast | breast invasive carcinoma | Female | >=65 | I/II | Unknown | Unknown | PD | |
| IL1RAPL1 | SNV | Missense_Mutation | c.97N>A | p.Asp33Asn | p.D33N | Q9NZN1 | protein_coding | deleterious(0) | probably_damaging(1) | TCGA-AO-A03L-01 | Breast | breast invasive carcinoma | Female | <65 | III/IV | Chemotherapy | cyclophosphamide | SD | |
| IL1RAPL1 | SNV | Missense_Mutation | c.601C>G | p.Leu201Val | p.L201V | Q9NZN1 | protein_coding | tolerated(0.11) | possibly_damaging(0.721) | TCGA-C8-A27B-01 | Breast | breast invasive carcinoma | Female | <65 | I/II | Chemotherapy | 5-fluorouracil | CR | |
| IL1RAPL1 | SNV | Missense_Mutation | rs778199033 | c.349G>A | p.Ala117Thr | p.A117T | Q9NZN1 | protein_coding | tolerated(1) | benign(0.009) | TCGA-E9-A1ND-01 | Breast | breast invasive carcinoma | Female | >=65 | I/II | Hormone Therapy | aromasin | SD |
| IL1RAPL1 | SNV | Missense_Mutation | novel | c.514N>G | p.Leu172Val | p.L172V | Q9NZN1 | protein_coding | deleterious(0.03) | benign(0.012) | TCGA-E9-A5FL-01 | Breast | breast invasive carcinoma | Female | >=65 | I/II | Unknown | Unknown | SD |
| Page: 1 2 3 4 5 6 7 8 9 10 11 12 13 14 15 16 17 |
Top |
Related drugs of malignant transformation related genes |
| Identification of chemicals and drugs interact with genes involved in malignant transfromation |
| (DGIdb 4.0) |
| Entrez ID | Symbol | Category | Interaction Types | Drug Claim Name | Drug Name | PMIDs |
| Page: 1 |

Copyright 2023-Present -The University of Texas Health Science Center at Houston |