
|
|||||
|
 | |
| |
| |
| |
| |
| |
|
Gene: IL1RAP |
Gene summary for IL1RAP |
| Gene information | Species | Human | Gene symbol | IL1RAP | Gene ID | 3556 |
| Gene name | interleukin 1 receptor accessory protein | |
| Gene Alias | C3orf13 | |
| Cytomap | 3q28 | |
| Gene Type | protein-coding | GO ID | GO:0001816 | UniProtAcc | A8K6K4 |
Top |
Malignant transformation analysis |
| Identification of the aberrant gene expression in precancerous and cancerous lesions by comparing the gene expression of stem-like cells in diseased tissues with normal stem cells |
| Entrez ID | Symbol | Replicates | Species | Organ | Tissue | Adj P-value | Log2FC | Malignancy |
| 3556 | IL1RAP | CCI_1 | Human | Cervix | CC | 1.27e-07 | 9.58e-01 | 0.528 |
| 3556 | IL1RAP | CCI_2 | Human | Cervix | CC | 1.32e-10 | 1.16e+00 | 0.5249 |
| 3556 | IL1RAP | CCI_3 | Human | Cervix | CC | 2.79e-13 | 9.20e-01 | 0.516 |
| 3556 | IL1RAP | Tumor | Human | Cervix | CC | 1.05e-02 | 1.83e-01 | 0.1241 |
| 3556 | IL1RAP | sample3 | Human | Cervix | CC | 1.53e-09 | 2.35e-01 | 0.1387 |
| 3556 | IL1RAP | T1 | Human | Cervix | CC | 2.47e-02 | 2.23e-01 | 0.0918 |
| 3556 | IL1RAP | LZE4T | Human | Esophagus | ESCC | 1.00e-12 | 4.57e-01 | 0.0811 |
| 3556 | IL1RAP | LZE24T | Human | Esophagus | ESCC | 5.23e-03 | 1.54e-02 | 0.0596 |
| 3556 | IL1RAP | LZE6T | Human | Esophagus | ESCC | 3.88e-02 | 1.83e-02 | 0.0845 |
| 3556 | IL1RAP | P2T-E | Human | Esophagus | ESCC | 8.93e-33 | 7.31e-01 | 0.1177 |
| 3556 | IL1RAP | P4T-E | Human | Esophagus | ESCC | 3.18e-09 | 3.12e-01 | 0.1323 |
| 3556 | IL1RAP | P5T-E | Human | Esophagus | ESCC | 3.62e-16 | 4.34e-01 | 0.1327 |
| 3556 | IL1RAP | P8T-E | Human | Esophagus | ESCC | 5.75e-14 | 4.27e-01 | 0.0889 |
| 3556 | IL1RAP | P9T-E | Human | Esophagus | ESCC | 2.05e-07 | 1.90e-01 | 0.1131 |
| 3556 | IL1RAP | P10T-E | Human | Esophagus | ESCC | 6.52e-35 | 7.34e-01 | 0.116 |
| 3556 | IL1RAP | P11T-E | Human | Esophagus | ESCC | 5.81e-20 | 7.91e-01 | 0.1426 |
| 3556 | IL1RAP | P12T-E | Human | Esophagus | ESCC | 1.72e-06 | -5.46e-02 | 0.1122 |
| 3556 | IL1RAP | P15T-E | Human | Esophagus | ESCC | 1.98e-07 | 1.83e-01 | 0.1149 |
| 3556 | IL1RAP | P16T-E | Human | Esophagus | ESCC | 2.70e-13 | 2.28e-01 | 0.1153 |
| 3556 | IL1RAP | P19T-E | Human | Esophagus | ESCC | 3.31e-08 | 7.43e-01 | 0.1662 |
| Page: 1 2 3 4 5 6 |
| Tissue | Expression Dynamics | Abbreviation |
| Cervix | 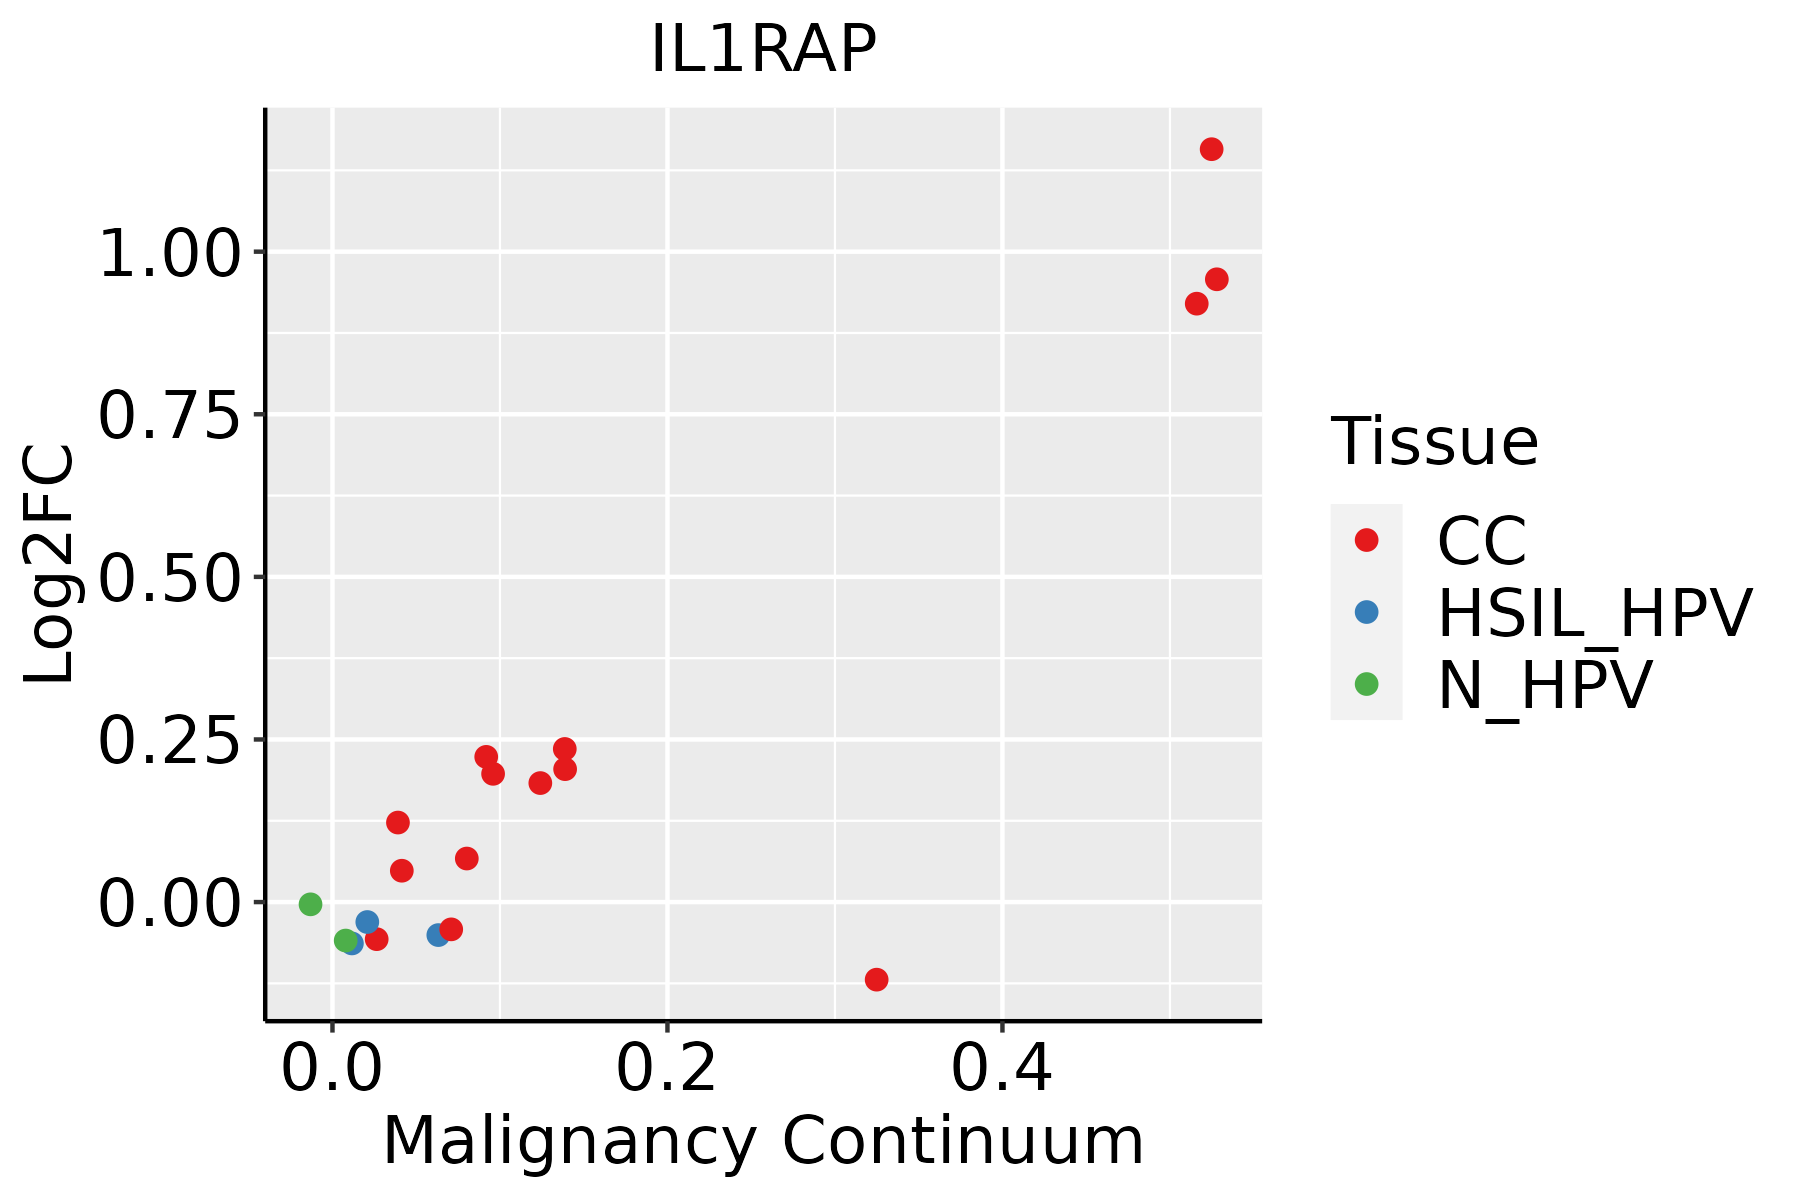 | CC: Cervix cancer |
| HSIL_HPV: HPV-infected high-grade squamous intraepithelial lesions | ||
| N_HPV: HPV-infected normal cervix | ||
| Esophagus |  | ESCC: Esophageal squamous cell carcinoma |
| HGIN: High-grade intraepithelial neoplasias | ||
| LGIN: Low-grade intraepithelial neoplasias | ||
| Liver | 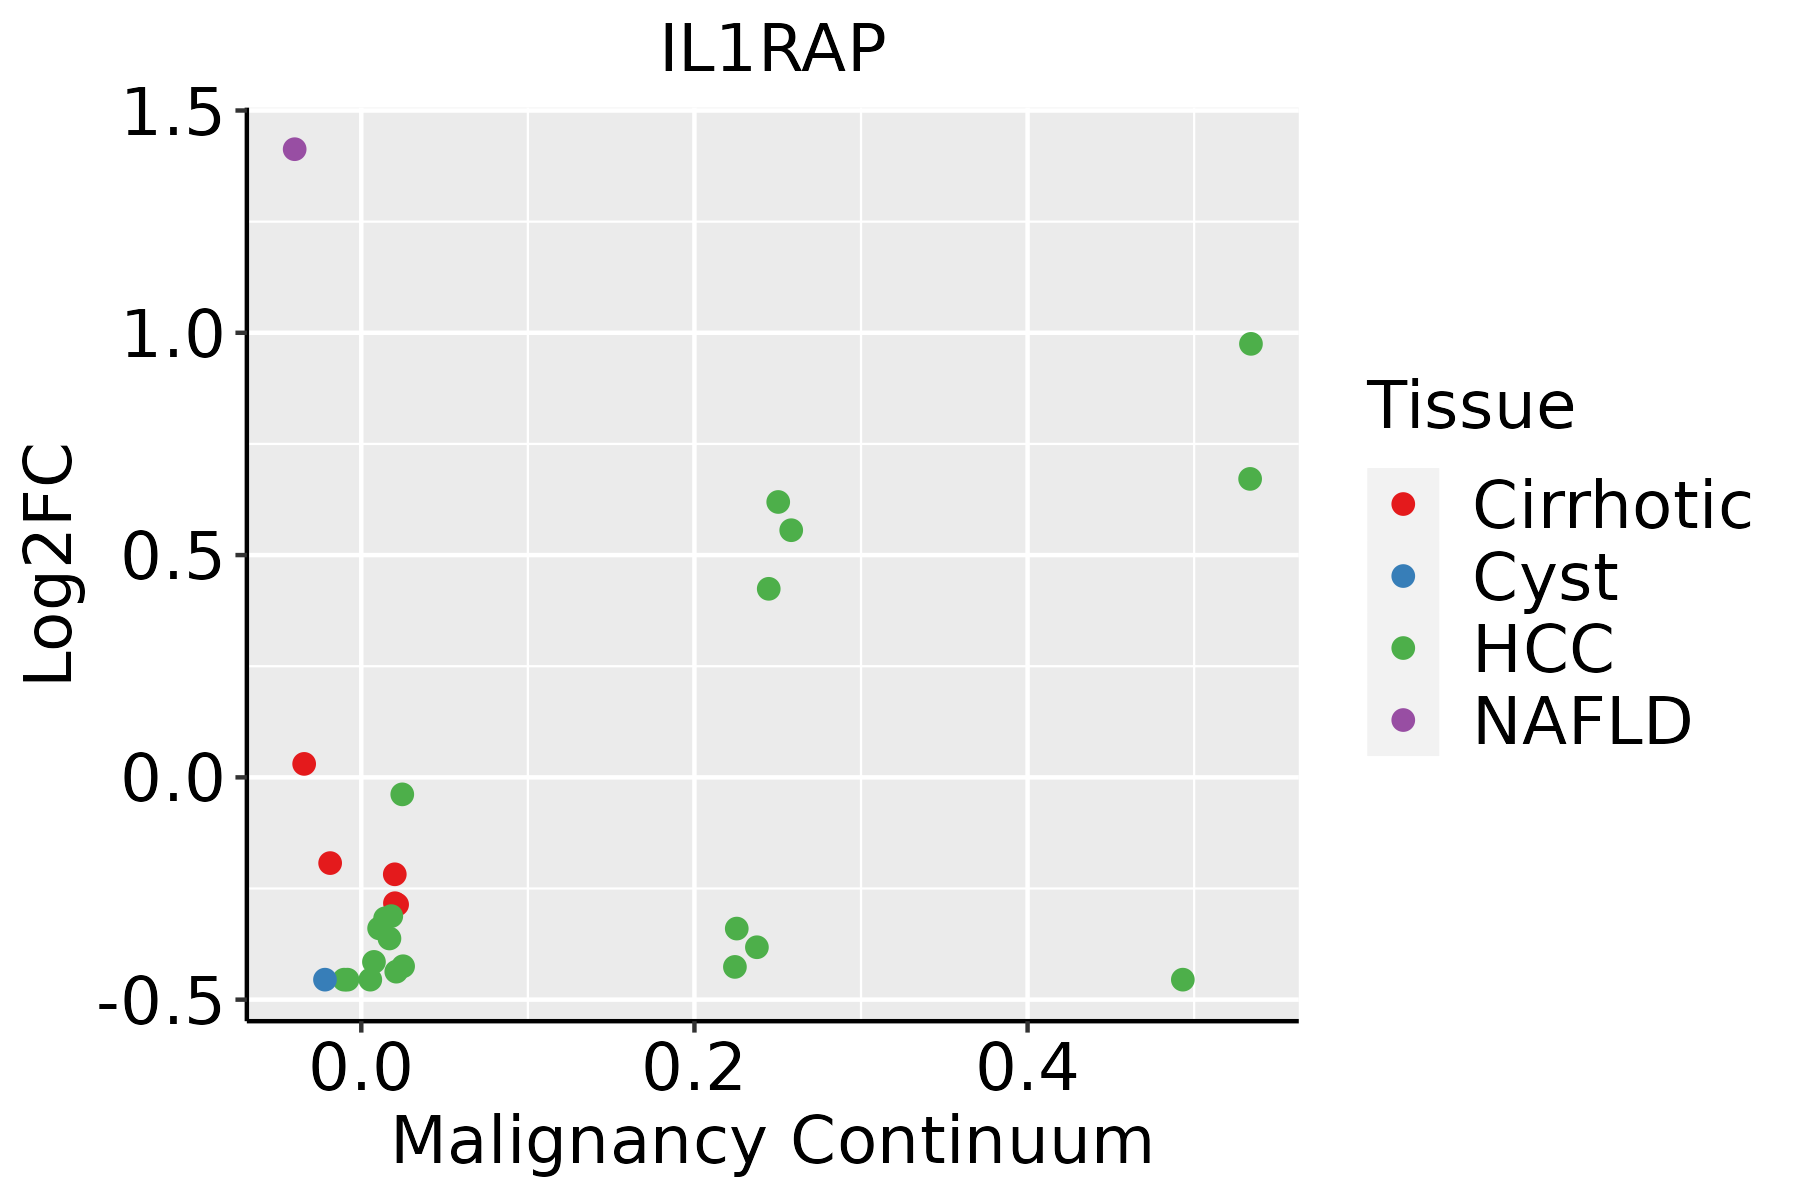 | HCC: Hepatocellular carcinoma |
| NAFLD: Non-alcoholic fatty liver disease | ||
| Lung | 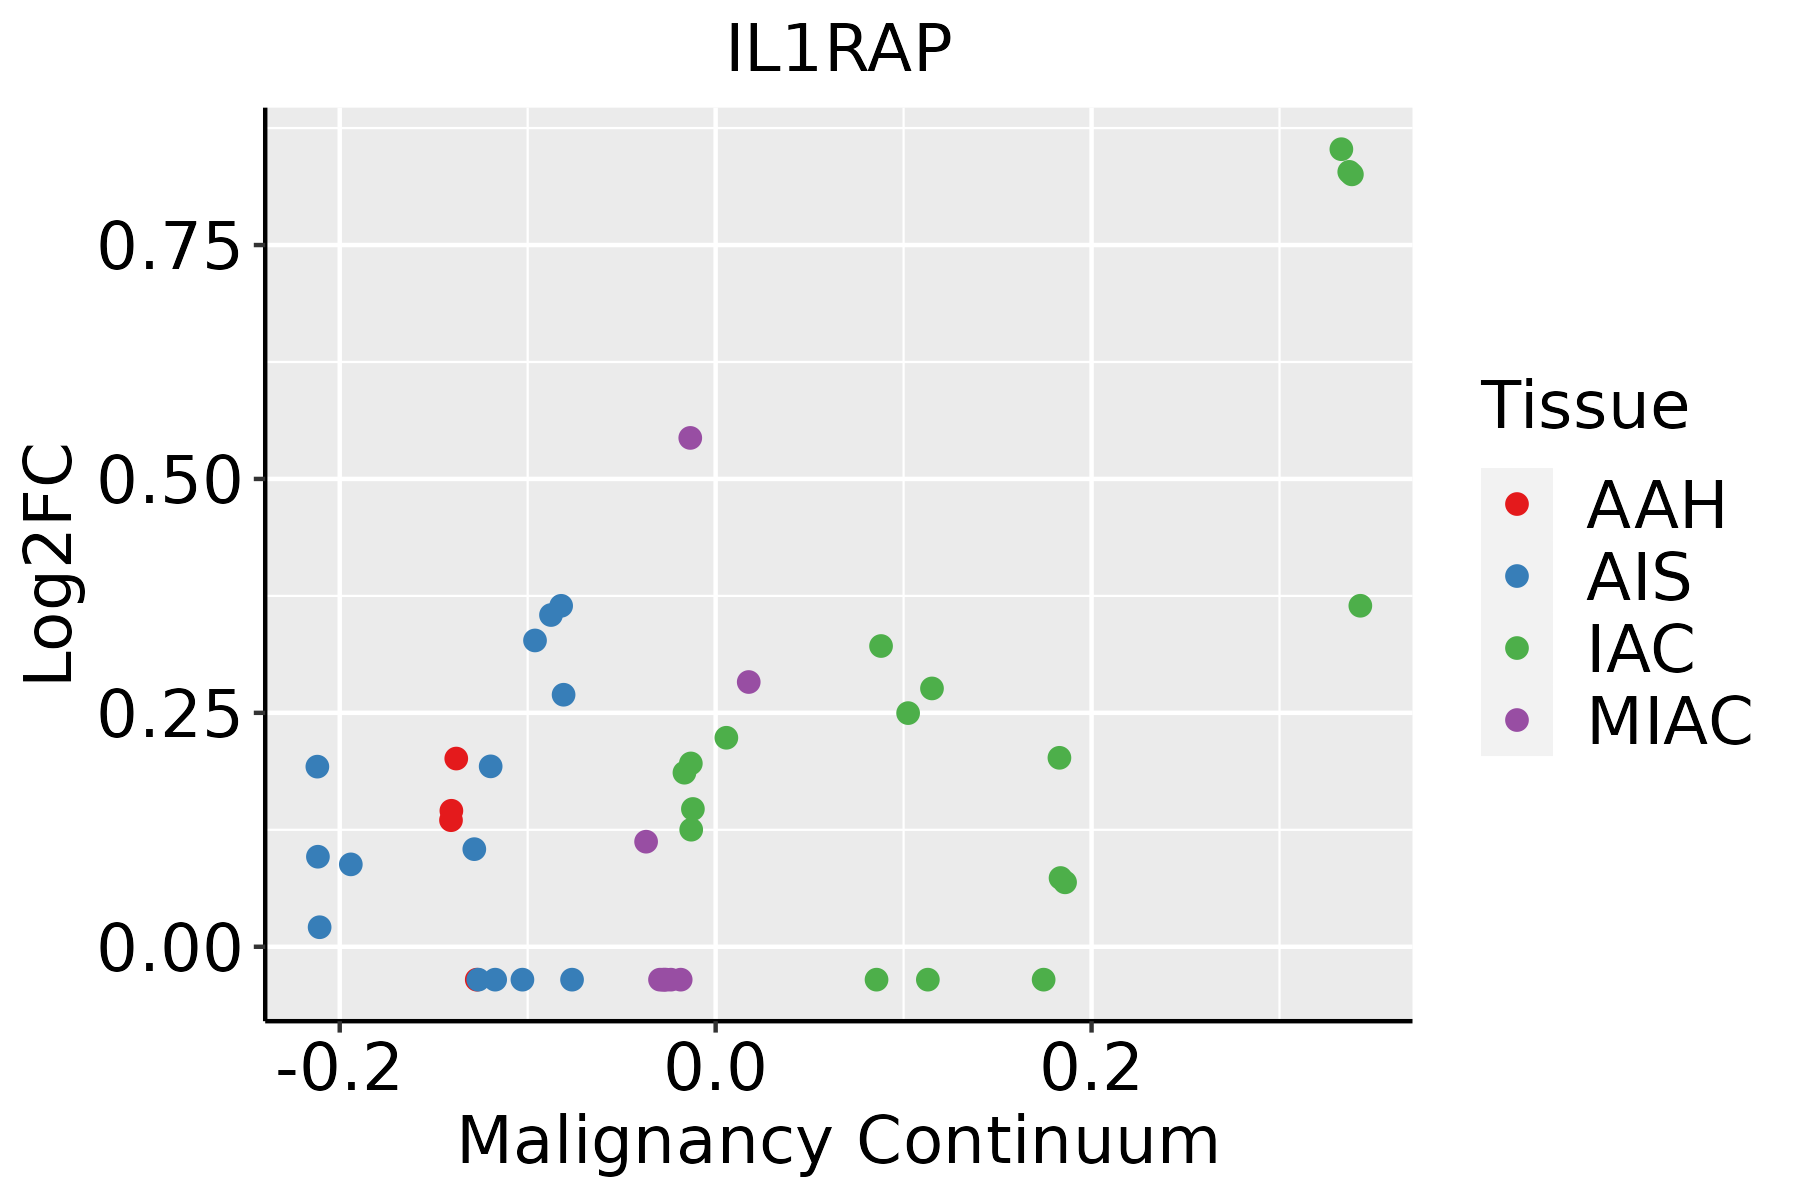 | AAH: Atypical adenomatous hyperplasia |
| AIS: Adenocarcinoma in situ | ||
| IAC: Invasive lung adenocarcinoma | ||
| MIA: Minimally invasive adenocarcinoma | ||
| Oral Cavity | 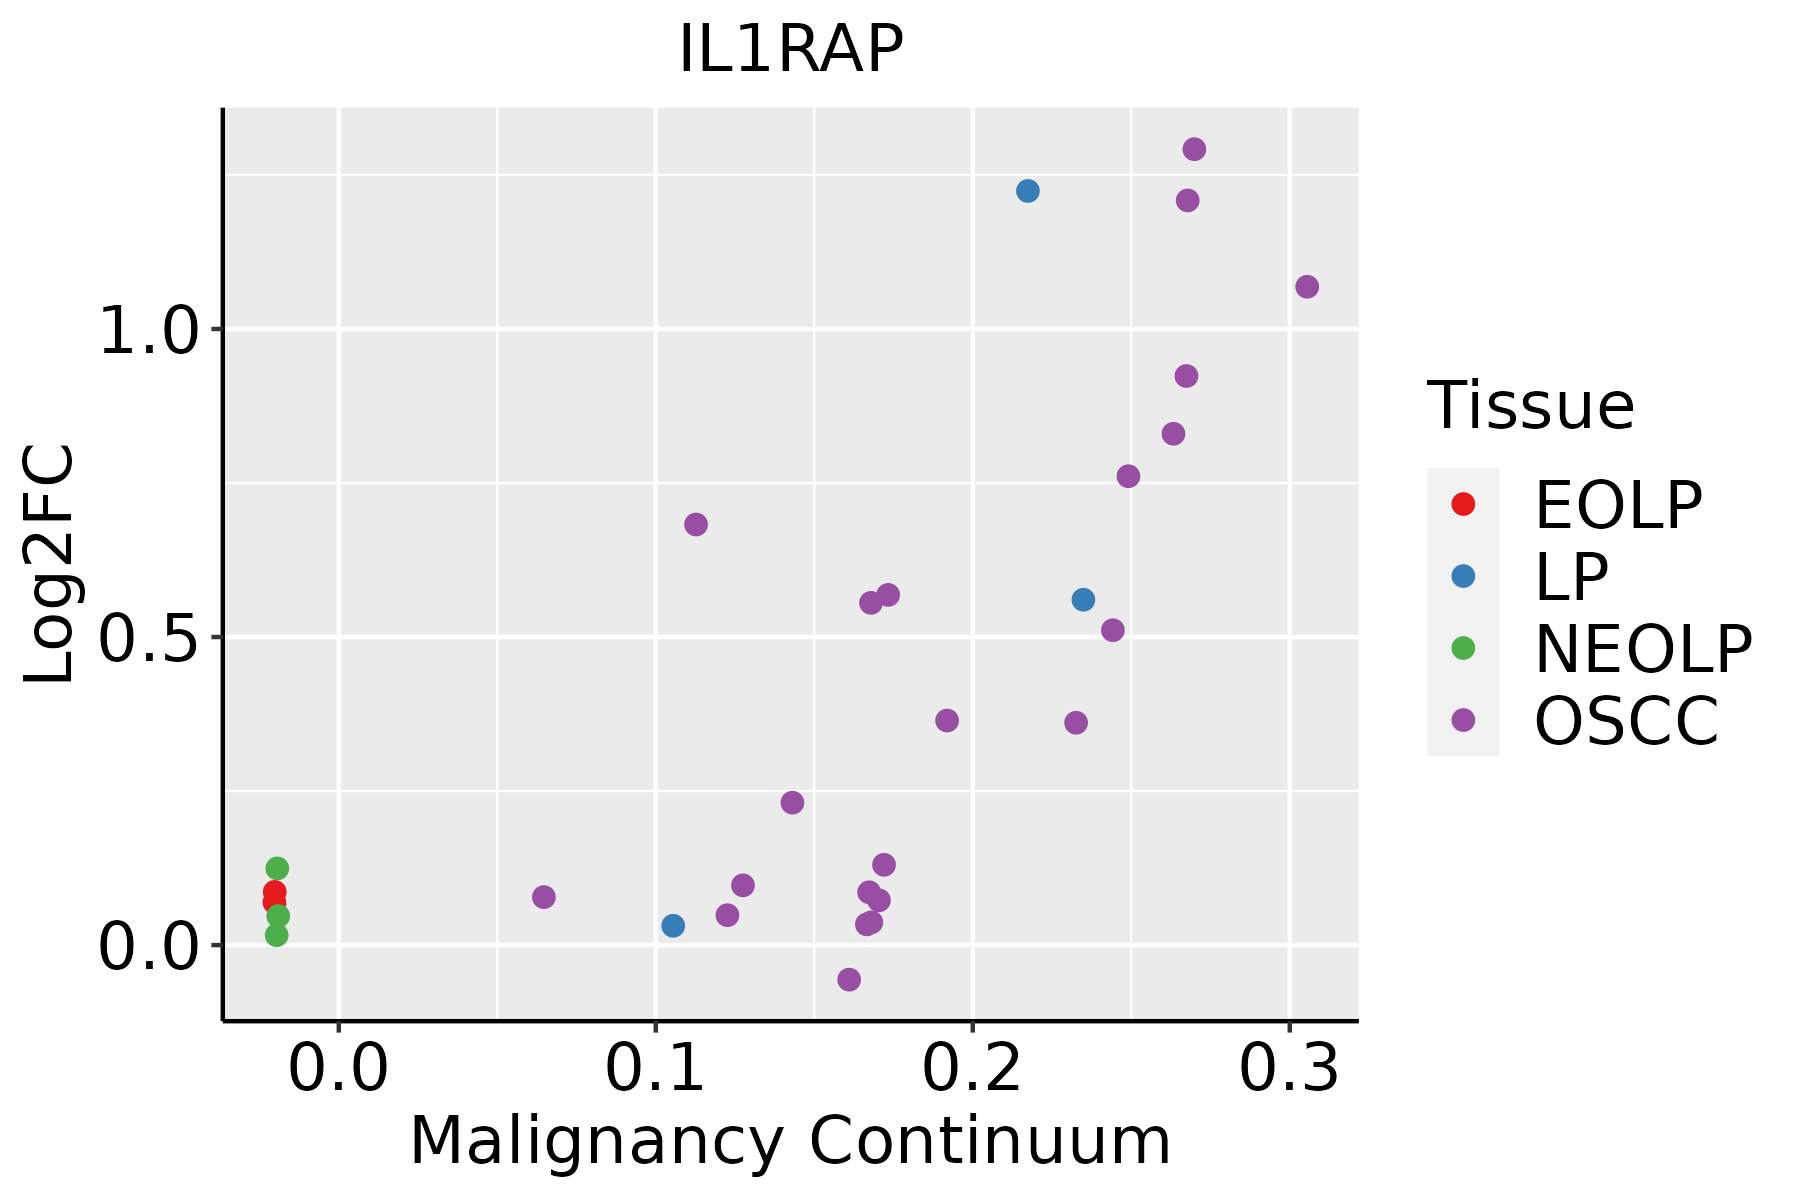 | EOLP: Erosive Oral lichen planus |
| LP: leukoplakia | ||
| NEOLP: Non-erosive oral lichen planus | ||
| OSCC: Oral squamous cell carcinoma | ||
| Skin |  | AK: Actinic keratosis |
| cSCC: Cutaneous squamous cell carcinoma | ||
| SCCIS:squamous cell carcinoma in situ | ||
| Thyroid | 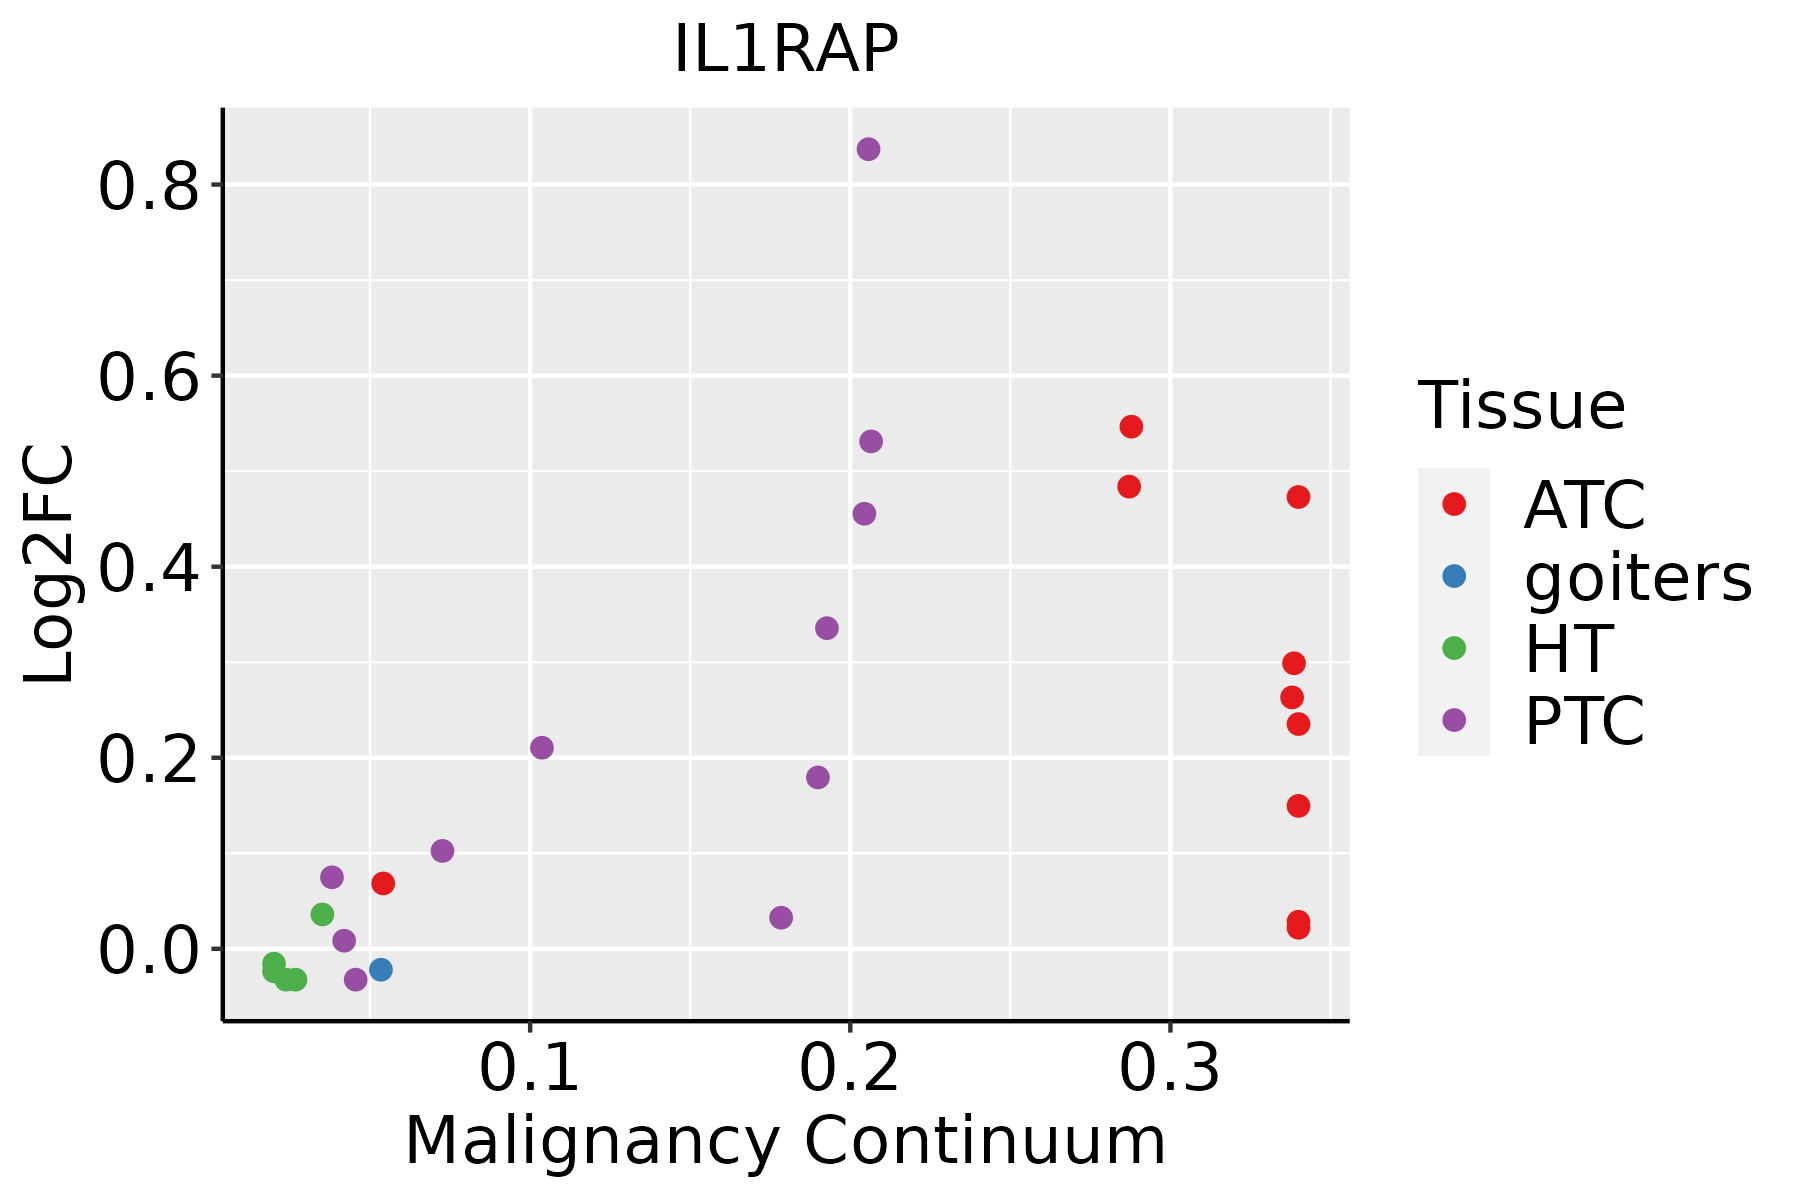 | ATC: Anaplastic thyroid cancer |
| HT: Hashimoto's thyroiditis | ||
| PTC: Papillary thyroid cancer |
| ∗log2FC in expression of this searched gene in stem-like cells from each diseased tissue sample relative to stem-like cells in normal samples in each tissue plotted against the malignancy continuum. Samples are colored based on if they are from different disease stage. |
Top |
Malignant transformation related pathway analysis |
| Find out the enriched GO biological processes and KEGG pathways involved in transition from healthy to precancer to cancer |
| Tissue | Disease Stage | Enriched GO biological Processes |
| Colorectum | AD |  |
| Colorectum | SER |  |
| Colorectum | MSS |  |
| Colorectum | MSI-H |  |
| Colorectum | FAP |  |
| ∗Top 15 enriched GO BP terms are showed in the bar plot of each disease state in each tissue. Each row represents a significant GO biological process which is colored according to the -log10(p.adjust). |
| Page: 1 2 3 4 5 6 7 8 9 |
| GO ID | Tissue | Disease Stage | Description | Gene Ratio | Bg Ratio | pvalue | p.adjust | Count |
| GO:00343298 | Cervix | CC | cell junction assembly | 88/2311 | 420/18723 | 3.42e-07 | 1.38e-05 | 88 |
| GO:00018197 | Cervix | CC | positive regulation of cytokine production | 95/2311 | 467/18723 | 4.88e-07 | 1.85e-05 | 95 |
| GO:00510904 | Cervix | CC | regulation of DNA-binding transcription factor activity | 87/2311 | 440/18723 | 4.85e-06 | 1.22e-04 | 87 |
| GO:19021153 | Cervix | CC | regulation of organelle assembly | 40/2311 | 186/18723 | 2.92e-04 | 3.15e-03 | 40 |
| GO:00192213 | Cervix | CC | cytokine-mediated signaling pathway | 84/2311 | 472/18723 | 3.25e-04 | 3.44e-03 | 84 |
| GO:00510915 | Cervix | CC | positive regulation of DNA-binding transcription factor activity | 51/2311 | 260/18723 | 5.05e-04 | 4.92e-03 | 51 |
| GO:19018886 | Cervix | CC | regulation of cell junction assembly | 42/2311 | 204/18723 | 5.50e-04 | 5.29e-03 | 42 |
| GO:00519603 | Cervix | CC | regulation of nervous system development | 77/2311 | 443/18723 | 1.13e-03 | 9.30e-03 | 77 |
| GO:00510923 | Cervix | CC | positive regulation of NF-kappaB transcription factor activity | 32/2311 | 152/18723 | 1.62e-03 | 1.25e-02 | 32 |
| GO:00519622 | Cervix | CC | positive regulation of nervous system development | 48/2311 | 272/18723 | 6.60e-03 | 3.65e-02 | 48 |
| GO:0022604 | Colorectum | AD | regulation of cell morphogenesis | 109/3918 | 309/18723 | 3.08e-09 | 2.07e-07 | 109 |
| GO:0034329 | Colorectum | AD | cell junction assembly | 136/3918 | 420/18723 | 2.02e-08 | 1.15e-06 | 136 |
| GO:0010975 | Colorectum | AD | regulation of neuron projection development | 129/3918 | 445/18723 | 2.88e-05 | 5.37e-04 | 129 |
| GO:0031346 | Colorectum | AD | positive regulation of cell projection organization | 104/3918 | 353/18723 | 8.26e-05 | 1.30e-03 | 104 |
| GO:0071709 | Colorectum | AD | membrane assembly | 22/3918 | 50/18723 | 2.00e-04 | 2.66e-03 | 22 |
| GO:0010769 | Colorectum | AD | regulation of cell morphogenesis involved in differentiation | 35/3918 | 96/18723 | 3.26e-04 | 3.85e-03 | 35 |
| GO:0010770 | Colorectum | AD | positive regulation of cell morphogenesis involved in differentiation | 30/3918 | 79/18723 | 3.81e-04 | 4.38e-03 | 30 |
| GO:0010720 | Colorectum | AD | positive regulation of cell development | 87/3918 | 298/18723 | 4.17e-04 | 4.71e-03 | 87 |
| GO:0044091 | Colorectum | AD | membrane biogenesis | 22/3918 | 55/18723 | 9.88e-04 | 9.28e-03 | 22 |
| GO:1901888 | Colorectum | AD | regulation of cell junction assembly | 61/3918 | 204/18723 | 1.50e-03 | 1.27e-02 | 61 |
| Page: 1 2 3 4 5 6 7 8 9 |
| Pathway ID | Tissue | Disease Stage | Description | Gene Ratio | Bg Ratio | pvalue | p.adjust | qvalue | Count |
| hsa046596 | Cervix | CC | Th17 cell differentiation | 28/1267 | 108/8465 | 1.99e-03 | 7.98e-03 | 4.72e-03 | 28 |
| hsa040109 | Cervix | CC | MAPK signaling pathway | 62/1267 | 302/8465 | 4.89e-03 | 1.67e-02 | 9.86e-03 | 62 |
| hsa0465911 | Cervix | CC | Th17 cell differentiation | 28/1267 | 108/8465 | 1.99e-03 | 7.98e-03 | 4.72e-03 | 28 |
| hsa0401012 | Cervix | CC | MAPK signaling pathway | 62/1267 | 302/8465 | 4.89e-03 | 1.67e-02 | 9.86e-03 | 62 |
| hsa046599 | Esophagus | ESCC | Th17 cell differentiation | 68/4205 | 108/8465 | 3.53e-03 | 9.30e-03 | 4.76e-03 | 68 |
| hsa0465914 | Esophagus | ESCC | Th17 cell differentiation | 68/4205 | 108/8465 | 3.53e-03 | 9.30e-03 | 4.76e-03 | 68 |
| hsa040108 | Lung | IAC | MAPK signaling pathway | 62/1053 | 302/8465 | 3.54e-05 | 6.38e-04 | 4.24e-04 | 62 |
| hsa04659 | Lung | IAC | Th17 cell differentiation | 26/1053 | 108/8465 | 5.91e-04 | 5.34e-03 | 3.54e-03 | 26 |
| hsa0401011 | Lung | IAC | MAPK signaling pathway | 62/1053 | 302/8465 | 3.54e-05 | 6.38e-04 | 4.24e-04 | 62 |
| hsa046591 | Lung | IAC | Th17 cell differentiation | 26/1053 | 108/8465 | 5.91e-04 | 5.34e-03 | 3.54e-03 | 26 |
| hsa0401014 | Oral cavity | OSCC | MAPK signaling pathway | 165/3704 | 302/8465 | 7.11e-05 | 2.74e-04 | 1.40e-04 | 165 |
| hsa046598 | Oral cavity | OSCC | Th17 cell differentiation | 65/3704 | 108/8465 | 4.02e-04 | 1.25e-03 | 6.35e-04 | 65 |
| hsa0401015 | Oral cavity | OSCC | MAPK signaling pathway | 165/3704 | 302/8465 | 7.11e-05 | 2.74e-04 | 1.40e-04 | 165 |
| hsa0465913 | Oral cavity | OSCC | Th17 cell differentiation | 65/3704 | 108/8465 | 4.02e-04 | 1.25e-03 | 6.35e-04 | 65 |
| Page: 1 |
Top |
Cell-cell communication analysis |
| Identification of potential cell-cell interactions between two cell types and their ligand-receptor pairs for different disease states |
| Ligand | Receptor | LRpair | Pathway | Tissue | Disease Stage |
| IL1B | IL1R1_IL1RAP | IL1B_IL1R1_IL1RAP | IL1 | Breast | DCIS |
| IL1A | IL1R1_IL1RAP | IL1A_IL1R1_IL1RAP | IL1 | Cervix | CC |
| IL1B | IL1R1_IL1RAP | IL1B_IL1R1_IL1RAP | IL1 | Cervix | CC |
| IL1A | IL1R1_IL1RAP | IL1A_IL1R1_IL1RAP | IL1 | HNSCC | Precancer |
| IL1B | IL1R1_IL1RAP | IL1B_IL1R1_IL1RAP | IL1 | HNSCC | Precancer |
| IL33 | IL1RL1_IL1RAP | IL33_IL1RL1_IL1RAP | IL1 | HNSCC | Precancer |
| IL1B | IL1R1_IL1RAP | IL1B_IL1R1_IL1RAP | IL1 | Liver | Healthy |
| IL1B | IL1R1_IL1RAP | IL1B_IL1R1_IL1RAP | IL1 | Liver | Precancer |
| IL1B | IL1R1_IL1RAP | IL1B_IL1R1_IL1RAP | IL1 | Lung | AIS |
| IL1A | IL1R1_IL1RAP | IL1A_IL1R1_IL1RAP | IL1 | Lung | IAC |
| IL1B | IL1R1_IL1RAP | IL1B_IL1R1_IL1RAP | IL1 | Lung | IAC |
| IL1A | IL1R1_IL1RAP | IL1A_IL1R1_IL1RAP | IL1 | Lung | MIAC |
| IL1B | IL1R1_IL1RAP | IL1B_IL1R1_IL1RAP | IL1 | Lung | MIAC |
| IL1B | IL1R1_IL1RAP | IL1B_IL1R1_IL1RAP | IL1 | Lung | Precancer |
| IL1B | IL1R1_IL1RAP | IL1B_IL1R1_IL1RAP | IL1 | Skin | ADJ |
| IL1B | IL1R1_IL1RAP | IL1B_IL1R1_IL1RAP | IL1 | Skin | AK |
| IL1B | IL1R1_IL1RAP | IL1B_IL1R1_IL1RAP | IL1 | Skin | SCCIS |
| IL1B | IL1R1_IL1RAP | IL1B_IL1R1_IL1RAP | IL1 | THCA | Cancer |
| IL1B | IL1R1_IL1RAP | IL1B_IL1R1_IL1RAP | IL1 | THCA | PTC |
| Page: 1 |
Top |
Single-cell gene regulatory network inference analysis |
| Find out the significant the regulons (TFs) and the target genes of each regulon across cell types for different disease states |
| TF | Cell Type | Tissue | Disease Stage | Target Gene | RSS | Regulon Activity |
| ∗The dot plots of a searched regulon are shown for all cell subpopulations in each disease state of each tissue based on the regulon specific score inferred using pySCENIC and by calculating the average expression. |
| Page: 1 |
Top |
Somatic mutation of malignant transformation related genes |
| Annotation of somatic variants for genes involved in malignant transformation |
| Hugo Symbol | Variant Class | Variant Classification | dbSNP RS | HGVSc | HGVSp | HGVSp Short | SWISSPROT | BIOTYPE | SIFT | PolyPhen | Tumor Sample Barcode | Tissue | Histology | Sex | Age | Stage | Therapy Types | Drugs | Outcome |
| IL1RAP | SNV | Missense_Mutation | novel | c.2017N>T | p.His673Tyr | p.H673Y | Q9NPH3 | protein_coding | tolerated_low_confidence(0.09) | benign(0.099) | TCGA-3C-AALI-01 | Breast | breast invasive carcinoma | Female | <65 | I/II | Unspecific | Poly E | Complete Response |
| IL1RAP | SNV | Missense_Mutation | c.635N>C | p.Cys212Ser | p.C212S | Q9NPH3 | protein_coding | deleterious(0) | probably_damaging(0.985) | TCGA-A2-A0CX-01 | Breast | breast invasive carcinoma | Female | <65 | I/II | Chemotherapy | adriamycin | SD | |
| IL1RAP | SNV | Missense_Mutation | novel | c.957N>T | p.Lys319Asn | p.K319N | Q9NPH3 | protein_coding | tolerated(0.16) | possibly_damaging(0.446) | TCGA-AN-A046-01 | Breast | breast invasive carcinoma | Female | >=65 | I/II | Unknown | Unknown | SD |
| IL1RAP | SNV | Missense_Mutation | c.1969N>T | p.Gly657Cys | p.G657C | Q9NPH3 | protein_coding | deleterious_low_confidence(0.05) | probably_damaging(0.999) | TCGA-D8-A1JP-01 | Breast | breast invasive carcinoma | Female | >=65 | I/II | Hormone Therapy | tamoxiphen | SD | |
| IL1RAP | SNV | Missense_Mutation | c.464N>A | p.Ile155Asn | p.I155N | Q9NPH3 | protein_coding | tolerated(0.32) | benign(0.001) | TCGA-D8-A1XK-01 | Breast | breast invasive carcinoma | Female | <65 | I/II | Chemotherapy | doxorubicine+cyclophosphamide | SD | |
| IL1RAP | SNV | Missense_Mutation | c.1621N>T | p.Arg541Trp | p.R541W | Q9NPH3 | protein_coding | deleterious(0) | probably_damaging(0.999) | TCGA-D8-A1Y1-01 | Breast | breast invasive carcinoma | Female | >=65 | III/IV | Hormone Therapy | tamoxiphen | PD | |
| IL1RAP | SNV | Missense_Mutation | c.1537N>G | p.Leu513Val | p.L513V | Q9NPH3 | protein_coding | tolerated(0.08) | possibly_damaging(0.542) | TCGA-D8-A27G-01 | Breast | breast invasive carcinoma | Female | >=65 | I/II | Unknown | Unknown | SD | |
| IL1RAP | SNV | Missense_Mutation | novel | c.770A>G | p.Glu257Gly | p.E257G | Q9NPH3 | protein_coding | deleterious(0.03) | possibly_damaging(0.681) | TCGA-OL-A66P-01 | Breast | breast invasive carcinoma | Female | >=65 | I/II | Chemotherapy | cytoxan | CR |
| IL1RAP | SNV | Missense_Mutation | novel | c.2020C>A | p.His674Asn | p.H674N | Q9NPH3 | protein_coding | deleterious_low_confidence(0.02) | possibly_damaging(0.736) | TCGA-V7-A7HQ-01 | Breast | breast invasive carcinoma | Female | >=65 | III/IV | Hormone Therapy | letrozole | CR |
| IL1RAP | SNV | Missense_Mutation | rs781271382 | c.130C>T | p.Arg44Cys | p.R44C | Q9NPH3 | protein_coding | deleterious(0.03) | benign(0.014) | TCGA-2W-A8YY-01 | Cervix | cervical & endocervical cancer | Female | <65 | I/II | Chemotherapy | cisplatin | CR |
| Page: 1 2 3 4 5 6 7 |
Top |
Related drugs of malignant transformation related genes |
| Identification of chemicals and drugs interact with genes involved in malignant transfromation |
| (DGIdb 4.0) |
| Entrez ID | Symbol | Category | Interaction Types | Drug Claim Name | Drug Name | PMIDs |
| Page: 1 |

Copyright 2023-Present -The University of Texas Health Science Center at Houston |