
|
|||||
|
 | |
| |
| |
| |
| |
| |
|
Gene: IL1R1 |
Gene summary for IL1R1 |
| Gene information | Species | Human | Gene symbol | IL1R1 | Gene ID | 3554 |
| Gene name | interleukin 1 receptor type 1 | |
| Gene Alias | CD121A | |
| Cytomap | 2q11.2-q12.1 | |
| Gene Type | protein-coding | GO ID | GO:0001816 | UniProtAcc | P14778 |
Top |
Malignant transformation analysis |
| Identification of the aberrant gene expression in precancerous and cancerous lesions by comparing the gene expression of stem-like cells in diseased tissues with normal stem cells |
| Entrez ID | Symbol | Replicates | Species | Organ | Tissue | Adj P-value | Log2FC | Malignancy |
| 3554 | IL1R1 | CA_HPV_1 | Human | Cervix | CC | 6.33e-11 | -4.53e-01 | 0.0264 |
| 3554 | IL1R1 | CA_HPV_2 | Human | Cervix | CC | 2.72e-05 | -3.92e-01 | 0.0391 |
| 3554 | IL1R1 | CA_HPV_3 | Human | Cervix | CC | 1.26e-09 | -4.86e-01 | 0.0414 |
| 3554 | IL1R1 | N_HPV_1 | Human | Cervix | N_HPV | 2.36e-06 | -4.13e-01 | 0.0079 |
| 3554 | IL1R1 | N_HPV_2 | Human | Cervix | N_HPV | 3.23e-05 | -3.46e-01 | -0.0131 |
| 3554 | IL1R1 | CCI_1 | Human | Cervix | CC | 2.77e-05 | -7.32e-02 | 0.528 |
| 3554 | IL1R1 | CCI_3 | Human | Cervix | CC | 2.80e-02 | -4.37e-01 | 0.516 |
| 3554 | IL1R1 | CCII_1 | Human | Cervix | CC | 5.10e-10 | -5.44e-01 | 0.3249 |
| 3554 | IL1R1 | Tumor | Human | Cervix | CC | 9.16e-04 | -3.58e-01 | 0.1241 |
| 3554 | IL1R1 | sample1 | Human | Cervix | CC | 3.62e-06 | -5.07e-01 | 0.0959 |
| 3554 | IL1R1 | sample3 | Human | Cervix | CC | 1.07e-11 | -3.40e-01 | 0.1387 |
| 3554 | IL1R1 | L1 | Human | Cervix | CC | 4.23e-09 | -5.36e-01 | 0.0802 |
| 3554 | IL1R1 | T1 | Human | Cervix | CC | 6.11e-12 | -5.02e-01 | 0.0918 |
| 3554 | IL1R1 | T2 | Human | Cervix | CC | 6.19e-03 | 1.33e-01 | 0.0709 |
| 3554 | IL1R1 | T3 | Human | Cervix | CC | 7.64e-10 | -3.44e-01 | 0.1389 |
| 3554 | IL1R1 | NAFLD1 | Human | Liver | NAFLD | 1.21e-06 | 7.72e-01 | -0.04 |
| 3554 | IL1R1 | S41 | Human | Liver | Cirrhotic | 4.66e-06 | 6.73e-01 | -0.0343 |
| 3554 | IL1R1 | S43 | Human | Liver | Cirrhotic | 1.64e-03 | 1.54e-01 | -0.0187 |
| 3554 | IL1R1 | HCC1_Meng | Human | Liver | HCC | 1.69e-24 | -1.04e-01 | 0.0246 |
| 3554 | IL1R1 | HCC2_Meng | Human | Liver | HCC | 3.08e-03 | -1.32e-01 | 0.0107 |
| Page: 1 2 3 |
| Tissue | Expression Dynamics | Abbreviation |
| Cervix |  | CC: Cervix cancer |
| HSIL_HPV: HPV-infected high-grade squamous intraepithelial lesions | ||
| N_HPV: HPV-infected normal cervix | ||
| Liver |  | HCC: Hepatocellular carcinoma |
| NAFLD: Non-alcoholic fatty liver disease | ||
| Lung |  | AAH: Atypical adenomatous hyperplasia |
| AIS: Adenocarcinoma in situ | ||
| IAC: Invasive lung adenocarcinoma | ||
| MIA: Minimally invasive adenocarcinoma | ||
| Prostate | 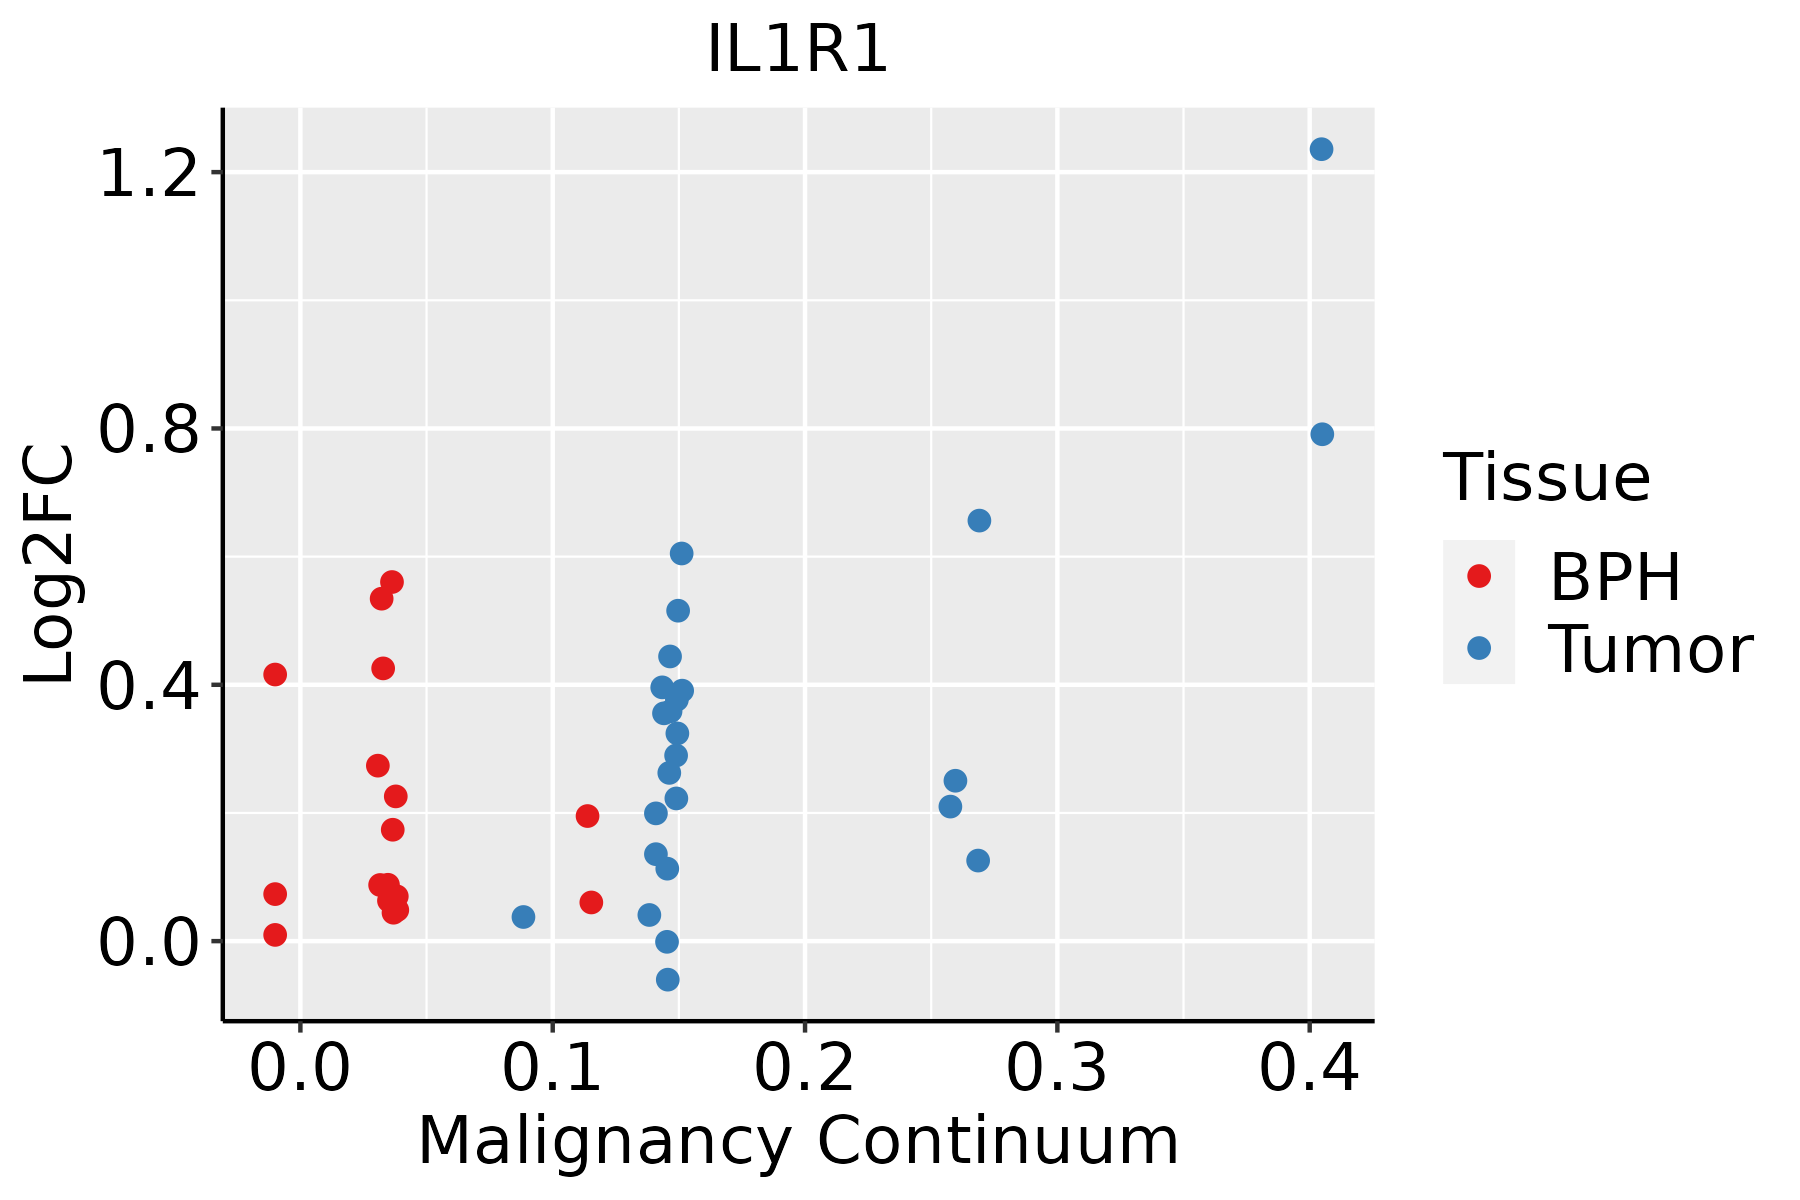 | BPH: Benign Prostatic Hyperplasia |
| Thyroid |  | ATC: Anaplastic thyroid cancer |
| HT: Hashimoto's thyroiditis | ||
| PTC: Papillary thyroid cancer |
| ∗log2FC in expression of this searched gene in stem-like cells from each diseased tissue sample relative to stem-like cells in normal samples in each tissue plotted against the malignancy continuum. Samples are colored based on if they are from different disease stage. |
Top |
Malignant transformation related pathway analysis |
| Find out the enriched GO biological processes and KEGG pathways involved in transition from healthy to precancer to cancer |
| Tissue | Disease Stage | Enriched GO biological Processes |
| Colorectum | AD |  |
| Colorectum | SER |  |
| Colorectum | MSS |  |
| Colorectum | MSI-H |  |
| Colorectum | FAP |  |
| ∗Top 15 enriched GO BP terms are showed in the bar plot of each disease state in each tissue. Each row represents a significant GO biological process which is colored according to the -log10(p.adjust). |
| Page: 1 2 3 4 5 6 7 8 9 |
| GO ID | Tissue | Disease Stage | Description | Gene Ratio | Bg Ratio | pvalue | p.adjust | Count |
| GO:00975298 | Cervix | CC | myeloid leukocyte migration | 56/2311 | 220/18723 | 7.21e-08 | 4.15e-06 | 56 |
| GO:00018197 | Cervix | CC | positive regulation of cytokine production | 95/2311 | 467/18723 | 4.88e-07 | 1.85e-05 | 95 |
| GO:00509007 | Cervix | CC | leukocyte migration | 78/2311 | 369/18723 | 1.09e-06 | 3.80e-05 | 78 |
| GO:00975308 | Cervix | CC | granulocyte migration | 39/2311 | 148/18723 | 2.67e-06 | 7.87e-05 | 39 |
| GO:00026857 | Cervix | CC | regulation of leukocyte migration | 50/2311 | 210/18723 | 2.95e-06 | 8.31e-05 | 50 |
| GO:00026878 | Cervix | CC | positive regulation of leukocyte migration | 35/2311 | 135/18723 | 1.25e-05 | 2.60e-04 | 35 |
| GO:19902666 | Cervix | CC | neutrophil migration | 32/2311 | 122/18723 | 2.25e-05 | 4.00e-04 | 32 |
| GO:00507273 | Cervix | CC | regulation of inflammatory response | 75/2311 | 386/18723 | 3.95e-05 | 6.18e-04 | 75 |
| GO:19026244 | Cervix | CC | positive regulation of neutrophil migration | 11/2311 | 28/18723 | 2.84e-04 | 3.07e-03 | 11 |
| GO:00192213 | Cervix | CC | cytokine-mediated signaling pathway | 84/2311 | 472/18723 | 3.25e-04 | 3.44e-03 | 84 |
| GO:00024564 | Cervix | CC | T cell mediated immunity | 26/2311 | 109/18723 | 6.39e-04 | 5.97e-03 | 26 |
| GO:00027118 | Cervix | CC | positive regulation of T cell mediated immunity | 16/2311 | 56/18723 | 8.97e-04 | 7.74e-03 | 16 |
| GO:00026973 | Cervix | CC | regulation of immune effector process | 62/2311 | 339/18723 | 9.25e-04 | 7.84e-03 | 62 |
| GO:00027201 | Cervix | CC | positive regulation of cytokine production involved in immune response | 17/2311 | 65/18723 | 1.84e-03 | 1.37e-02 | 17 |
| GO:00027095 | Cervix | CC | regulation of T cell mediated immunity | 20/2311 | 85/18723 | 3.04e-03 | 2.00e-02 | 20 |
| GO:00024603 | Cervix | CC | adaptive immune response based on somatic recombination of immune receptors built from immunoglobulin superfamily domains | 62/2311 | 356/18723 | 3.09e-03 | 2.03e-02 | 62 |
| GO:0002443 | Cervix | CC | leukocyte mediated immunity | 73/2311 | 440/18723 | 5.01e-03 | 2.98e-02 | 73 |
| GO:0002699 | Cervix | CC | positive regulation of immune effector process | 43/2311 | 235/18723 | 5.13e-03 | 3.02e-02 | 43 |
| GO:0002819 | Cervix | CC | regulation of adaptive immune response | 35/2311 | 183/18723 | 5.38e-03 | 3.11e-02 | 35 |
| GO:00019612 | Cervix | CC | positive regulation of cytokine-mediated signaling pathway | 13/2311 | 50/18723 | 6.42e-03 | 3.58e-02 | 13 |
| Page: 1 2 3 4 5 |
| Pathway ID | Tissue | Disease Stage | Description | Gene Ratio | Bg Ratio | pvalue | p.adjust | qvalue | Count |
| hsa0541820 | Cervix | CC | Fluid shear stress and atherosclerosis | 50/1267 | 139/8465 | 5.71e-10 | 1.32e-08 | 7.81e-09 | 50 |
| hsa0513020 | Cervix | CC | Pathogenic Escherichia coli infection | 63/1267 | 197/8465 | 9.28e-10 | 2.00e-08 | 1.19e-08 | 63 |
| hsa0516318 | Cervix | CC | Human cytomegalovirus infection | 65/1267 | 225/8465 | 4.59e-08 | 6.47e-07 | 3.83e-07 | 65 |
| hsa0513120 | Cervix | CC | Shigellosis | 69/1267 | 247/8465 | 7.64e-08 | 1.03e-06 | 6.10e-07 | 69 |
| hsa0516620 | Cervix | CC | Human T-cell leukemia virus 1 infection | 61/1267 | 222/8465 | 8.13e-07 | 7.98e-06 | 4.72e-06 | 61 |
| hsa051465 | Cervix | CC | Amoebiasis | 29/1267 | 102/8465 | 3.31e-04 | 1.70e-03 | 1.01e-03 | 29 |
| hsa046596 | Cervix | CC | Th17 cell differentiation | 28/1267 | 108/8465 | 1.99e-03 | 7.98e-03 | 4.72e-03 | 28 |
| hsa040109 | Cervix | CC | MAPK signaling pathway | 62/1267 | 302/8465 | 4.89e-03 | 1.67e-02 | 9.86e-03 | 62 |
| hsa05418110 | Cervix | CC | Fluid shear stress and atherosclerosis | 50/1267 | 139/8465 | 5.71e-10 | 1.32e-08 | 7.81e-09 | 50 |
| hsa05130110 | Cervix | CC | Pathogenic Escherichia coli infection | 63/1267 | 197/8465 | 9.28e-10 | 2.00e-08 | 1.19e-08 | 63 |
| hsa0516319 | Cervix | CC | Human cytomegalovirus infection | 65/1267 | 225/8465 | 4.59e-08 | 6.47e-07 | 3.83e-07 | 65 |
| hsa05131110 | Cervix | CC | Shigellosis | 69/1267 | 247/8465 | 7.64e-08 | 1.03e-06 | 6.10e-07 | 69 |
| hsa05166110 | Cervix | CC | Human T-cell leukemia virus 1 infection | 61/1267 | 222/8465 | 8.13e-07 | 7.98e-06 | 4.72e-06 | 61 |
| hsa0514612 | Cervix | CC | Amoebiasis | 29/1267 | 102/8465 | 3.31e-04 | 1.70e-03 | 1.01e-03 | 29 |
| hsa0465911 | Cervix | CC | Th17 cell differentiation | 28/1267 | 108/8465 | 1.99e-03 | 7.98e-03 | 4.72e-03 | 28 |
| hsa0401012 | Cervix | CC | MAPK signaling pathway | 62/1267 | 302/8465 | 4.89e-03 | 1.67e-02 | 9.86e-03 | 62 |
| hsa0513044 | Cervix | N_HPV | Pathogenic Escherichia coli infection | 25/349 | 197/8465 | 4.71e-07 | 8.00e-06 | 6.25e-06 | 25 |
| hsa0541845 | Cervix | N_HPV | Fluid shear stress and atherosclerosis | 20/349 | 139/8465 | 9.29e-07 | 1.41e-05 | 1.10e-05 | 20 |
| hsa0516643 | Cervix | N_HPV | Human T-cell leukemia virus 1 infection | 22/349 | 222/8465 | 1.17e-04 | 1.18e-03 | 9.23e-04 | 22 |
| hsa0465941 | Cervix | N_HPV | Th17 cell differentiation | 14/349 | 108/8465 | 1.30e-04 | 1.22e-03 | 9.57e-04 | 14 |
| Page: 1 2 3 4 5 6 7 |
Top |
Cell-cell communication analysis |
| Identification of potential cell-cell interactions between two cell types and their ligand-receptor pairs for different disease states |
| Ligand | Receptor | LRpair | Pathway | Tissue | Disease Stage |
| IL1B | IL1R1_IL1RAP | IL1B_IL1R1_IL1RAP | IL1 | Breast | DCIS |
| IL1A | IL1R1_IL1RAP | IL1A_IL1R1_IL1RAP | IL1 | Cervix | CC |
| IL1B | IL1R1_IL1RAP | IL1B_IL1R1_IL1RAP | IL1 | Cervix | CC |
| IL1A | IL1R1_IL1RAP | IL1A_IL1R1_IL1RAP | IL1 | HNSCC | Precancer |
| IL1B | IL1R1_IL1RAP | IL1B_IL1R1_IL1RAP | IL1 | HNSCC | Precancer |
| IL1B | IL1R1_IL1RAP | IL1B_IL1R1_IL1RAP | IL1 | Liver | Healthy |
| IL1B | IL1R1_IL1RAP | IL1B_IL1R1_IL1RAP | IL1 | Liver | Precancer |
| IL1B | IL1R1_IL1RAP | IL1B_IL1R1_IL1RAP | IL1 | Lung | AIS |
| IL1A | IL1R1_IL1RAP | IL1A_IL1R1_IL1RAP | IL1 | Lung | IAC |
| IL1B | IL1R1_IL1RAP | IL1B_IL1R1_IL1RAP | IL1 | Lung | IAC |
| IL1A | IL1R1_IL1RAP | IL1A_IL1R1_IL1RAP | IL1 | Lung | MIAC |
| IL1B | IL1R1_IL1RAP | IL1B_IL1R1_IL1RAP | IL1 | Lung | MIAC |
| IL1B | IL1R1_IL1RAP | IL1B_IL1R1_IL1RAP | IL1 | Lung | Precancer |
| IL1B | IL1R1_IL1RAP | IL1B_IL1R1_IL1RAP | IL1 | Skin | ADJ |
| IL1B | IL1R1_IL1RAP | IL1B_IL1R1_IL1RAP | IL1 | Skin | AK |
| IL1B | IL1R1_IL1RAP | IL1B_IL1R1_IL1RAP | IL1 | Skin | SCCIS |
| IL1B | IL1R1_IL1RAP | IL1B_IL1R1_IL1RAP | IL1 | THCA | Cancer |
| IL1B | IL1R1_IL1RAP | IL1B_IL1R1_IL1RAP | IL1 | THCA | PTC |
| Page: 1 |
Top |
Single-cell gene regulatory network inference analysis |
| Find out the significant the regulons (TFs) and the target genes of each regulon across cell types for different disease states |
| TF | Cell Type | Tissue | Disease Stage | Target Gene | RSS | Regulon Activity |
| ∗The dot plots of a searched regulon are shown for all cell subpopulations in each disease state of each tissue based on the regulon specific score inferred using pySCENIC and by calculating the average expression. |
| Page: 1 |
Top |
Somatic mutation of malignant transformation related genes |
| Annotation of somatic variants for genes involved in malignant transformation |
| Hugo Symbol | Variant Class | Variant Classification | dbSNP RS | HGVSc | HGVSp | HGVSp Short | SWISSPROT | BIOTYPE | SIFT | PolyPhen | Tumor Sample Barcode | Tissue | Histology | Sex | Age | Stage | Therapy Types | Drugs | Outcome |
| IL1R1 | SNV | Missense_Mutation | c.231N>G | p.His77Gln | p.H77Q | P14778 | protein_coding | tolerated(0.94) | benign(0.011) | TCGA-AO-A0J3-01 | Breast | breast invasive carcinoma | Female | >=65 | I/II | Chemotherapy | cyclophosphamide | SD | |
| IL1R1 | SNV | Missense_Mutation | rs746389545 | c.1657N>C | p.Ser553Pro | p.S553P | P14778 | protein_coding | tolerated(0.2) | benign(0.006) | TCGA-B6-A1KN-01 | Breast | breast invasive carcinoma | Female | <65 | III/IV | Unknown | Unknown | SD |
| IL1R1 | SNV | Missense_Mutation | c.1135N>C | p.Ala379Pro | p.A379P | P14778 | protein_coding | deleterious(0.03) | benign(0.022) | TCGA-D8-A1XW-01 | Breast | breast invasive carcinoma | Female | <65 | I/II | Chemotherapy | adriamycin+cyclophosphamide | SD | |
| IL1R1 | SNV | Missense_Mutation | c.1354N>C | p.Ile452Leu | p.I452L | P14778 | protein_coding | deleterious(0.02) | benign(0.393) | TCGA-FU-A3HZ-01 | Cervix | cervical & endocervical cancer | Female | <65 | I/II | Chemotherapy | cisplatin | CR | |
| IL1R1 | SNV | Missense_Mutation | c.989N>A | p.Pro330Gln | p.P330Q | P14778 | protein_coding | deleterious(0.02) | probably_damaging(0.95) | TCGA-A6-2686-01 | Colorectum | colon adenocarcinoma | Female | >=65 | I/II | Unknown | Unknown | SD | |
| IL1R1 | SNV | Missense_Mutation | rs772263623 | c.1696G>A | p.Val566Met | p.V566M | P14778 | protein_coding | tolerated_low_confidence(0.12) | benign(0.003) | TCGA-AA-3864-01 | Colorectum | colon adenocarcinoma | Male | >=65 | I/II | Unknown | Unknown | SD |
| IL1R1 | SNV | Missense_Mutation | c.847N>G | p.Asn283Asp | p.N283D | P14778 | protein_coding | tolerated(0.44) | benign(0.013) | TCGA-AA-3956-01 | Colorectum | colon adenocarcinoma | Male | >=65 | I/II | Unknown | Unknown | SD | |
| IL1R1 | SNV | Missense_Mutation | c.237G>T | p.Glu79Asp | p.E79D | P14778 | protein_coding | tolerated(1) | benign(0.001) | TCGA-AA-3977-01 | Colorectum | colon adenocarcinoma | Male | >=65 | I/II | Unknown | Unknown | SD | |
| IL1R1 | SNV | Missense_Mutation | c.1002C>A | p.Phe334Leu | p.F334L | P14778 | protein_coding | tolerated(0.12) | benign(0.015) | TCGA-AA-3977-01 | Colorectum | colon adenocarcinoma | Male | >=65 | I/II | Unknown | Unknown | SD | |
| IL1R1 | SNV | Missense_Mutation | rs56337419 | c.76N>T | p.Arg26Cys | p.R26C | P14778 | protein_coding | tolerated(0.19) | benign(0.014) | TCGA-AZ-4313-01 | Colorectum | colon adenocarcinoma | Female | <65 | I/II | Unknown | Unknown | SD |
| Page: 1 2 3 4 5 6 |
Top |
Related drugs of malignant transformation related genes |
| Identification of chemicals and drugs interact with genes involved in malignant transfromation |
| (DGIdb 4.0) |
| Entrez ID | Symbol | Category | Interaction Types | Drug Claim Name | Drug Name | PMIDs |
| 3554 | IL1R1 | DRUGGABLE GENOME, EXTERNAL SIDE OF PLASMA MEMBRANE | antagonist | CHEMBL1201570 | ANAKINRA | |
| 3554 | IL1R1 | DRUGGABLE GENOME, EXTERNAL SIDE OF PLASMA MEMBRANE | Anakinra | ANAKINRA | ||
| 3554 | IL1R1 | DRUGGABLE GENOME, EXTERNAL SIDE OF PLASMA MEMBRANE | IL-1 | 8844493,9923819,2162889 | ||
| 3554 | IL1R1 | DRUGGABLE GENOME, EXTERNAL SIDE OF PLASMA MEMBRANE | IL-1RA | ANAKINRA | 9555664 | |
| 3554 | IL1R1 | DRUGGABLE GENOME, EXTERNAL SIDE OF PLASMA MEMBRANE | IL-1 | |||
| 3554 | IL1R1 | DRUGGABLE GENOME, EXTERNAL SIDE OF PLASMA MEMBRANE | GENISTEIN | GENISTEIN | 10400830 | |
| 3554 | IL1R1 | DRUGGABLE GENOME, EXTERNAL SIDE OF PLASMA MEMBRANE | ETHANOL | ALCOHOL | 16272348 | |
| 3554 | IL1R1 | DRUGGABLE GENOME, EXTERNAL SIDE OF PLASMA MEMBRANE | EPO | EPOETIN ALFA | 16337691 | |
| 3554 | IL1R1 | DRUGGABLE GENOME, EXTERNAL SIDE OF PLASMA MEMBRANE | RETINOIC ACID | 2465548 | ||
| 3554 | IL1R1 | DRUGGABLE GENOME, EXTERNAL SIDE OF PLASMA MEMBRANE | VITAMIN D | 12193704 |
| Page: 1 2 |

Copyright 2023-Present -The University of Texas Health Science Center at Houston |